Woodbury, GA Map & Demographics
Woodbury Map
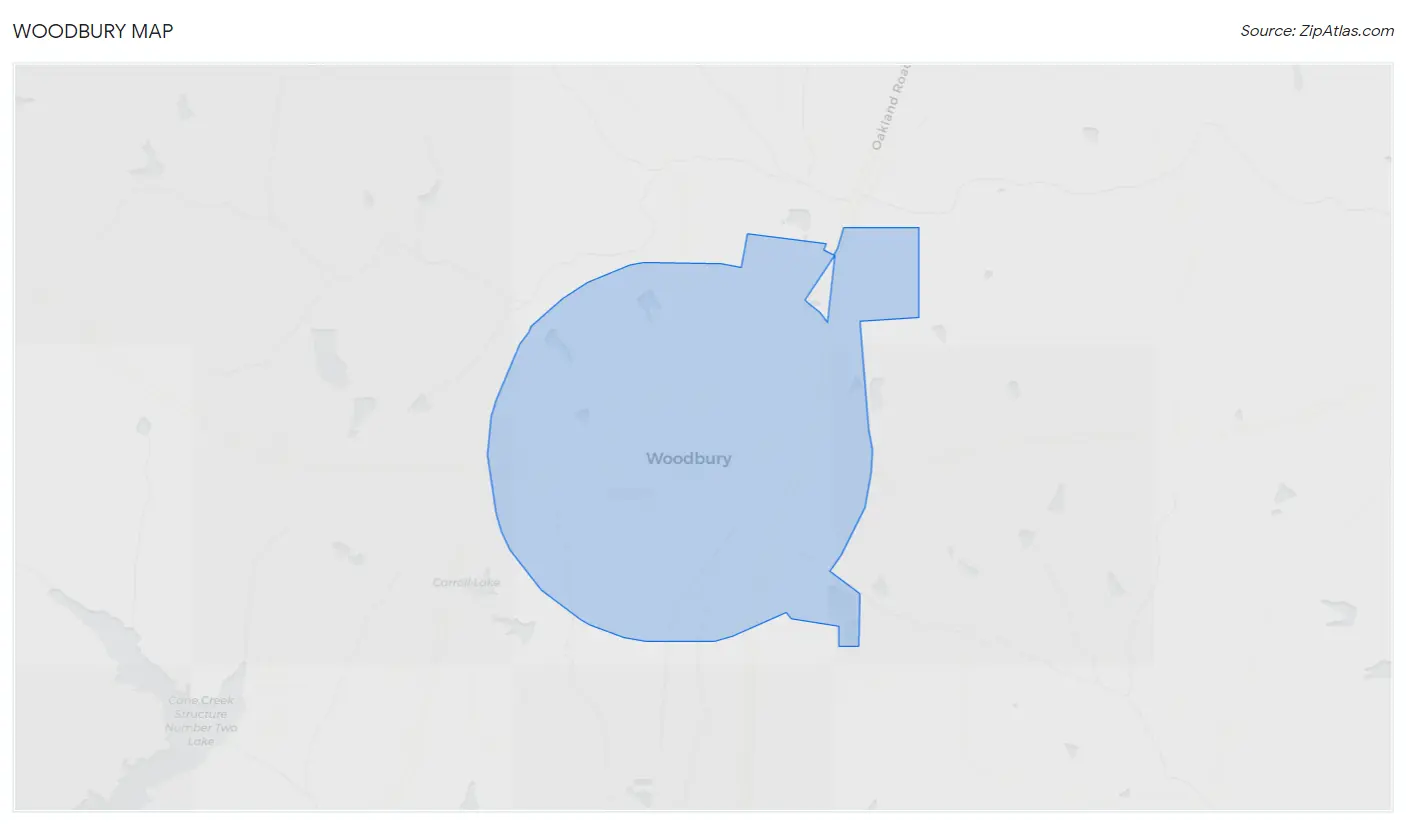
Woodbury Overview
$22,831
PER CAPITA INCOME
$53,611
AVG FAMILY INCOME
$47,292
AVG HOUSEHOLD INCOME
32.4%
WAGE / INCOME GAP [ % ]
67.6¢/ $1
WAGE / INCOME GAP [ $ ]
$13,529
FAMILY INCOME DEFICIT
0.40
INEQUALITY / GINI INDEX
872
TOTAL POPULATION
427
MALE POPULATION
445
FEMALE POPULATION
95.96
MALES / 100 FEMALES
104.22
FEMALES / 100 MALES
41.2
MEDIAN AGE
3.8
AVG FAMILY SIZE
3.0
AVG HOUSEHOLD SIZE
380
LABOR FORCE [ PEOPLE ]
53.4%
PERCENT IN LABOR FORCE
Woodbury Zip Codes
Woodbury Area Codes
Income in Woodbury
Income Overview in Woodbury
Per Capita Income in Woodbury is $22,831, while median incomes of families and households are $53,611 and $47,292 respectively.
| Characteristic | Number | Measure |
| Per Capita Income | 872 | $22,831 |
| Median Family Income | 196 | $53,611 |
| Mean Family Income | 196 | $57,921 |
| Median Household Income | 293 | $47,292 |
| Mean Household Income | 293 | $51,872 |
| Income Deficit | 196 | $13,529 |
| Wage / Income Gap (%) | 872 | 32.35% |
| Wage / Income Gap ($) | 872 | 67.65¢ per $1 |
| Gini / Inequality Index | 872 | 0.40 |
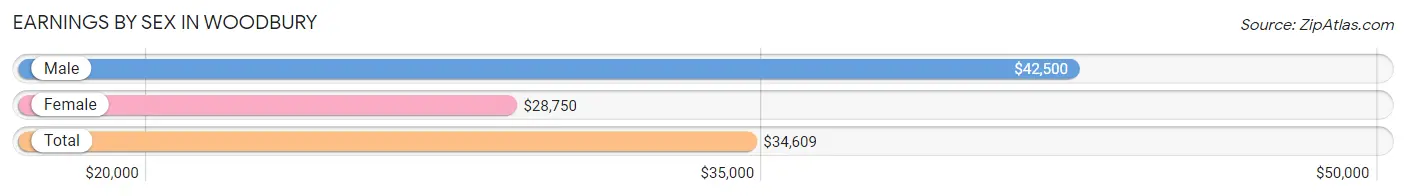
Earnings by Sex in Woodbury
Average Earnings in Woodbury are $34,609, $42,500 for men and $28,750 for women, a difference of 32.4%.
| Sex | Number | Average Earnings |
| Male | 222 (55.5%) | $42,500 |
| Female | 178 (44.5%) | $28,750 |
| Total | 400 (100.0%) | $34,609 |
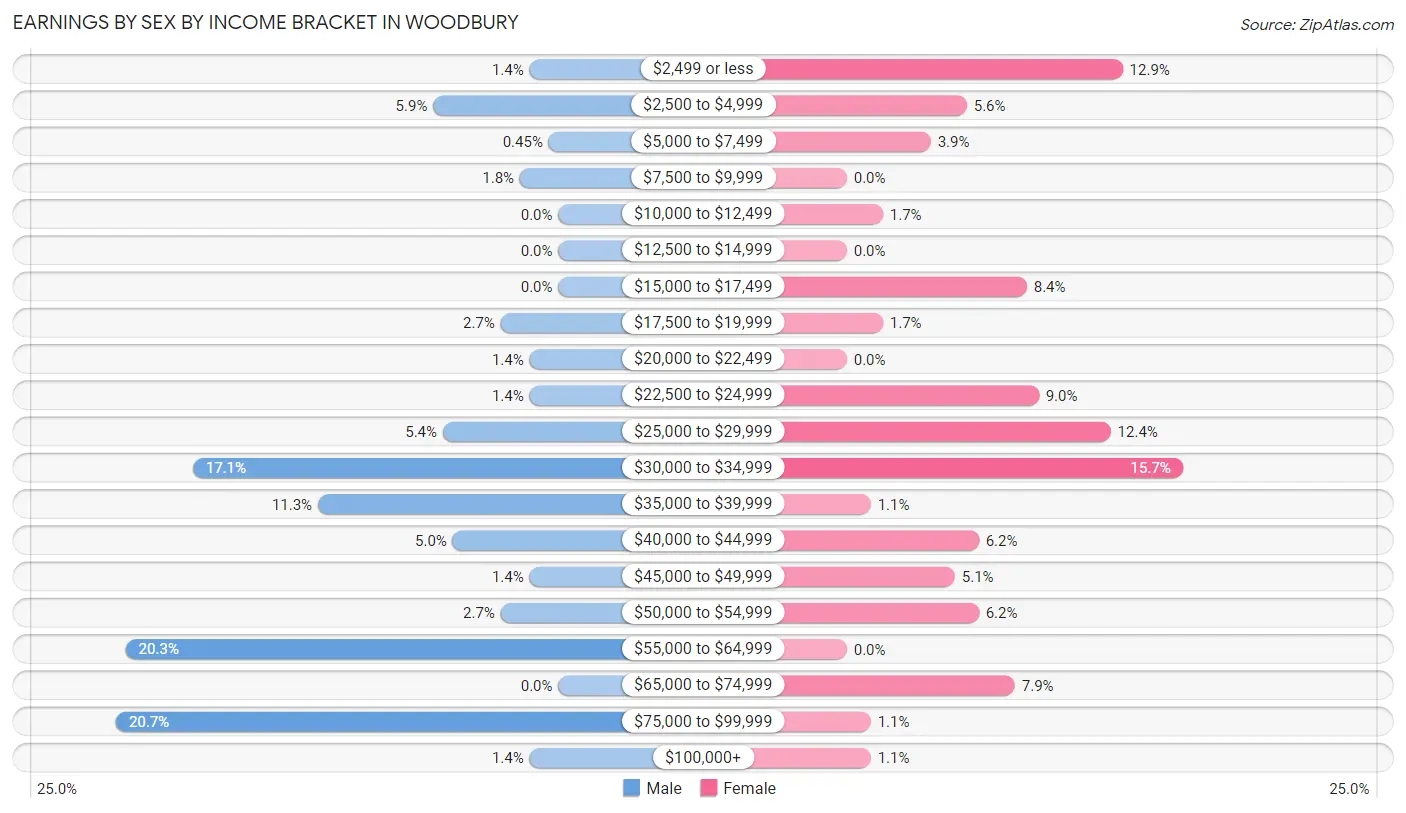
Earnings by Sex by Income Bracket in Woodbury
The most common earnings brackets in Woodbury are $75,000 to $99,999 for men (46 | 20.7%) and $30,000 to $34,999 for women (28 | 15.7%).
| Income | Male | Female |
| $2,499 or less | 3 (1.3%) | 23 (12.9%) |
| $2,500 to $4,999 | 13 (5.9%) | 10 (5.6%) |
| $5,000 to $7,499 | 1 (0.4%) | 7 (3.9%) |
| $7,500 to $9,999 | 4 (1.8%) | 0 (0.0%) |
| $10,000 to $12,499 | 0 (0.0%) | 3 (1.7%) |
| $12,500 to $14,999 | 0 (0.0%) | 0 (0.0%) |
| $15,000 to $17,499 | 0 (0.0%) | 15 (8.4%) |
| $17,500 to $19,999 | 6 (2.7%) | 3 (1.7%) |
| $20,000 to $22,499 | 3 (1.3%) | 0 (0.0%) |
| $22,500 to $24,999 | 3 (1.3%) | 16 (9.0%) |
| $25,000 to $29,999 | 12 (5.4%) | 22 (12.4%) |
| $30,000 to $34,999 | 38 (17.1%) | 28 (15.7%) |
| $35,000 to $39,999 | 25 (11.3%) | 2 (1.1%) |
| $40,000 to $44,999 | 11 (5.0%) | 11 (6.2%) |
| $45,000 to $49,999 | 3 (1.3%) | 9 (5.1%) |
| $50,000 to $54,999 | 6 (2.7%) | 11 (6.2%) |
| $55,000 to $64,999 | 45 (20.3%) | 0 (0.0%) |
| $65,000 to $74,999 | 0 (0.0%) | 14 (7.9%) |
| $75,000 to $99,999 | 46 (20.7%) | 2 (1.1%) |
| $100,000+ | 3 (1.3%) | 2 (1.1%) |
| Total | 222 (100.0%) | 178 (100.0%) |
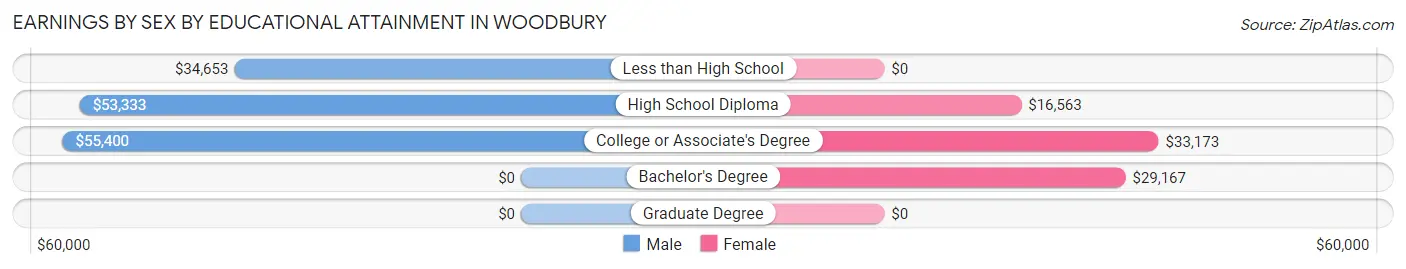
Earnings by Sex by Educational Attainment in Woodbury
Average earnings in Woodbury are $42,969 for men and $28,750 for women, a difference of 33.1%. Men with an educational attainment of college or associate's degree enjoy the highest average annual earnings of $55,400, while those with less than high school education earn the least with $34,653. Women with an educational attainment of college or associate's degree earn the most with the average annual earnings of $33,173, while those with high school diploma education have the smallest earnings of $16,563.
| Educational Attainment | Male Income | Female Income |
| Less than High School | $34,653 | $0 |
| High School Diploma | $53,333 | $16,563 |
| College or Associate's Degree | $55,400 | $33,173 |
| Bachelor's Degree | - | - |
| Graduate Degree | - | - |
| Total | $42,969 | $28,750 |
Family Income in Woodbury
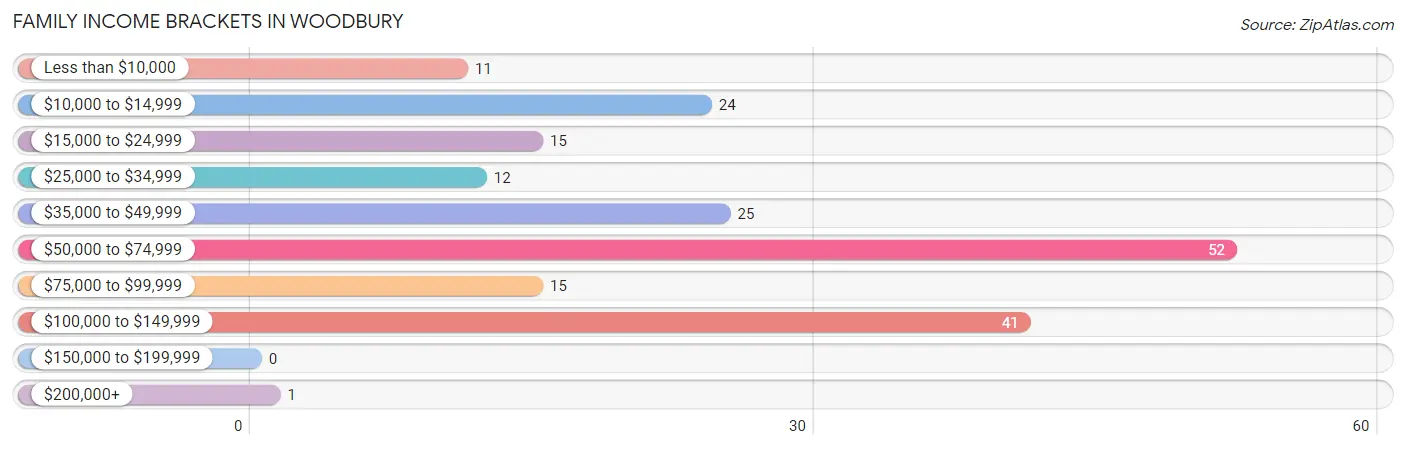
Family Income Brackets in Woodbury
According to the Woodbury family income data, there are 52 families falling into the $50,000 to $74,999 income range, which is the most common income bracket and makes up 26.5% of all families.
| Income Bracket | # Families | % Families |
| Less than $10,000 | 11 | 5.6% |
| $10,000 to $14,999 | 24 | 12.2% |
| $15,000 to $24,999 | 15 | 7.7% |
| $25,000 to $34,999 | 12 | 6.1% |
| $35,000 to $49,999 | 25 | 12.8% |
| $50,000 to $74,999 | 52 | 26.5% |
| $75,000 to $99,999 | 15 | 7.7% |
| $100,000 to $149,999 | 41 | 20.9% |
| $150,000 to $199,999 | 0 | 0.0% |
| $200,000+ | 1 | 0.5% |
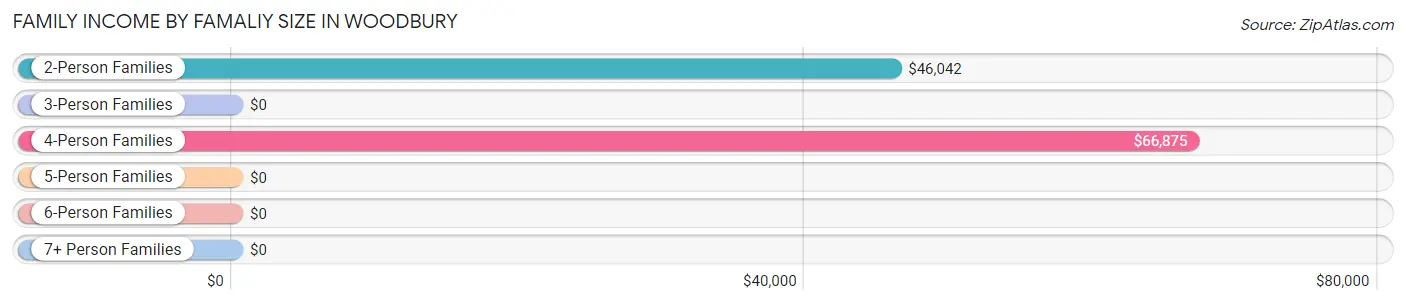
Family Income by Famaliy Size in Woodbury
4-person families (69 | 35.2%) account for the highest median family income in Woodbury with $66,875 per family, while 2-person families (67 | 34.2%) have the highest median income of $23,021 per family member.
| Income Bracket | # Families | Median Income |
| 2-Person Families | 67 (34.2%) | $46,042 |
| 3-Person Families | 33 (16.8%) | $0 |
| 4-Person Families | 69 (35.2%) | $66,875 |
| 5-Person Families | 6 (3.1%) | $0 |
| 6-Person Families | 21 (10.7%) | $0 |
| 7+ Person Families | 0 (0.0%) | $0 |
| Total | 196 (100.0%) | $53,611 |
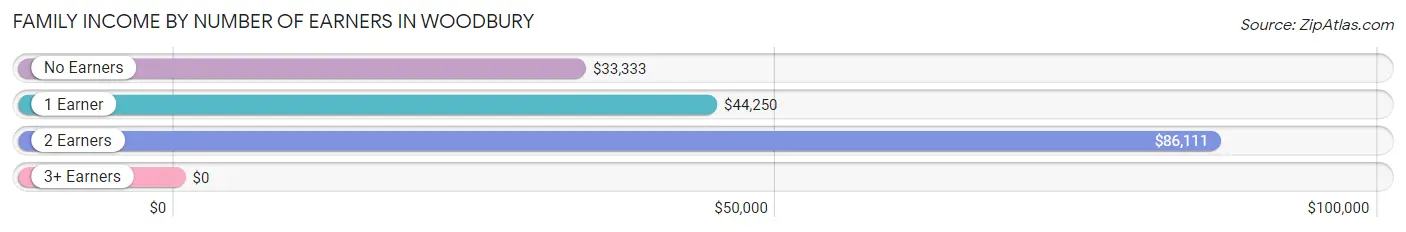
Family Income by Number of Earners in Woodbury
| Number of Earners | # Families | Median Income |
| No Earners | 26 (13.3%) | $33,333 |
| 1 Earner | 83 (42.3%) | $44,250 |
| 2 Earners | 82 (41.8%) | $86,111 |
| 3+ Earners | 5 (2.5%) | $0 |
| Total | 196 (100.0%) | $53,611 |
Household Income in Woodbury
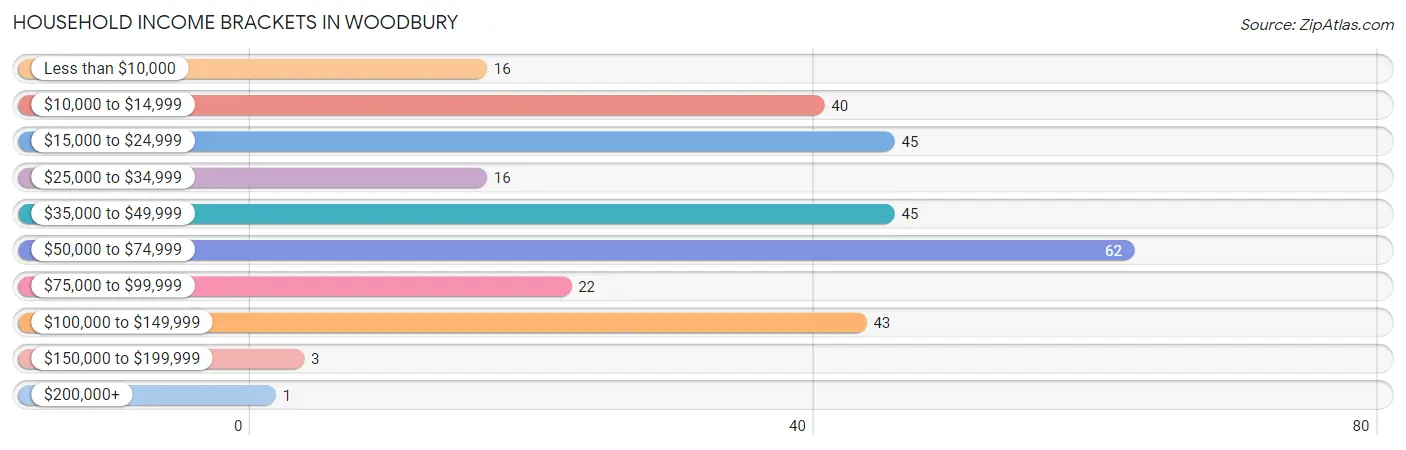
Household Income Brackets in Woodbury
With 62 households falling in the category, the $50,000 to $74,999 income range is the most frequent in Woodbury, accounting for 21.2% of all households. In contrast, only 1 households (0.3%) fall into the $200,000+ income bracket, making it the least populous group.
| Income Bracket | # Households | % Households |
| Less than $10,000 | 16 | 5.5% |
| $10,000 to $14,999 | 40 | 13.7% |
| $15,000 to $24,999 | 45 | 15.4% |
| $25,000 to $34,999 | 16 | 5.5% |
| $35,000 to $49,999 | 45 | 15.4% |
| $50,000 to $74,999 | 62 | 21.2% |
| $75,000 to $99,999 | 22 | 7.5% |
| $100,000 to $149,999 | 43 | 14.7% |
| $150,000 to $199,999 | 3 | 1.0% |
| $200,000+ | 1 | 0.3% |
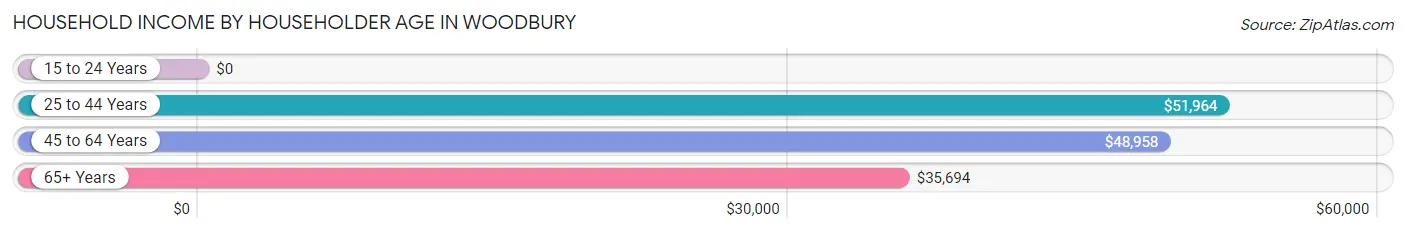
Household Income by Householder Age in Woodbury
The median household income in Woodbury is $47,292, with the highest median household income of $51,964 found in the 25 to 44 years age bracket for the primary householder. A total of 61 households (20.8%) fall into this category.
| Income Bracket | # Households | Median Income |
| 15 to 24 Years | 0 (0.0%) | $0 |
| 25 to 44 Years | 61 (20.8%) | $51,964 |
| 45 to 64 Years | 119 (40.6%) | $48,958 |
| 65+ Years | 113 (38.6%) | $35,694 |
| Total | 293 (100.0%) | $47,292 |
Poverty in Woodbury
Income Below Poverty by Sex and Age in Woodbury
With 23.4% poverty level for males and 38.0% for females among the residents of Woodbury, 15 year old males and 18 to 24 year old females are the most vulnerable to poverty, with 8 males (80.0%) and 33 females (100.0%) in their respective age groups living below the poverty level.
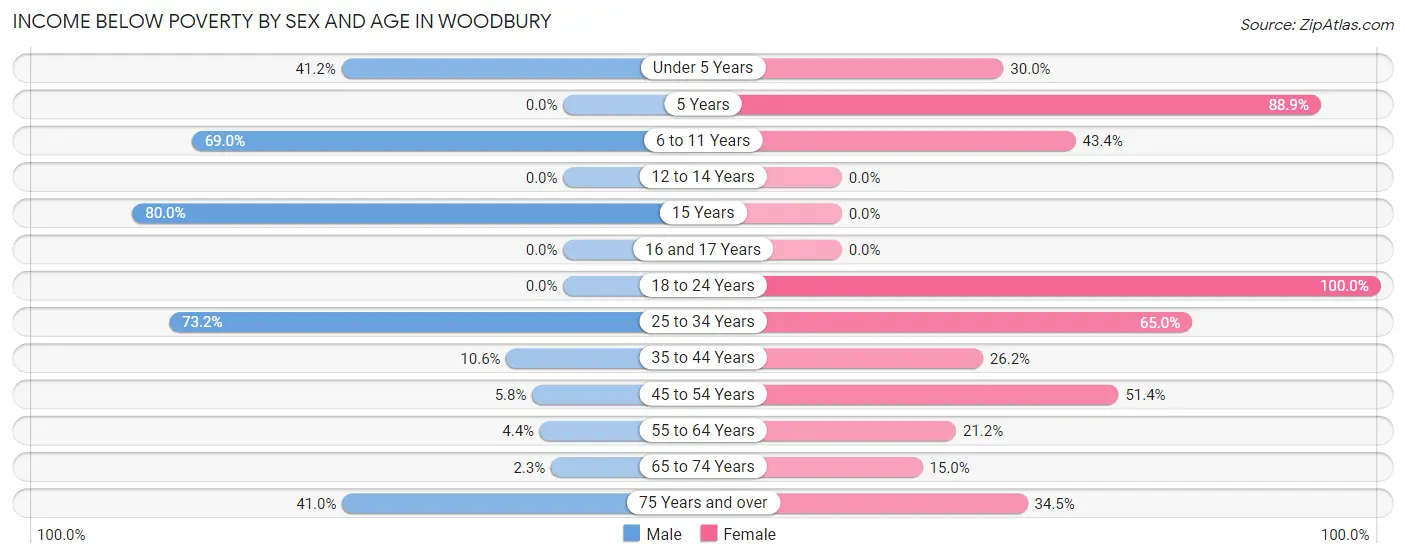
| Age Bracket | Male | Female |
| Under 5 Years | 7 (41.2%) | 6 (30.0%) |
| 5 Years | 0 (0.0%) | 8 (88.9%) |
| 6 to 11 Years | 20 (69.0%) | 23 (43.4%) |
| 12 to 14 Years | 0 (0.0%) | 0 (0.0%) |
| 15 Years | 8 (80.0%) | 0 (0.0%) |
| 16 and 17 Years | 0 (0.0%) | 0 (0.0%) |
| 18 to 24 Years | 0 (0.0%) | 33 (100.0%) |
| 25 to 34 Years | 30 (73.2%) | 13 (65.0%) |
| 35 to 44 Years | 13 (10.6%) | 22 (26.2%) |
| 45 to 54 Years | 3 (5.8%) | 38 (51.3%) |
| 55 to 64 Years | 2 (4.3%) | 7 (21.2%) |
| 65 to 74 Years | 1 (2.3%) | 9 (15.0%) |
| 75 Years and over | 16 (41.0%) | 10 (34.5%) |
| Total | 100 (23.4%) | 169 (38.0%) |
Income Above Poverty by Sex and Age in Woodbury
According to the poverty statistics in Woodbury, males aged 5 years and females aged 12 to 14 years are the age groups that are most secure financially, with 100.0% of males and 100.0% of females in these age groups living above the poverty line.
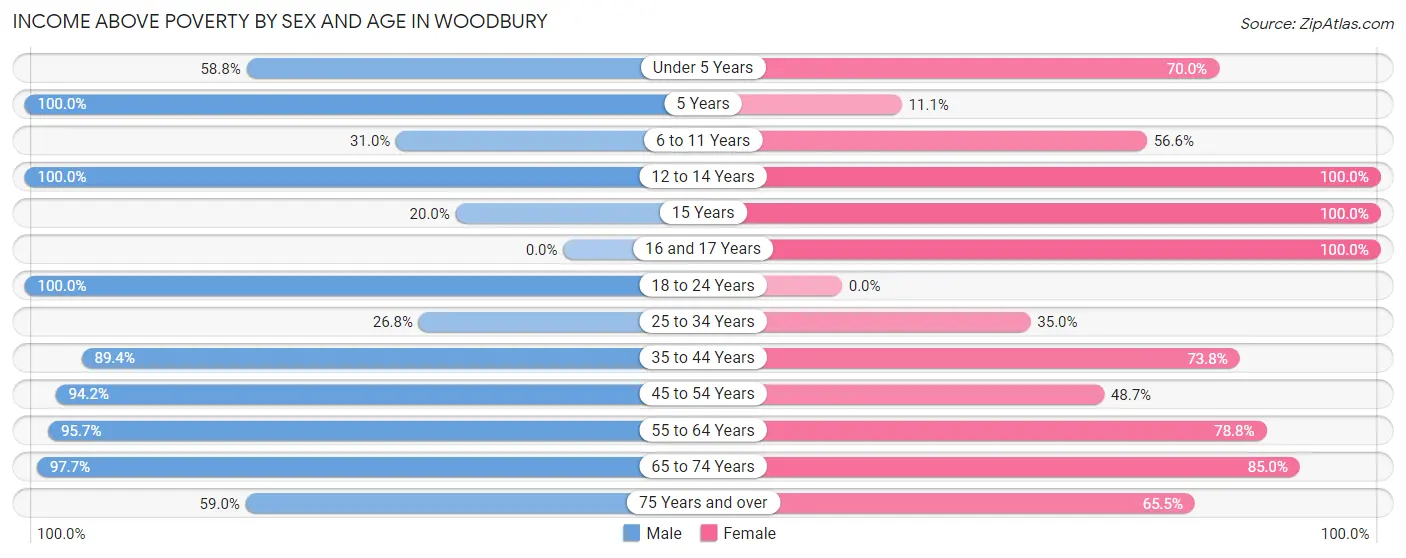
| Age Bracket | Male | Female |
| Under 5 Years | 10 (58.8%) | 14 (70.0%) |
| 5 Years | 9 (100.0%) | 1 (11.1%) |
| 6 to 11 Years | 9 (31.0%) | 30 (56.6%) |
| 12 to 14 Years | 8 (100.0%) | 3 (100.0%) |
| 15 Years | 2 (20.0%) | 2 (100.0%) |
| 16 and 17 Years | 0 (0.0%) | 25 (100.0%) |
| 18 to 24 Years | 9 (100.0%) | 0 (0.0%) |
| 25 to 34 Years | 11 (26.8%) | 7 (35.0%) |
| 35 to 44 Years | 110 (89.4%) | 62 (73.8%) |
| 45 to 54 Years | 49 (94.2%) | 36 (48.6%) |
| 55 to 64 Years | 44 (95.7%) | 26 (78.8%) |
| 65 to 74 Years | 43 (97.7%) | 51 (85.0%) |
| 75 Years and over | 23 (59.0%) | 19 (65.5%) |
| Total | 327 (76.6%) | 276 (62.0%) |
Income Below Poverty Among Married-Couple Families in Woodbury
The poverty statistics for married-couple families in Woodbury show that 13.2% or 15 of the total 114 families live below the poverty line. Families with 1 or 2 children have the highest poverty rate of 17.5%, comprising of 10 families. On the other hand, families with 3 or 4 children have the lowest poverty rate of 0.0%, which includes 0 families.
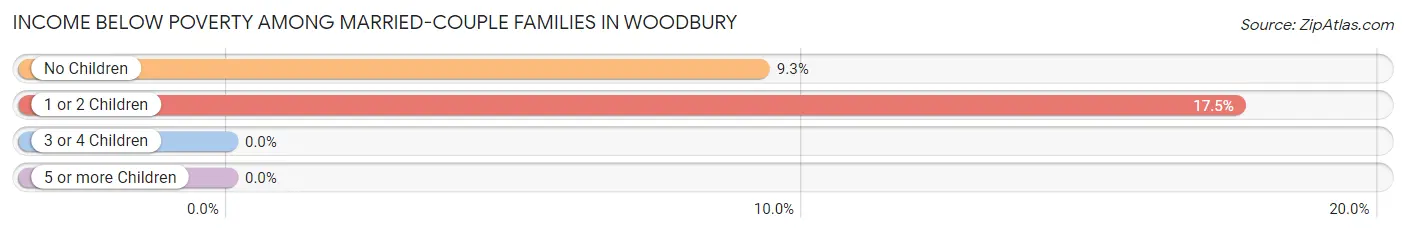
| Children | Above Poverty | Below Poverty |
| No Children | 49 (90.7%) | 5 (9.3%) |
| 1 or 2 Children | 47 (82.5%) | 10 (17.5%) |
| 3 or 4 Children | 3 (100.0%) | 0 (0.0%) |
| 5 or more Children | 0 (0.0%) | 0 (0.0%) |
| Total | 99 (86.8%) | 15 (13.2%) |
Income Below Poverty Among Single-Parent Households in Woodbury
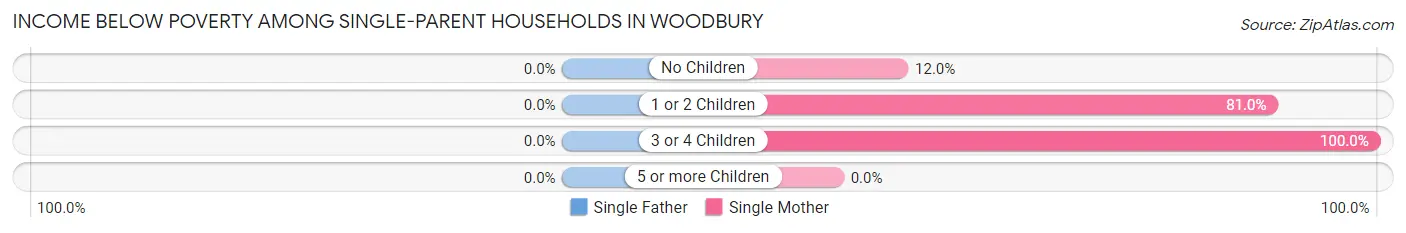
| Children | Single Father | Single Mother |
| No Children | 0 (0.0%) | 3 (12.0%) |
| 1 or 2 Children | 0 (0.0%) | 17 (80.9%) |
| 3 or 4 Children | 0 (0.0%) | 21 (100.0%) |
| 5 or more Children | 0 (0.0%) | 0 (0.0%) |
| Total | 0 (0.0%) | 41 (61.2%) |
Income Below Poverty Among Married-Couple vs Single-Parent Households in Woodbury
The poverty data for Woodbury shows that 15 of the married-couple family households (13.2%) and 41 of the single-parent households (50.0%) are living below the poverty level. Within the married-couple family households, those with 1 or 2 children have the highest poverty rate, with 10 households (17.5%) falling below the poverty line. Among the single-parent households, those with 3 or 4 children have the highest poverty rate, with 21 household (100.0%) living below poverty.
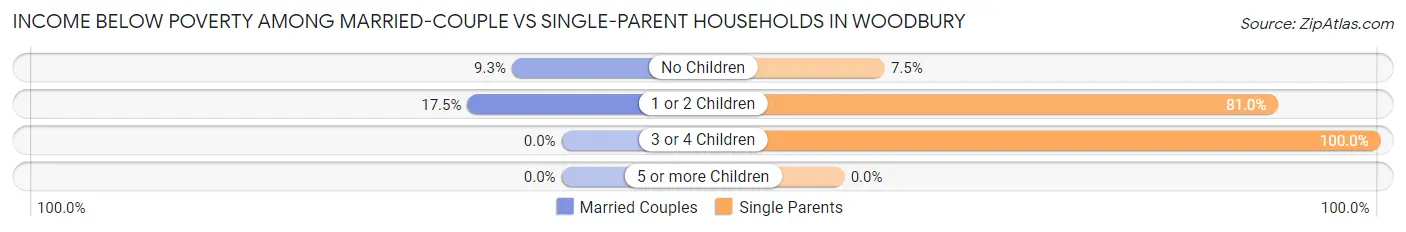
| Children | Married-Couple Families | Single-Parent Households |
| No Children | 5 (9.3%) | 3 (7.5%) |
| 1 or 2 Children | 10 (17.5%) | 17 (80.9%) |
| 3 or 4 Children | 0 (0.0%) | 21 (100.0%) |
| 5 or more Children | 0 (0.0%) | 0 (0.0%) |
| Total | 15 (13.2%) | 41 (50.0%) |
Race in Woodbury
The most populous races in Woodbury are Black / African American (532 | 61.0%), White / Caucasian (333 | 38.2%), and Two or more Races (7 | 0.8%).
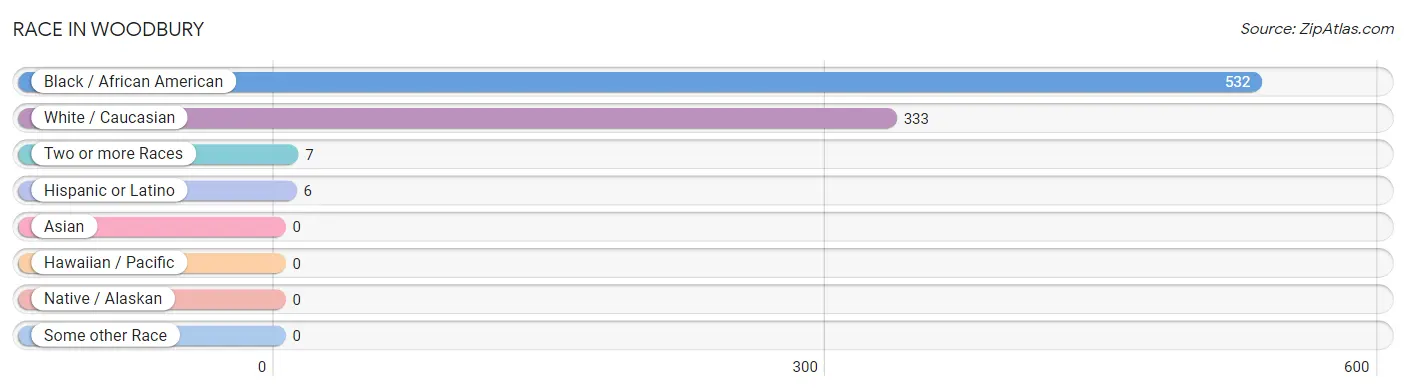
| Race | # Population | % Population |
| Asian | 0 | 0.0% |
| Black / African American | 532 | 61.0% |
| Hawaiian / Pacific | 0 | 0.0% |
| Hispanic or Latino | 6 | 0.7% |
| Native / Alaskan | 0 | 0.0% |
| White / Caucasian | 333 | 38.2% |
| Two or more Races | 7 | 0.8% |
| Some other Race | 0 | 0.0% |
| Total | 872 | 100.0% |
Ancestry in Woodbury
The most populous ancestries reported in Woodbury are Irish (66 | 7.6%), English (49 | 5.6%), German (30 | 3.4%), American (23 | 2.6%), and Italian (12 | 1.4%), together accounting for 20.7% of all Woodbury residents.
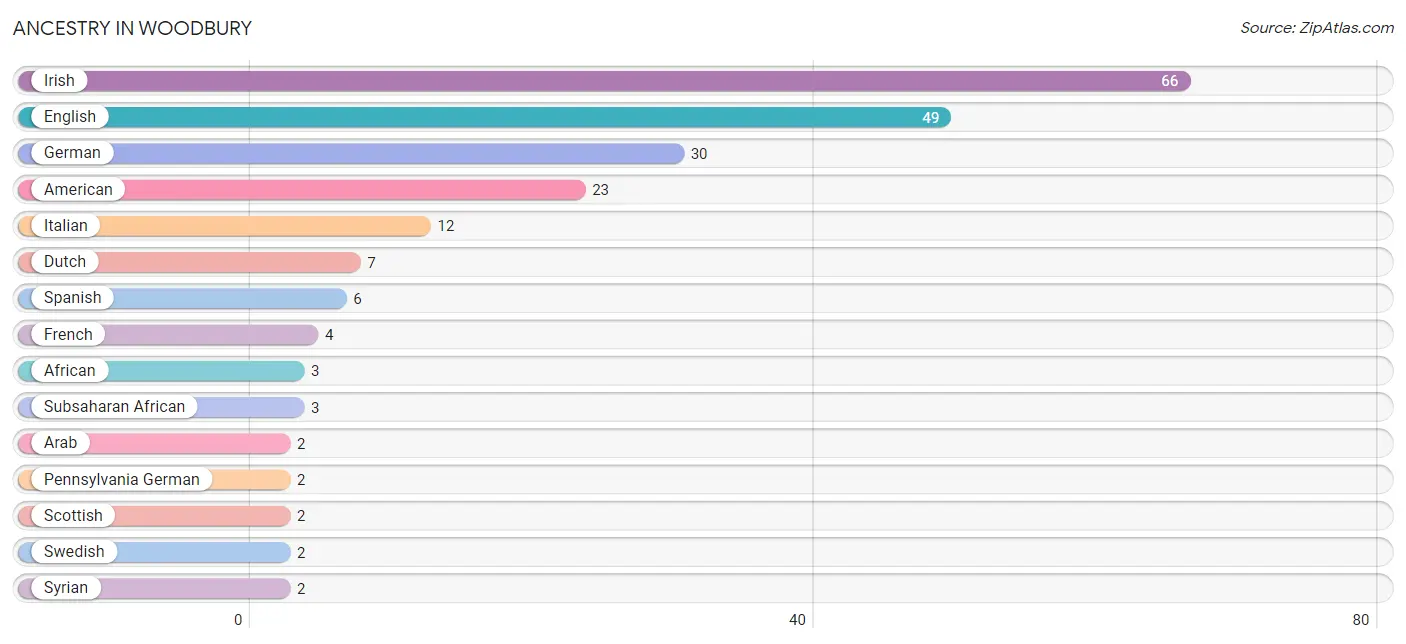
| Ancestry | # Population | % Population |
| African | 3 | 0.3% |
| American | 23 | 2.6% |
| Arab | 2 | 0.2% |
| Dutch | 7 | 0.8% |
| English | 49 | 5.6% |
| French | 4 | 0.5% |
| German | 30 | 3.4% |
| Irish | 66 | 7.6% |
| Italian | 12 | 1.4% |
| Pennsylvania German | 2 | 0.2% |
| Scottish | 2 | 0.2% |
| Spanish | 6 | 0.7% |
| Subsaharan African | 3 | 0.3% |
| Swedish | 2 | 0.2% |
| Syrian | 2 | 0.2% | View All 15 Rows |
Immigrants in Woodbury

| Immigration Origin | # Population | % Population | View All 0 Rows |
Sex and Age in Woodbury
Sex and Age in Woodbury
The most populous age groups in Woodbury are 35 to 39 Years (77 | 18.0%) for men and 40 to 44 Years (50 | 11.2%) for women.
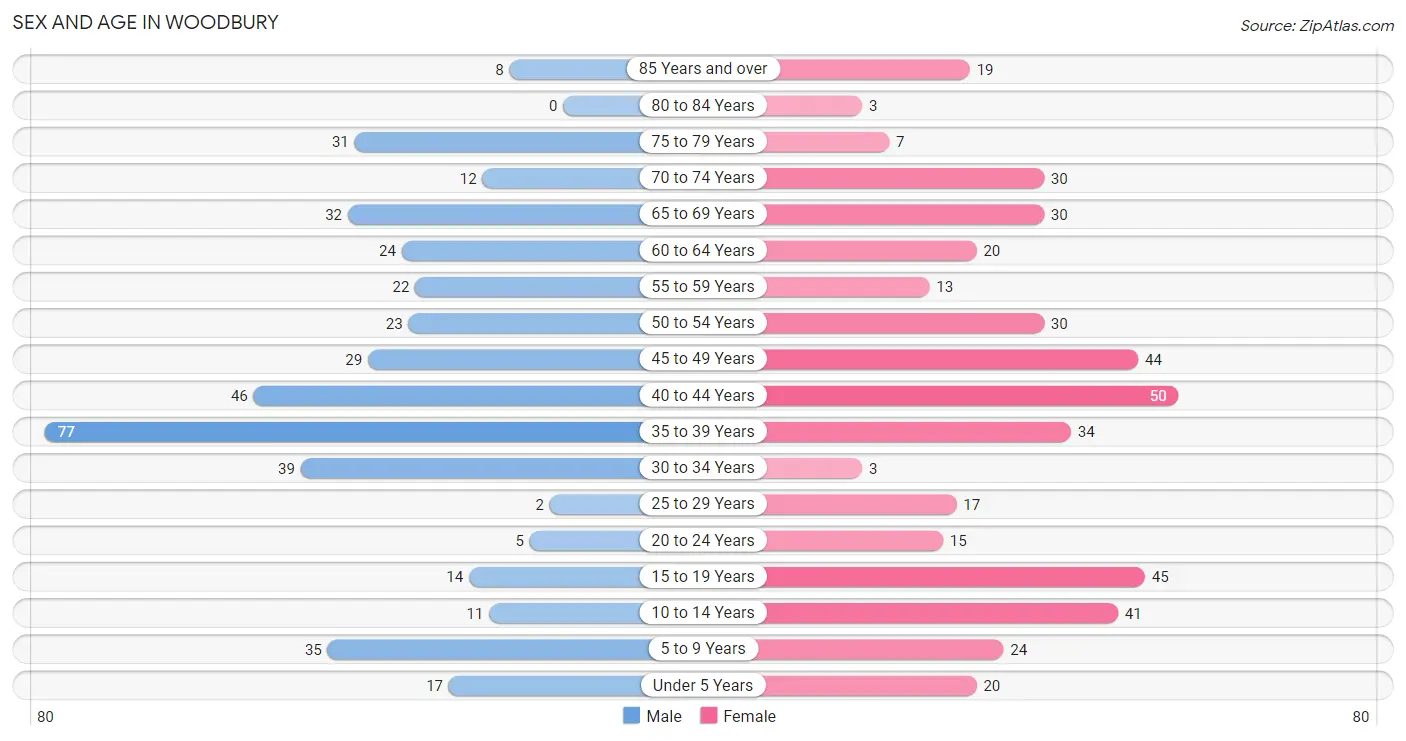
| Age Bracket | Male | Female |
| Under 5 Years | 17 (4.0%) | 20 (4.5%) |
| 5 to 9 Years | 35 (8.2%) | 24 (5.4%) |
| 10 to 14 Years | 11 (2.6%) | 41 (9.2%) |
| 15 to 19 Years | 14 (3.3%) | 45 (10.1%) |
| 20 to 24 Years | 5 (1.2%) | 15 (3.4%) |
| 25 to 29 Years | 2 (0.5%) | 17 (3.8%) |
| 30 to 34 Years | 39 (9.1%) | 3 (0.7%) |
| 35 to 39 Years | 77 (18.0%) | 34 (7.6%) |
| 40 to 44 Years | 46 (10.8%) | 50 (11.2%) |
| 45 to 49 Years | 29 (6.8%) | 44 (9.9%) |
| 50 to 54 Years | 23 (5.4%) | 30 (6.7%) |
| 55 to 59 Years | 22 (5.1%) | 13 (2.9%) |
| 60 to 64 Years | 24 (5.6%) | 20 (4.5%) |
| 65 to 69 Years | 32 (7.5%) | 30 (6.7%) |
| 70 to 74 Years | 12 (2.8%) | 30 (6.7%) |
| 75 to 79 Years | 31 (7.3%) | 7 (1.6%) |
| 80 to 84 Years | 0 (0.0%) | 3 (0.7%) |
| 85 Years and over | 8 (1.9%) | 19 (4.3%) |
| Total | 427 (100.0%) | 445 (100.0%) |
Families and Households in Woodbury
Median Family Size in Woodbury
The median family size in Woodbury is 3.77 persons per family, with single female/mother families (67 | 34.2%) accounting for the largest median family size of 5.16 persons per family. On the other hand, single male/father families (15 | 7.6%) represent the smallest median family size with 2.20 persons per family.
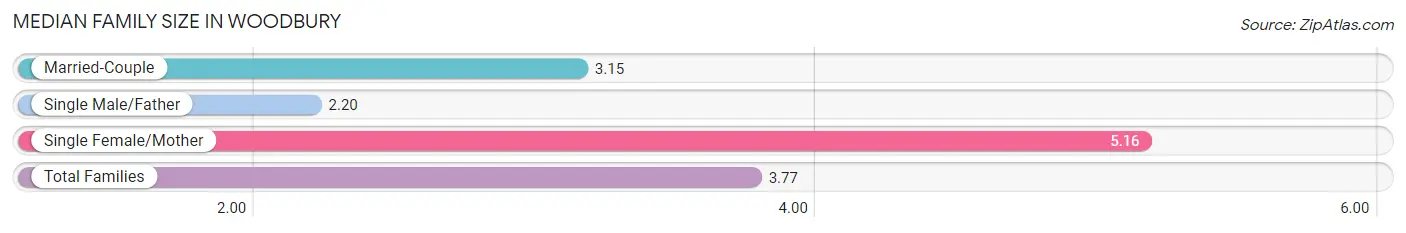
| Family Type | # Families | Family Size |
| Married-Couple | 114 (58.2%) | 3.15 |
| Single Male/Father | 15 (7.6%) | 2.20 |
| Single Female/Mother | 67 (34.2%) | 5.16 |
| Total Families | 196 (100.0%) | 3.77 |
Median Household Size in Woodbury
The median household size in Woodbury is 2.98 persons per household, with single female/mother households (67 | 22.9%) accounting for the largest median household size of 5.16 persons per household. non-family households (97 | 33.1%) represent the smallest median household size with 1.32 persons per household.
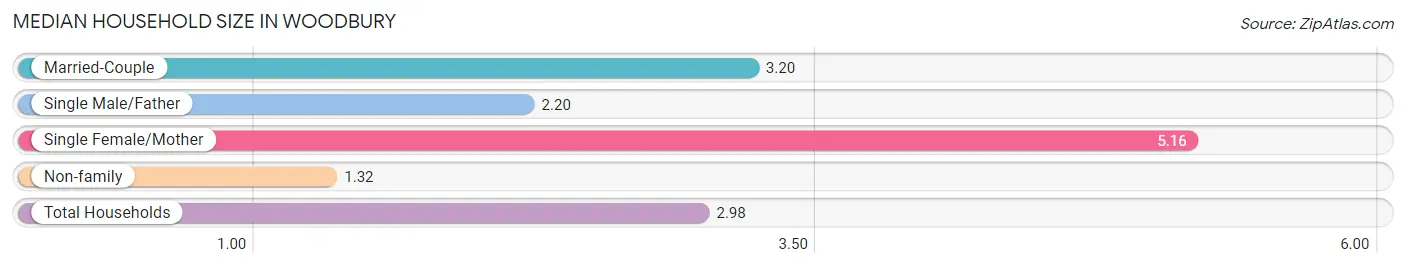
| Household Type | # Households | Household Size |
| Married-Couple | 114 (38.9%) | 3.20 |
| Single Male/Father | 15 (5.1%) | 2.20 |
| Single Female/Mother | 67 (22.9%) | 5.16 |
| Non-family | 97 (33.1%) | 1.32 |
| Total Households | 293 (100.0%) | 2.98 |
Household Size by Marriage Status in Woodbury
Out of a total of 293 households in Woodbury, 196 (66.9%) are family households, while 97 (33.1%) are nonfamily households. The most numerous type of family households are 4-person households, comprising 71, and the most common type of nonfamily households are 1-person households, comprising 72.
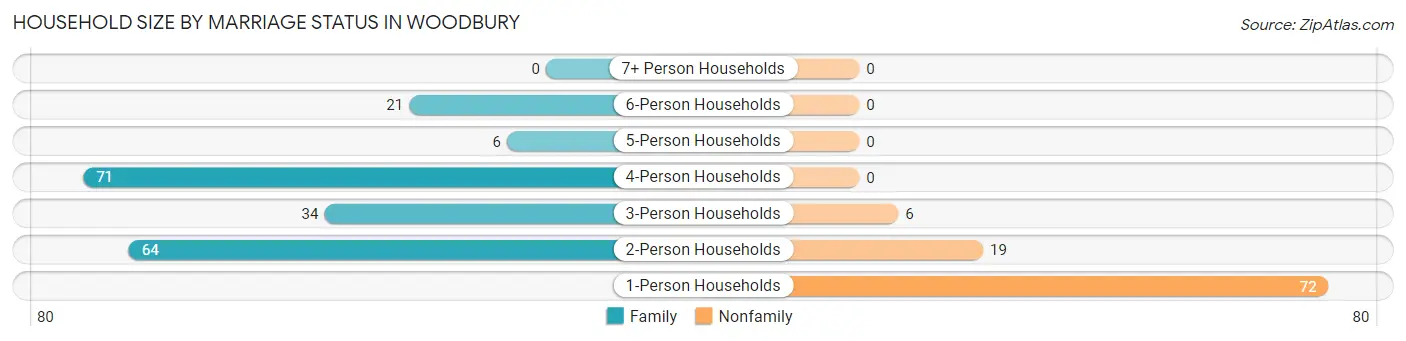
| Household Size | Family Households | Nonfamily Households |
| 1-Person Households | - | 72 (24.6%) |
| 2-Person Households | 64 (21.8%) | 19 (6.5%) |
| 3-Person Households | 34 (11.6%) | 6 (2.1%) |
| 4-Person Households | 71 (24.2%) | 0 (0.0%) |
| 5-Person Households | 6 (2.1%) | 0 (0.0%) |
| 6-Person Households | 21 (7.2%) | 0 (0.0%) |
| 7+ Person Households | 0 (0.0%) | 0 (0.0%) |
| Total | 196 (66.9%) | 97 (33.1%) |
Female Fertility in Woodbury
Fertility by Age in Woodbury
Average fertility rate in Woodbury is 32.0 births per 1,000 women. Women in the age bracket of 35 to 50 years have the highest fertility rate with 50.0 births per 1,000 women. Women in the age bracket of 35 to 50 years acount for 100.0% of all women with births.
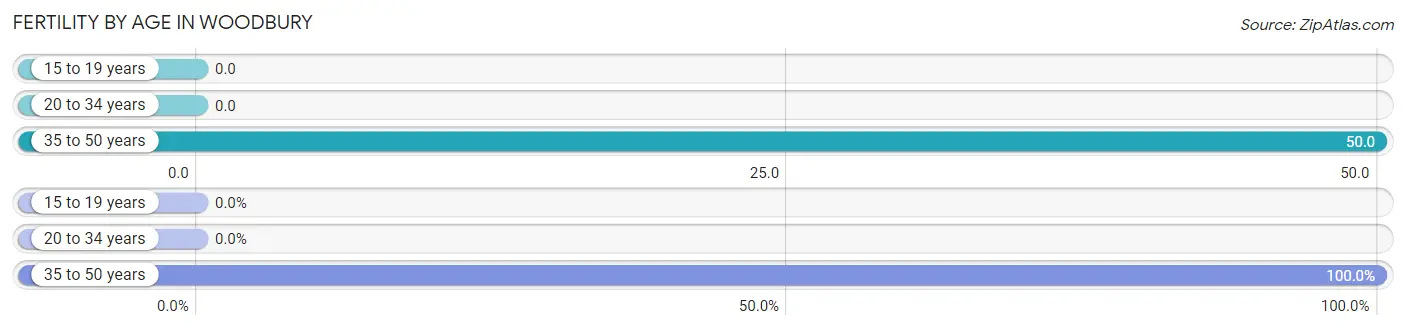
| Age Bracket | Women with Births | Births / 1,000 Women |
| 15 to 19 years | 0 (0.0%) | 0.0 |
| 20 to 34 years | 0 (0.0%) | 0.0 |
| 35 to 50 years | 7 (100.0%) | 50.0 |
| Total | 7 (100.0%) | 32.0 |
Fertility by Age by Marriage Status in Woodbury
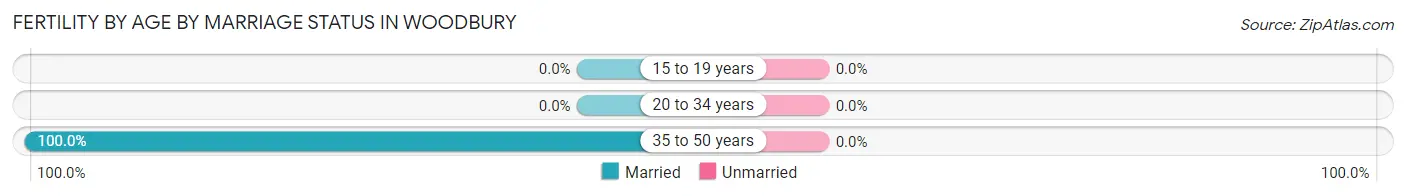
| Age Bracket | Married | Unmarried |
| 15 to 19 years | 0 (0.0%) | 0 (0.0%) |
| 20 to 34 years | 0 (0.0%) | 0 (0.0%) |
| 35 to 50 years | 7 (100.0%) | 0 (0.0%) |
| Total | 7 (100.0%) | 0 (0.0%) |
Fertility by Education in Woodbury
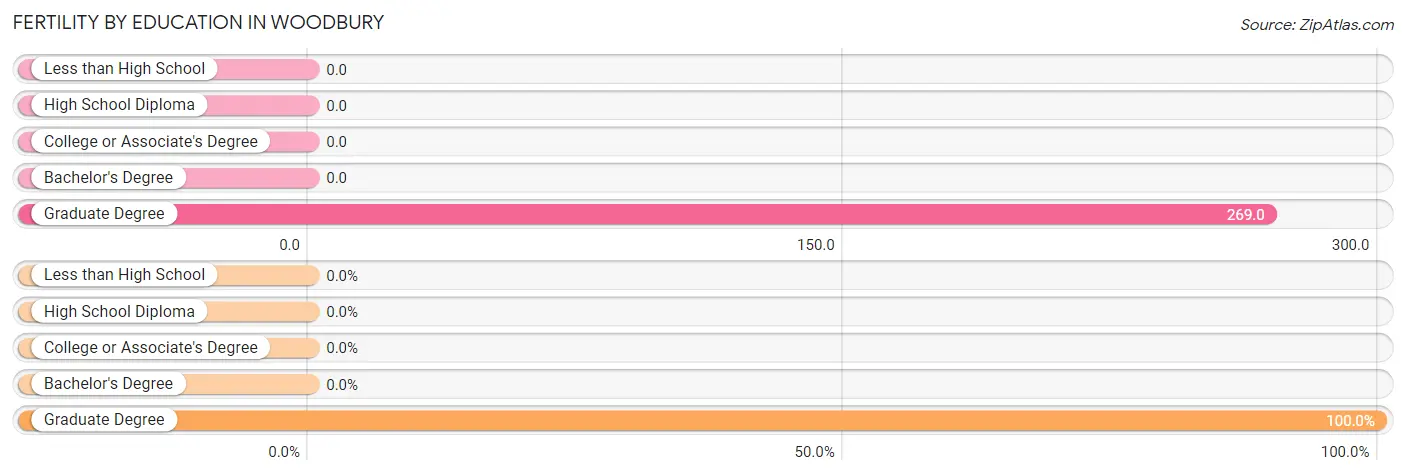
| Educational Attainment | Women with Births | Births / 1,000 Women |
| Less than High School | 0 (0.0%) | 0.0 |
| High School Diploma | 0 (0.0%) | 0.0 |
| College or Associate's Degree | 0 (0.0%) | 0.0 |
| Bachelor's Degree | 0 (0.0%) | 0.0 |
| Graduate Degree | 7 (100.0%) | 269.0 |
| Total | 7 (100.0%) | 32.0 |
Fertility by Education by Marriage Status in Woodbury
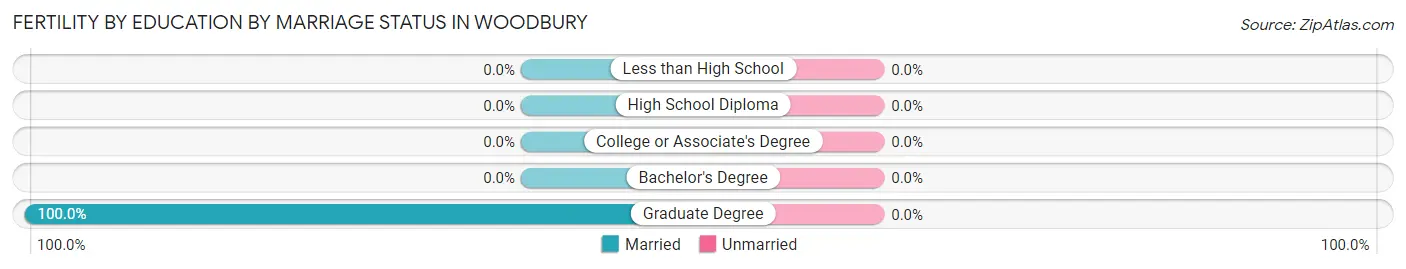
| Educational Attainment | Married | Unmarried |
| Less than High School | 0 (0.0%) | 0 (0.0%) |
| High School Diploma | 0 (0.0%) | 0 (0.0%) |
| College or Associate's Degree | 0 (0.0%) | 0 (0.0%) |
| Bachelor's Degree | 0 (0.0%) | 0 (0.0%) |
| Graduate Degree | 7 (100.0%) | 0 (0.0%) |
| Total | 7 (100.0%) | 0 (0.0%) |
Employment Characteristics in Woodbury
Employment by Class of Employer in Woodbury
Among the 374 employed individuals in Woodbury, private company employees (303 | 81.0%), local government employees (32 | 8.6%), and state government employees (20 | 5.3%) make up the most common classes of employment.
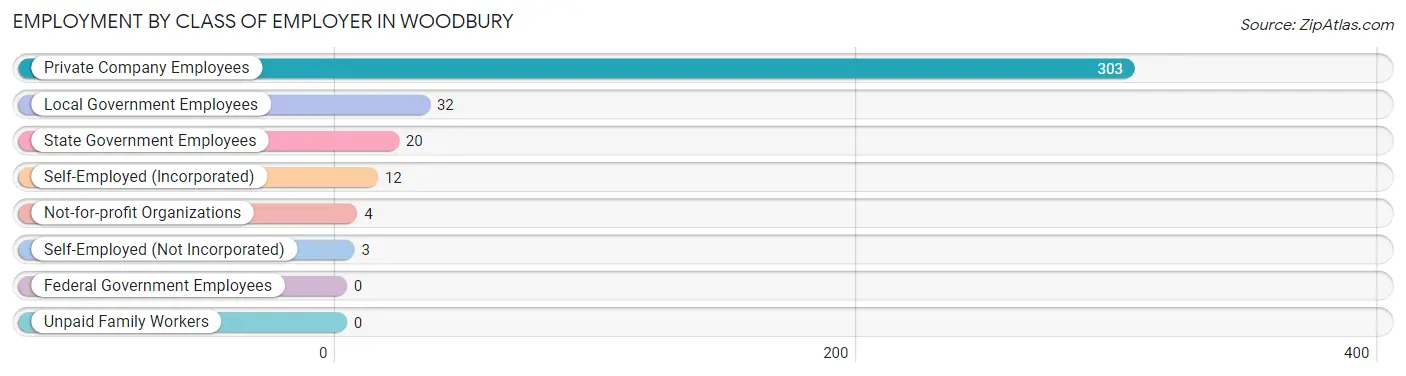
| Employer Class | # Employees | % Employees |
| Private Company Employees | 303 | 81.0% |
| Self-Employed (Incorporated) | 12 | 3.2% |
| Self-Employed (Not Incorporated) | 3 | 0.8% |
| Not-for-profit Organizations | 4 | 1.1% |
| Local Government Employees | 32 | 8.6% |
| State Government Employees | 20 | 5.3% |
| Federal Government Employees | 0 | 0.0% |
| Unpaid Family Workers | 0 | 0.0% |
| Total | 374 | 100.0% |
Employment Status by Age in Woodbury
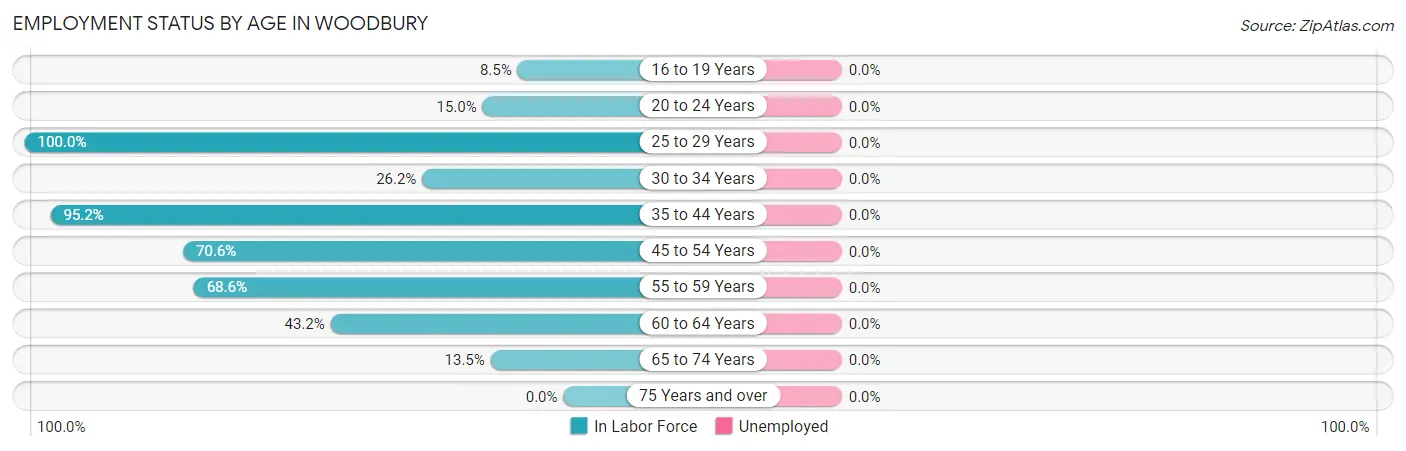
| Age Bracket | In Labor Force | Unemployed |
| 16 to 19 Years | 4 (8.5%) | 0 (0.0%) |
| 20 to 24 Years | 3 (15.0%) | 0 (0.0%) |
| 25 to 29 Years | 19 (100.0%) | 0 (0.0%) |
| 30 to 34 Years | 11 (26.2%) | 0 (0.0%) |
| 35 to 44 Years | 197 (95.2%) | 0 (0.0%) |
| 45 to 54 Years | 89 (70.6%) | 0 (0.0%) |
| 55 to 59 Years | 24 (68.6%) | 0 (0.0%) |
| 60 to 64 Years | 19 (43.2%) | 0 (0.0%) |
| 65 to 74 Years | 14 (13.5%) | 0 (0.0%) |
| 75 Years and over | 0 (0.0%) | 0 (0.0%) |
| Total | 380 (53.4%) | 0 (0.0%) |
Employment Status by Educational Attainment in Woodbury
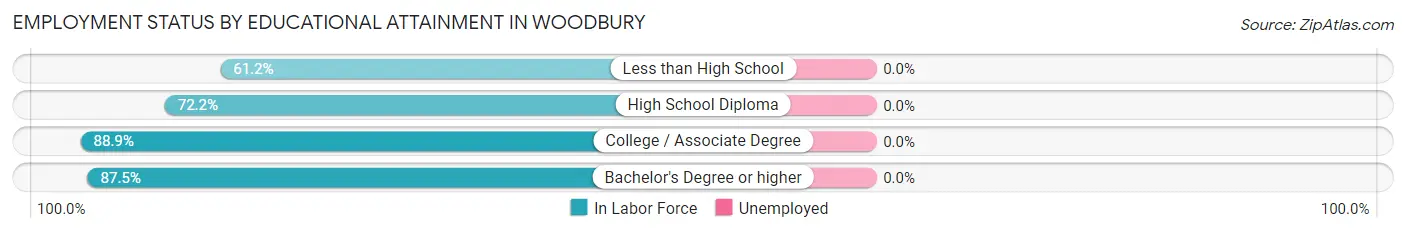
| Educational Attainment | In Labor Force | Unemployed |
| Less than High School | 52 (61.2%) | 0 (0.0%) |
| High School Diploma | 161 (72.2%) | 0 (0.0%) |
| College / Associate Degree | 104 (88.9%) | 0 (0.0%) |
| Bachelor's Degree or higher | 42 (87.5%) | 0 (0.0%) |
| Total | 359 (75.9%) | 0 (0.0%) |
Employment Occupations by Sex in Woodbury
Management, Business, Science and Arts Occupations
The most common Management, Business, Science and Arts occupations in Woodbury are Health Diagnosing & Treating (42 | 11.1%), Management (32 | 8.4%), Community & Social Service (29 | 7.6%), Education Instruction & Library (29 | 7.6%), and Computers, Engineering & Science (7 | 1.8%).
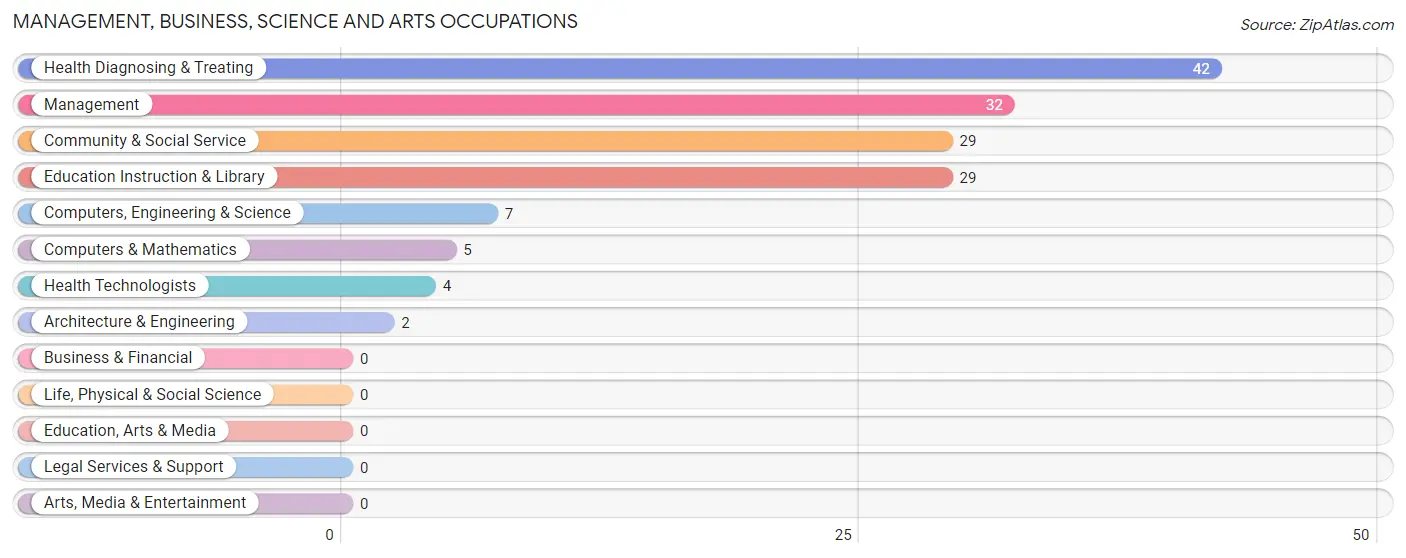
Management, Business, Science and Arts Occupations by Sex
Within the Management, Business, Science and Arts occupations in Woodbury, the most male-oriented occupations are Management (81.2%), Computers & Mathematics (60.0%), and Health Diagnosing & Treating (50.0%), while the most female-oriented occupations are Architecture & Engineering (100.0%), Community & Social Service (100.0%), and Education Instruction & Library (100.0%).
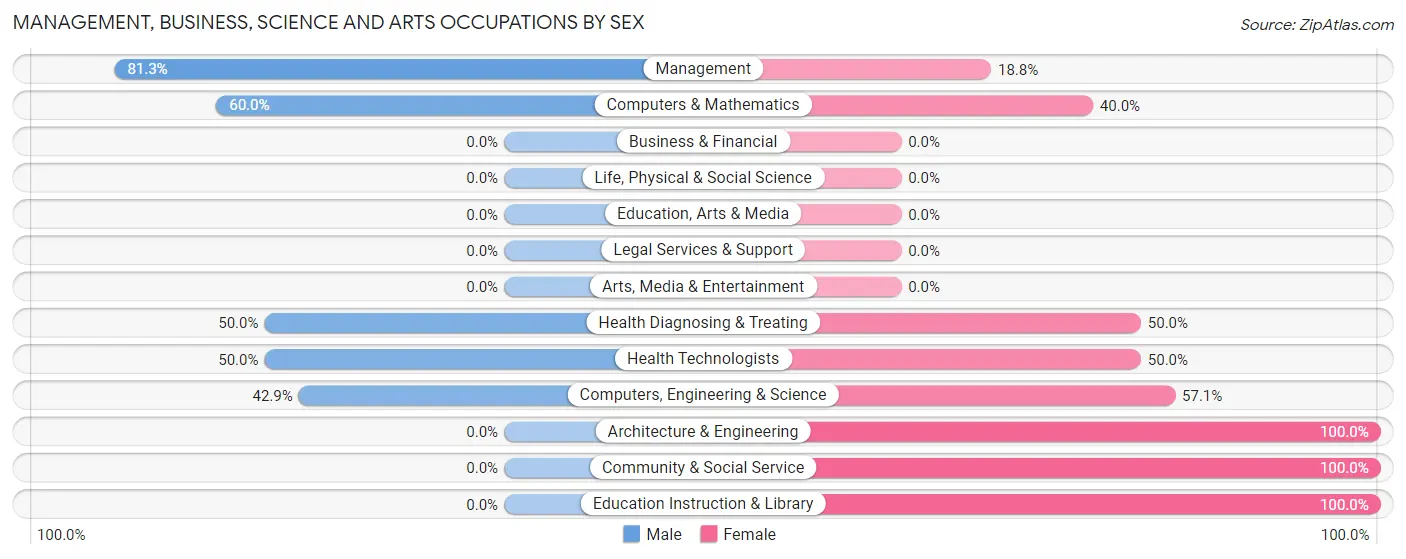
| Occupation | Male | Female |
| Management | 26 (81.2%) | 6 (18.8%) |
| Business & Financial | 0 (0.0%) | 0 (0.0%) |
| Computers, Engineering & Science | 3 (42.9%) | 4 (57.1%) |
| Computers & Mathematics | 3 (60.0%) | 2 (40.0%) |
| Architecture & Engineering | 0 (0.0%) | 2 (100.0%) |
| Life, Physical & Social Science | 0 (0.0%) | 0 (0.0%) |
| Community & Social Service | 0 (0.0%) | 29 (100.0%) |
| Education, Arts & Media | 0 (0.0%) | 0 (0.0%) |
| Legal Services & Support | 0 (0.0%) | 0 (0.0%) |
| Education Instruction & Library | 0 (0.0%) | 29 (100.0%) |
| Arts, Media & Entertainment | 0 (0.0%) | 0 (0.0%) |
| Health Diagnosing & Treating | 21 (50.0%) | 21 (50.0%) |
| Health Technologists | 2 (50.0%) | 2 (50.0%) |
| Total (Category) | 50 (45.5%) | 60 (54.5%) |
| Total (Overall) | 218 (57.4%) | 162 (42.6%) |
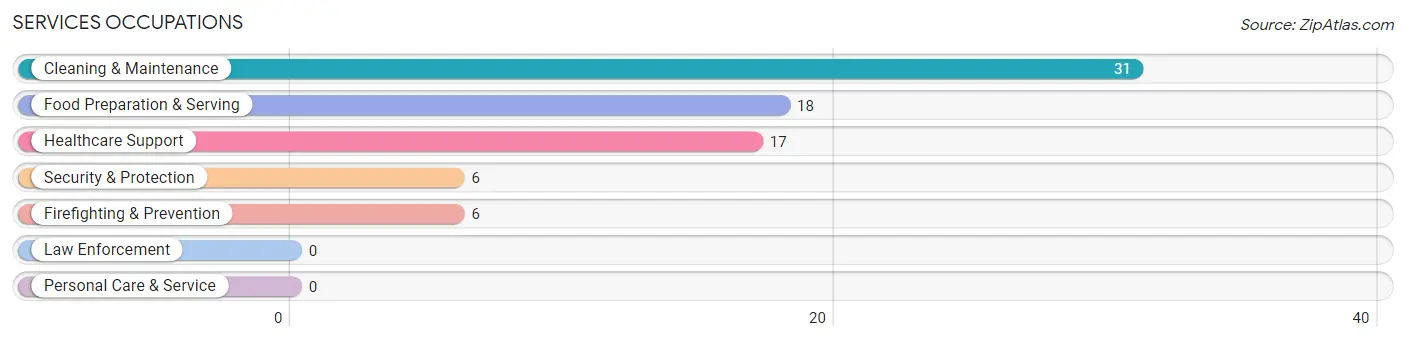
Services Occupations
The most common Services occupations in Woodbury are Cleaning & Maintenance (31 | 8.2%), Food Preparation & Serving (18 | 4.7%), Healthcare Support (17 | 4.5%), Security & Protection (6 | 1.6%), and Firefighting & Prevention (6 | 1.6%).
Services Occupations by Sex
Within the Services occupations in Woodbury, the most male-oriented occupations are Security & Protection (50.0%), Firefighting & Prevention (50.0%), and Cleaning & Maintenance (45.2%), while the most female-oriented occupations are Healthcare Support (100.0%), Food Preparation & Serving (88.9%), and Cleaning & Maintenance (54.8%).
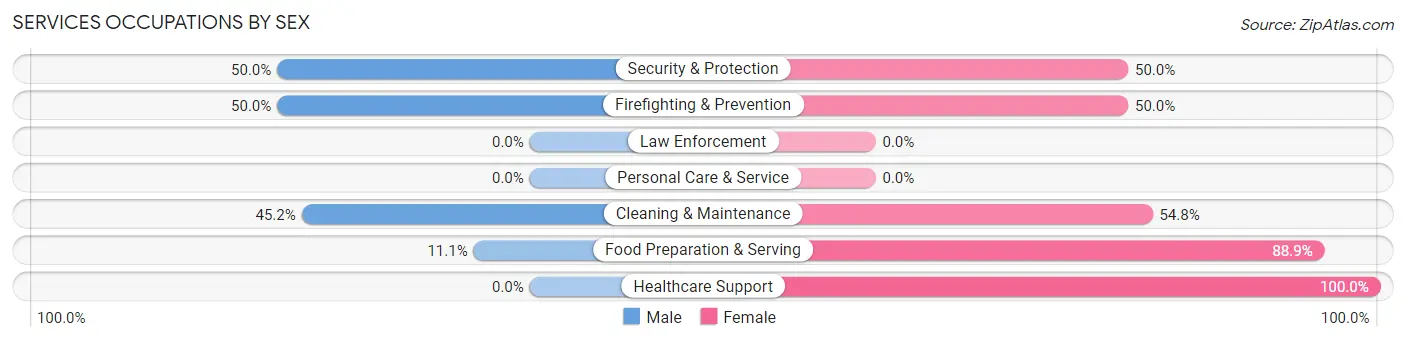
| Occupation | Male | Female |
| Healthcare Support | 0 (0.0%) | 17 (100.0%) |
| Security & Protection | 3 (50.0%) | 3 (50.0%) |
| Firefighting & Prevention | 3 (50.0%) | 3 (50.0%) |
| Law Enforcement | 0 (0.0%) | 0 (0.0%) |
| Food Preparation & Serving | 2 (11.1%) | 16 (88.9%) |
| Cleaning & Maintenance | 14 (45.2%) | 17 (54.8%) |
| Personal Care & Service | 0 (0.0%) | 0 (0.0%) |
| Total (Category) | 19 (26.4%) | 53 (73.6%) |
| Total (Overall) | 218 (57.4%) | 162 (42.6%) |
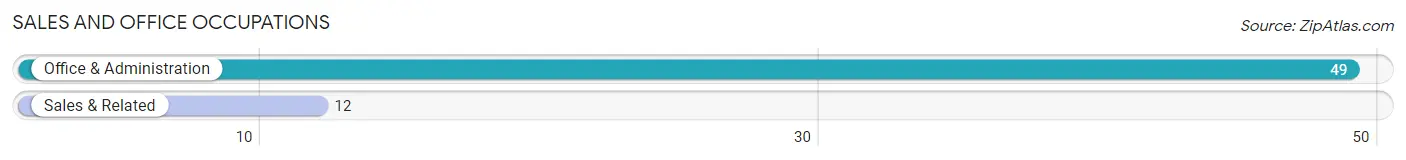
Sales and Office Occupations
The most common Sales and Office occupations in Woodbury are Office & Administration (49 | 12.9%), and Sales & Related (12 | 3.2%).
Sales and Office Occupations by Sex
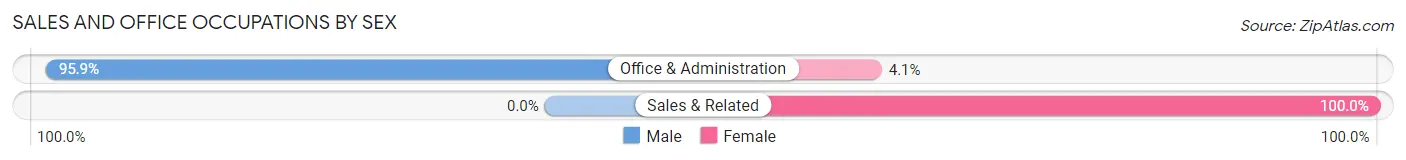
| Occupation | Male | Female |
| Sales & Related | 0 (0.0%) | 12 (100.0%) |
| Office & Administration | 47 (95.9%) | 2 (4.1%) |
| Total (Category) | 47 (77.0%) | 14 (23.0%) |
| Total (Overall) | 218 (57.4%) | 162 (42.6%) |
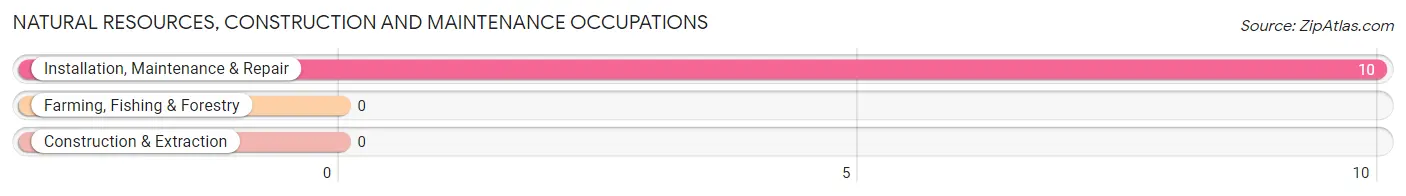
Natural Resources, Construction and Maintenance Occupations
The most common Natural Resources, Construction and Maintenance occupations in Woodbury are , and Installation, Maintenance & Repair (10 | 2.6%).
Natural Resources, Construction and Maintenance Occupations by Sex
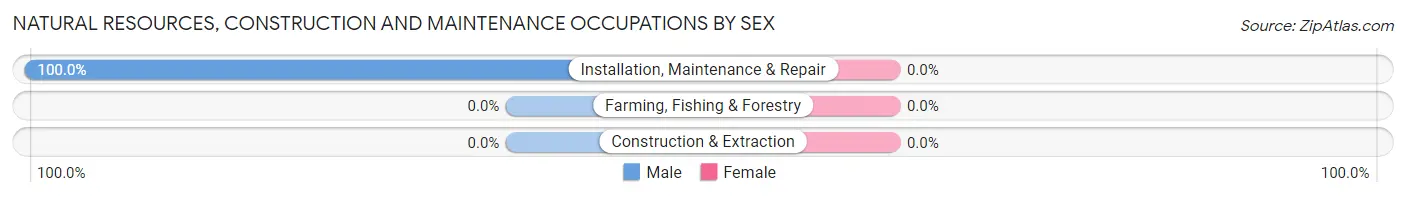
| Occupation | Male | Female |
| Farming, Fishing & Forestry | 0 (0.0%) | 0 (0.0%) |
| Construction & Extraction | 0 (0.0%) | 0 (0.0%) |
| Installation, Maintenance & Repair | 10 (100.0%) | 0 (0.0%) |
| Total (Category) | 10 (100.0%) | 0 (0.0%) |
| Total (Overall) | 218 (57.4%) | 162 (42.6%) |
Production, Transportation and Moving Occupations
The most common Production, Transportation and Moving occupations in Woodbury are Production (67 | 17.6%), Transportation (51 | 13.4%), and Material Moving (9 | 2.4%).
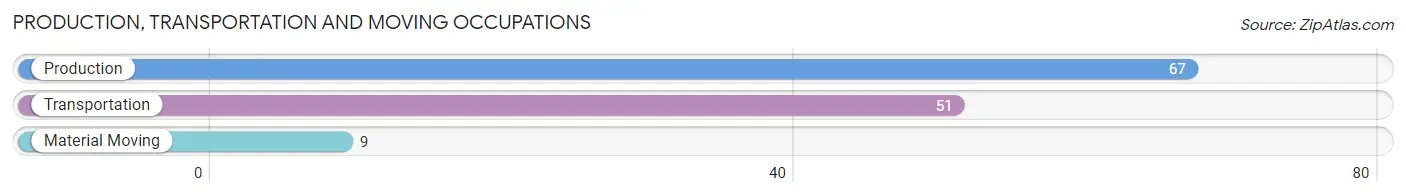
Production, Transportation and Moving Occupations by Sex
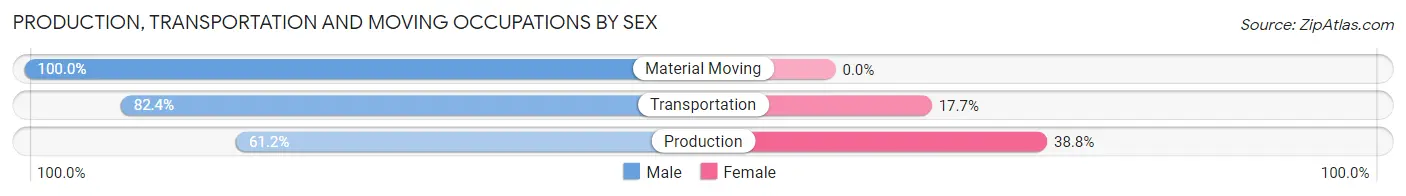
| Occupation | Male | Female |
| Production | 41 (61.2%) | 26 (38.8%) |
| Transportation | 42 (82.4%) | 9 (17.6%) |
| Material Moving | 9 (100.0%) | 0 (0.0%) |
| Total (Category) | 92 (72.4%) | 35 (27.6%) |
| Total (Overall) | 218 (57.4%) | 162 (42.6%) |
Employment Industries by Sex in Woodbury
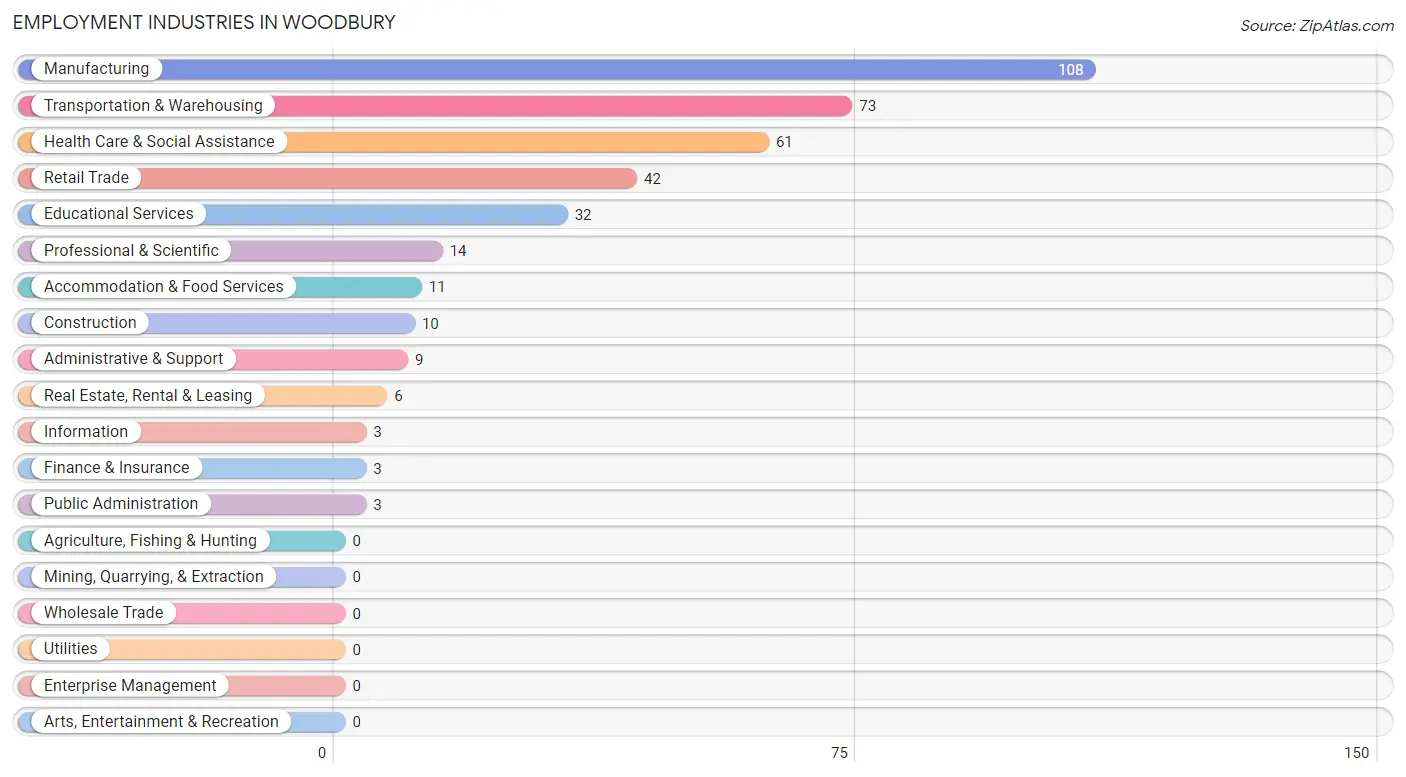
Employment Industries in Woodbury
The major employment industries in Woodbury include Manufacturing (108 | 28.4%), Transportation & Warehousing (73 | 19.2%), Health Care & Social Assistance (61 | 16.1%), Retail Trade (42 | 11.1%), and Educational Services (32 | 8.4%).
Employment Industries by Sex in Woodbury
The Woodbury industries that see more men than women are Construction (100.0%), Information (100.0%), and Administrative & Support (100.0%), whereas the industries that tend to have a higher number of women are Finance & Insurance (100.0%), Real Estate, Rental & Leasing (100.0%), and Educational Services (100.0%).
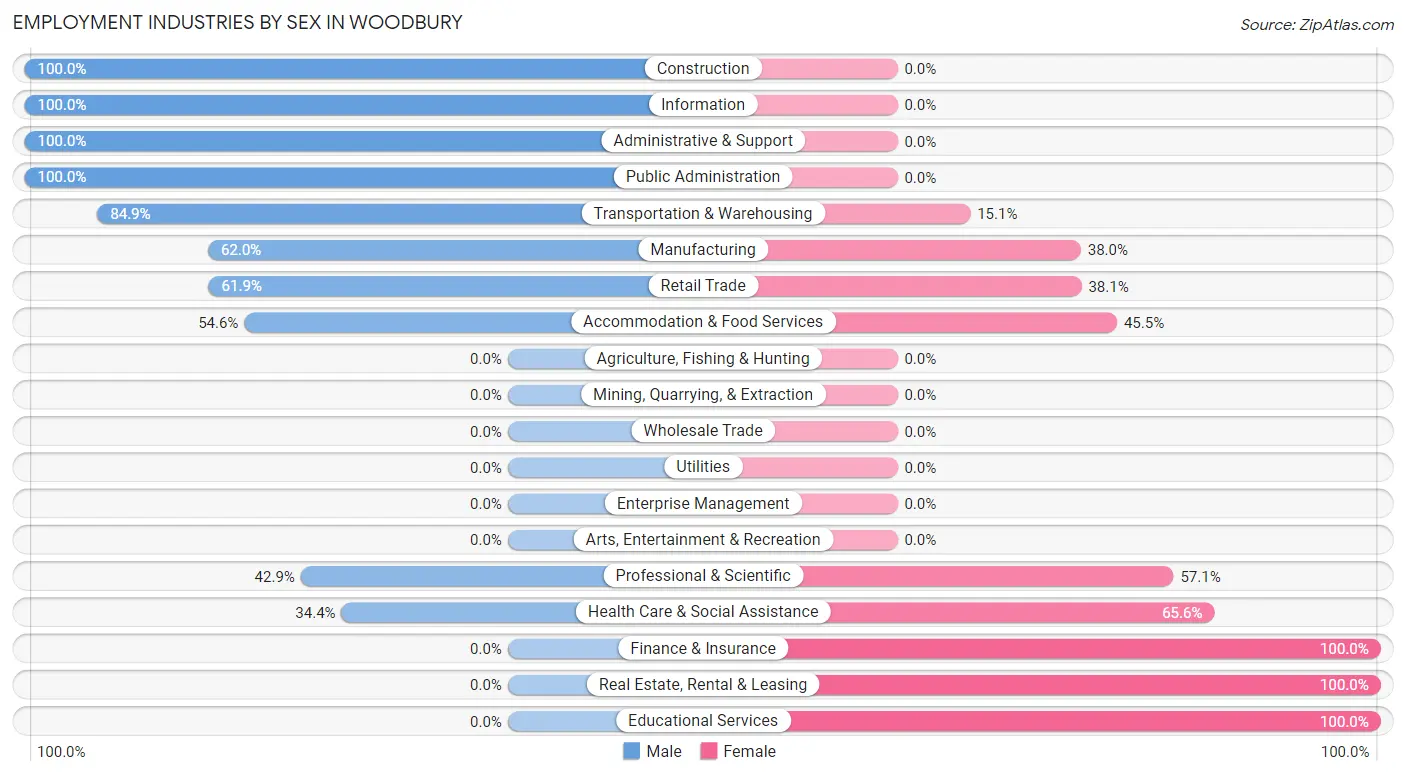
| Industry | Male | Female |
| Agriculture, Fishing & Hunting | 0 (0.0%) | 0 (0.0%) |
| Mining, Quarrying, & Extraction | 0 (0.0%) | 0 (0.0%) |
| Construction | 10 (100.0%) | 0 (0.0%) |
| Manufacturing | 67 (62.0%) | 41 (38.0%) |
| Wholesale Trade | 0 (0.0%) | 0 (0.0%) |
| Retail Trade | 26 (61.9%) | 16 (38.1%) |
| Transportation & Warehousing | 62 (84.9%) | 11 (15.1%) |
| Utilities | 0 (0.0%) | 0 (0.0%) |
| Information | 3 (100.0%) | 0 (0.0%) |
| Finance & Insurance | 0 (0.0%) | 3 (100.0%) |
| Real Estate, Rental & Leasing | 0 (0.0%) | 6 (100.0%) |
| Professional & Scientific | 6 (42.9%) | 8 (57.1%) |
| Enterprise Management | 0 (0.0%) | 0 (0.0%) |
| Administrative & Support | 9 (100.0%) | 0 (0.0%) |
| Educational Services | 0 (0.0%) | 32 (100.0%) |
| Health Care & Social Assistance | 21 (34.4%) | 40 (65.6%) |
| Arts, Entertainment & Recreation | 0 (0.0%) | 0 (0.0%) |
| Accommodation & Food Services | 6 (54.5%) | 5 (45.5%) |
| Public Administration | 3 (100.0%) | 0 (0.0%) |
| Total | 218 (57.4%) | 162 (42.6%) |
Education in Woodbury
School Enrollment in Woodbury
The most common levels of schooling among the 173 students in Woodbury are high school (48 | 27.8%), middle school (41 | 23.7%), and elementary school (33 | 19.1%).
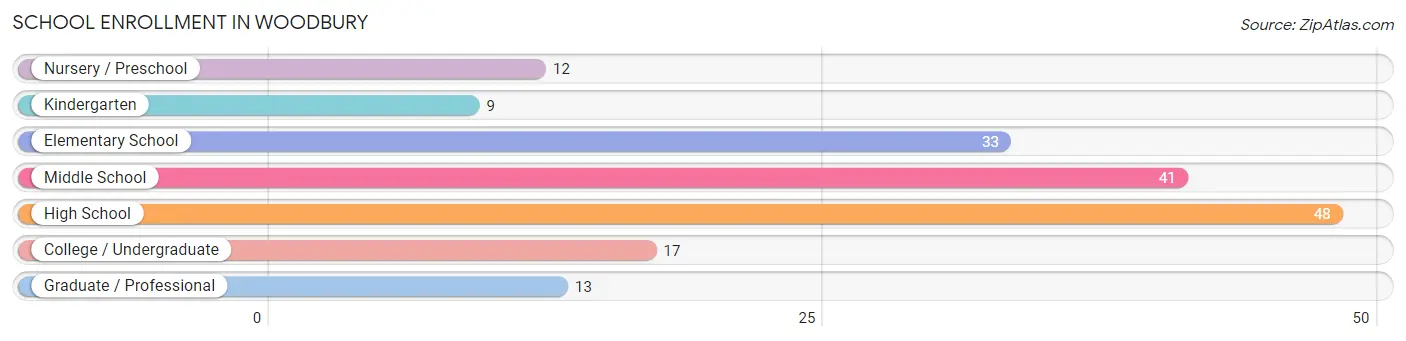
| School Level | # Students | % Students |
| Nursery / Preschool | 12 | 6.9% |
| Kindergarten | 9 | 5.2% |
| Elementary School | 33 | 19.1% |
| Middle School | 41 | 23.7% |
| High School | 48 | 27.8% |
| College / Undergraduate | 17 | 9.8% |
| Graduate / Professional | 13 | 7.5% |
| Total | 173 | 100.0% |
School Enrollment by Age by Funding Source in Woodbury
Out of a total of 173 students who are enrolled in schools in Woodbury, 23 (13.3%) attend a private institution, while the remaining 150 (86.7%) are enrolled in public schools. The age group of 3 to 4 year olds has the highest likelihood of being enrolled in private schools, with 4 (100.0% in the age bracket) enrolled. Conversely, the age group of 5 to 9 year old has the lowest likelihood of being enrolled in a private school, with 50 (100.0% in the age bracket) attending a public institution.
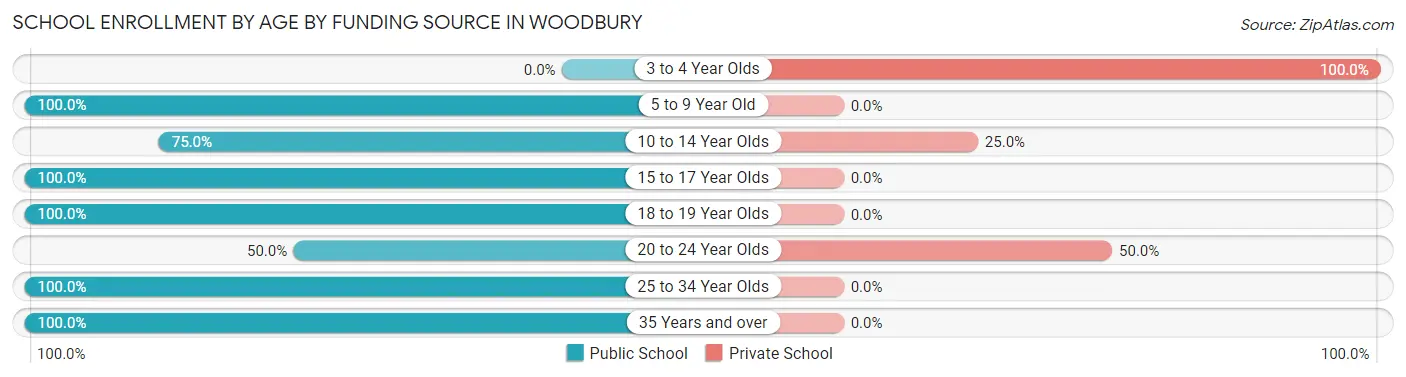
| Age Bracket | Public School | Private School |
| 3 to 4 Year Olds | 0 (0.0%) | 4 (100.0%) |
| 5 to 9 Year Old | 50 (100.0%) | 0 (0.0%) |
| 10 to 14 Year Olds | 33 (75.0%) | 11 (25.0%) |
| 15 to 17 Year Olds | 37 (100.0%) | 0 (0.0%) |
| 18 to 19 Year Olds | 7 (100.0%) | 0 (0.0%) |
| 20 to 24 Year Olds | 8 (50.0%) | 8 (50.0%) |
| 25 to 34 Year Olds | 7 (100.0%) | 0 (0.0%) |
| 35 Years and over | 8 (100.0%) | 0 (0.0%) |
| Total | 150 (86.7%) | 23 (13.3%) |
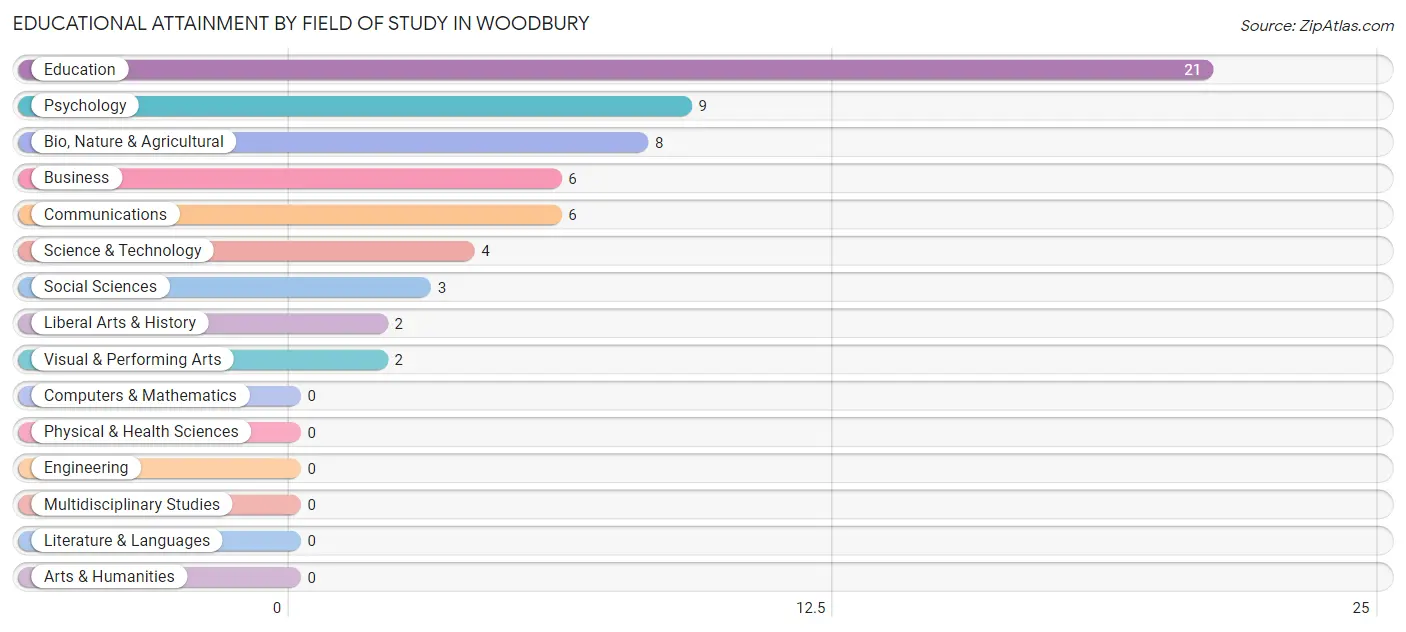
Educational Attainment by Field of Study in Woodbury
Education (21 | 34.4%), psychology (9 | 14.7%), bio, nature & agricultural (8 | 13.1%), business (6 | 9.8%), and communications (6 | 9.8%) are the most common fields of study among 61 individuals in Woodbury who have obtained a bachelor's degree or higher.
| Field of Study | # Graduates | % Graduates |
| Computers & Mathematics | 0 | 0.0% |
| Bio, Nature & Agricultural | 8 | 13.1% |
| Physical & Health Sciences | 0 | 0.0% |
| Psychology | 9 | 14.7% |
| Social Sciences | 3 | 4.9% |
| Engineering | 0 | 0.0% |
| Multidisciplinary Studies | 0 | 0.0% |
| Science & Technology | 4 | 6.6% |
| Business | 6 | 9.8% |
| Education | 21 | 34.4% |
| Literature & Languages | 0 | 0.0% |
| Liberal Arts & History | 2 | 3.3% |
| Visual & Performing Arts | 2 | 3.3% |
| Communications | 6 | 9.8% |
| Arts & Humanities | 0 | 0.0% |
| Total | 61 | 100.0% |
Transportation & Commute in Woodbury
Vehicle Availability by Sex in Woodbury
The most prevalent vehicle ownership categories in Woodbury are males with 3 vehicles (119, accounting for 55.6%) and females with 3 vehicles (37, making up 74.4%).
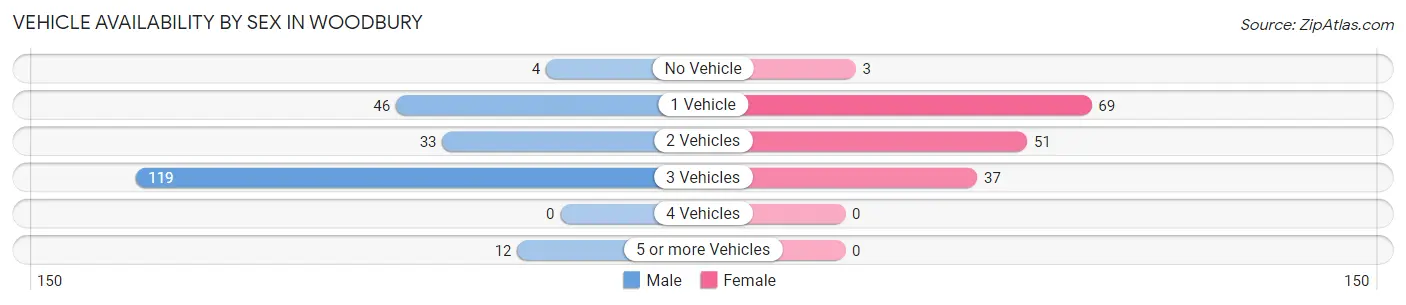
| Vehicles Available | Male | Female |
| No Vehicle | 4 (1.9%) | 3 (1.9%) |
| 1 Vehicle | 46 (21.5%) | 69 (43.1%) |
| 2 Vehicles | 33 (15.4%) | 51 (31.9%) |
| 3 Vehicles | 119 (55.6%) | 37 (23.1%) |
| 4 Vehicles | 0 (0.0%) | 0 (0.0%) |
| 5 or more Vehicles | 12 (5.6%) | 0 (0.0%) |
| Total | 214 (100.0%) | 160 (100.0%) |
Commute Time in Woodbury
The most frequently occuring commute durations in Woodbury are 45 to 59 minutes (159 commuters, 44.2%), 40 to 44 minutes (47 commuters, 13.1%), and 30 to 34 minutes (43 commuters, 11.9%).
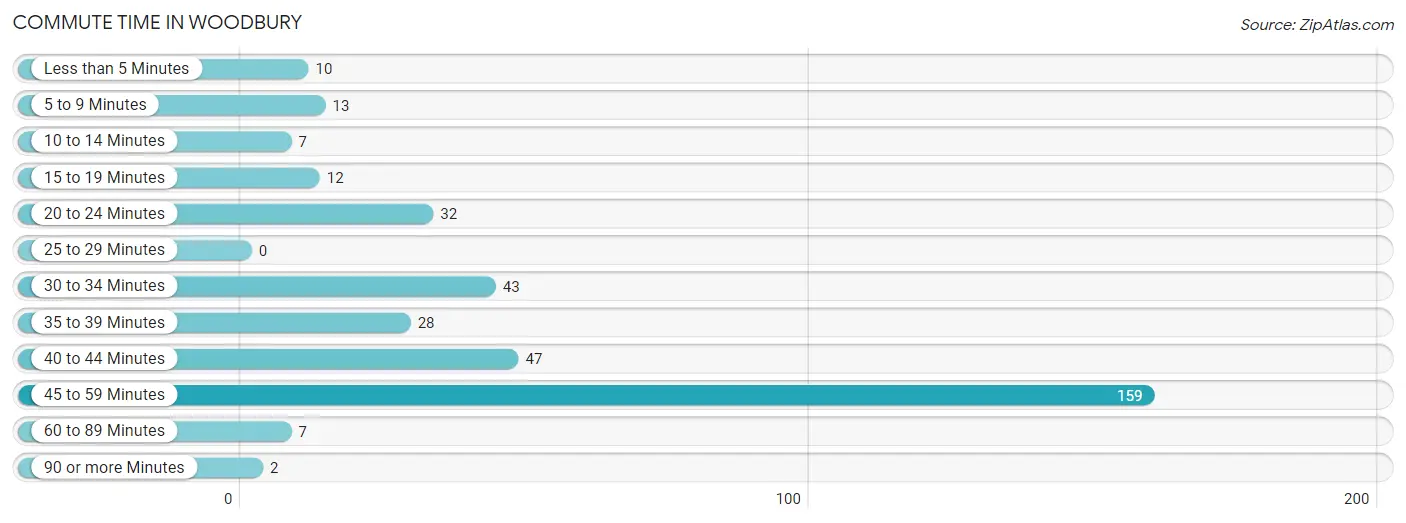
| Commute Time | # Commuters | % Commuters |
| Less than 5 Minutes | 10 | 2.8% |
| 5 to 9 Minutes | 13 | 3.6% |
| 10 to 14 Minutes | 7 | 1.9% |
| 15 to 19 Minutes | 12 | 3.3% |
| 20 to 24 Minutes | 32 | 8.9% |
| 25 to 29 Minutes | 0 | 0.0% |
| 30 to 34 Minutes | 43 | 11.9% |
| 35 to 39 Minutes | 28 | 7.8% |
| 40 to 44 Minutes | 47 | 13.1% |
| 45 to 59 Minutes | 159 | 44.2% |
| 60 to 89 Minutes | 7 | 1.9% |
| 90 or more Minutes | 2 | 0.6% |
Commute Time by Sex in Woodbury
The most common commute times in Woodbury are 45 to 59 minutes (81 commuters, 40.1%) for males and 45 to 59 minutes (78 commuters, 49.4%) for females.
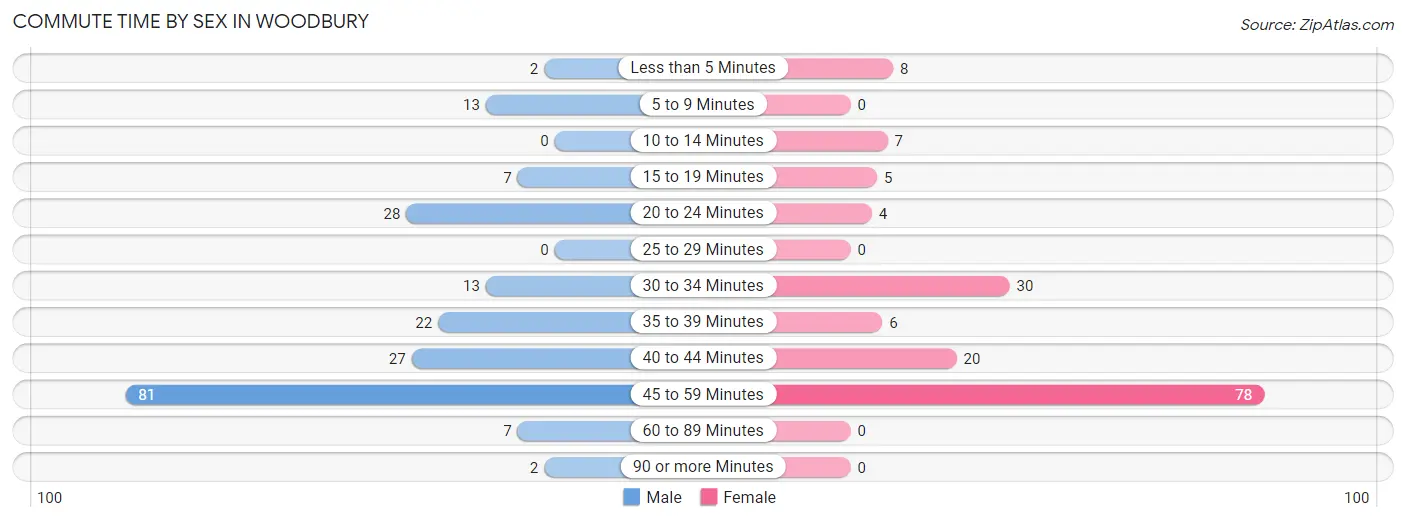
| Commute Time | Male | Female |
| Less than 5 Minutes | 2 (1.0%) | 8 (5.1%) |
| 5 to 9 Minutes | 13 (6.4%) | 0 (0.0%) |
| 10 to 14 Minutes | 0 (0.0%) | 7 (4.4%) |
| 15 to 19 Minutes | 7 (3.5%) | 5 (3.2%) |
| 20 to 24 Minutes | 28 (13.9%) | 4 (2.5%) |
| 25 to 29 Minutes | 0 (0.0%) | 0 (0.0%) |
| 30 to 34 Minutes | 13 (6.4%) | 30 (19.0%) |
| 35 to 39 Minutes | 22 (10.9%) | 6 (3.8%) |
| 40 to 44 Minutes | 27 (13.4%) | 20 (12.7%) |
| 45 to 59 Minutes | 81 (40.1%) | 78 (49.4%) |
| 60 to 89 Minutes | 7 (3.5%) | 0 (0.0%) |
| 90 or more Minutes | 2 (1.0%) | 0 (0.0%) |
Time of Departure to Work by Sex in Woodbury
The most frequent times of departure to work in Woodbury are 8:30 AM to 8:59 AM (45, 22.3%) for males and 7:00 AM to 7:29 AM (45, 28.5%) for females.
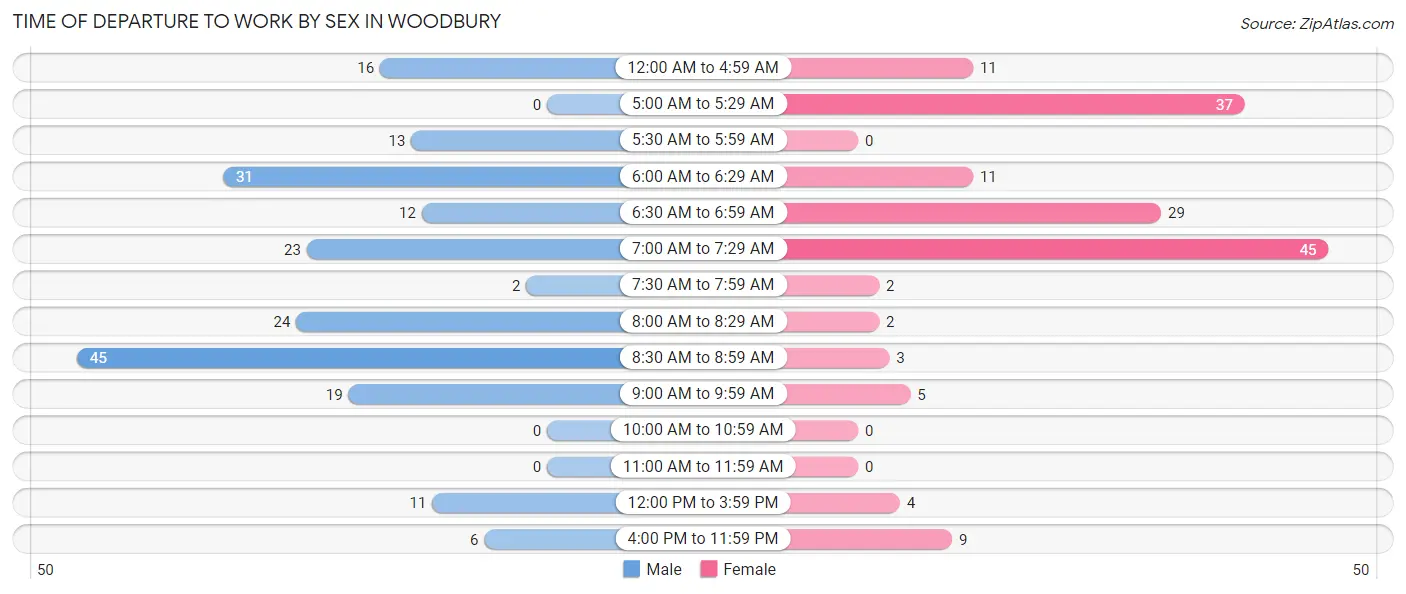
| Time of Departure | Male | Female |
| 12:00 AM to 4:59 AM | 16 (7.9%) | 11 (7.0%) |
| 5:00 AM to 5:29 AM | 0 (0.0%) | 37 (23.4%) |
| 5:30 AM to 5:59 AM | 13 (6.4%) | 0 (0.0%) |
| 6:00 AM to 6:29 AM | 31 (15.3%) | 11 (7.0%) |
| 6:30 AM to 6:59 AM | 12 (5.9%) | 29 (18.3%) |
| 7:00 AM to 7:29 AM | 23 (11.4%) | 45 (28.5%) |
| 7:30 AM to 7:59 AM | 2 (1.0%) | 2 (1.3%) |
| 8:00 AM to 8:29 AM | 24 (11.9%) | 2 (1.3%) |
| 8:30 AM to 8:59 AM | 45 (22.3%) | 3 (1.9%) |
| 9:00 AM to 9:59 AM | 19 (9.4%) | 5 (3.2%) |
| 10:00 AM to 10:59 AM | 0 (0.0%) | 0 (0.0%) |
| 11:00 AM to 11:59 AM | 0 (0.0%) | 0 (0.0%) |
| 12:00 PM to 3:59 PM | 11 (5.4%) | 4 (2.5%) |
| 4:00 PM to 11:59 PM | 6 (3.0%) | 9 (5.7%) |
| Total | 202 (100.0%) | 158 (100.0%) |
Housing Occupancy in Woodbury
Occupancy by Ownership in Woodbury
Of the total 293 dwellings in Woodbury, owner-occupied units account for 238 (81.2%), while renter-occupied units make up 55 (18.8%).
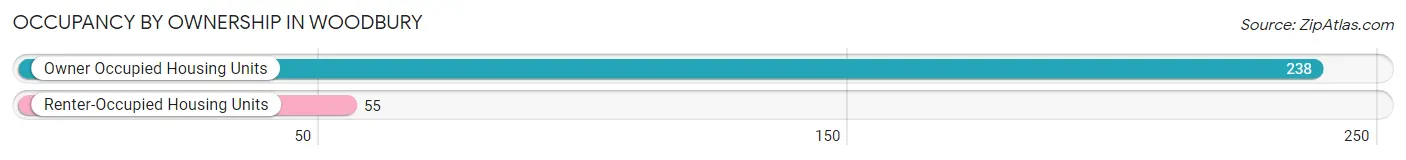
| Occupancy | # Housing Units | % Housing Units |
| Owner Occupied Housing Units | 238 | 81.2% |
| Renter-Occupied Housing Units | 55 | 18.8% |
| Total Occupied Housing Units | 293 | 100.0% |
Occupancy by Household Size in Woodbury
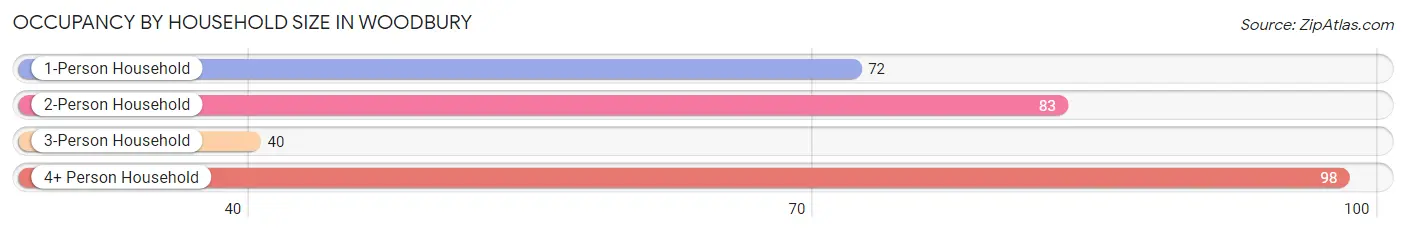
| Household Size | # Housing Units | % Housing Units |
| 1-Person Household | 72 | 24.6% |
| 2-Person Household | 83 | 28.3% |
| 3-Person Household | 40 | 13.7% |
| 4+ Person Household | 98 | 33.5% |
| Total Housing Units | 293 | 100.0% |
Occupancy by Ownership by Household Size in Woodbury
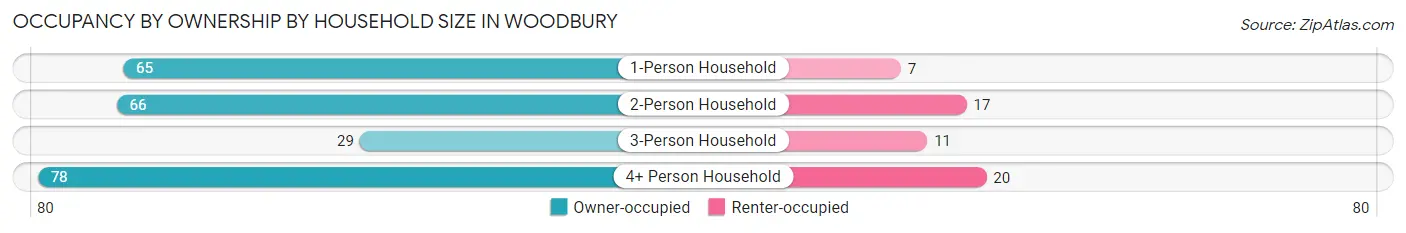
| Household Size | Owner-occupied | Renter-occupied |
| 1-Person Household | 65 (90.3%) | 7 (9.7%) |
| 2-Person Household | 66 (79.5%) | 17 (20.5%) |
| 3-Person Household | 29 (72.5%) | 11 (27.5%) |
| 4+ Person Household | 78 (79.6%) | 20 (20.4%) |
| Total Housing Units | 238 (81.2%) | 55 (18.8%) |
Occupancy by Educational Attainment in Woodbury
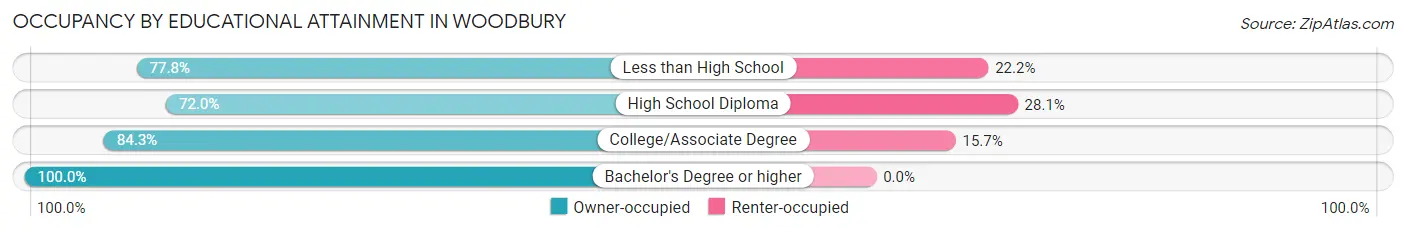
| Household Size | Owner-occupied | Renter-occupied |
| Less than High School | 63 (77.8%) | 18 (22.2%) |
| High School Diploma | 59 (72.0%) | 23 (28.1%) |
| College/Associate Degree | 75 (84.3%) | 14 (15.7%) |
| Bachelor's Degree or higher | 41 (100.0%) | 0 (0.0%) |
Occupancy by Age of Householder in Woodbury
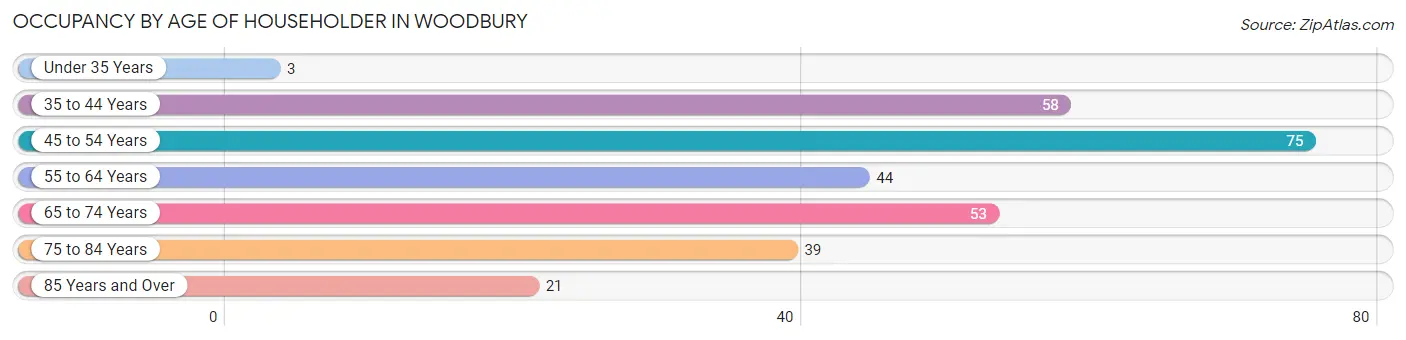
| Age Bracket | # Households | % Households |
| Under 35 Years | 3 | 1.0% |
| 35 to 44 Years | 58 | 19.8% |
| 45 to 54 Years | 75 | 25.6% |
| 55 to 64 Years | 44 | 15.0% |
| 65 to 74 Years | 53 | 18.1% |
| 75 to 84 Years | 39 | 13.3% |
| 85 Years and Over | 21 | 7.2% |
| Total | 293 | 100.0% |
Housing Finances in Woodbury
Median Income by Occupancy in Woodbury
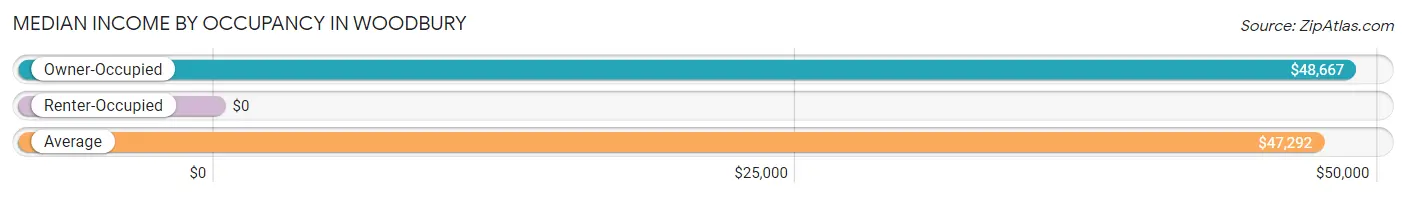
| Occupancy Type | # Households | Median Income |
| Owner-Occupied | 238 (81.2%) | $48,667 |
| Renter-Occupied | 55 (18.8%) | $0 |
| Average | 293 (100.0%) | $47,292 |
Occupancy by Householder Income Bracket in Woodbury
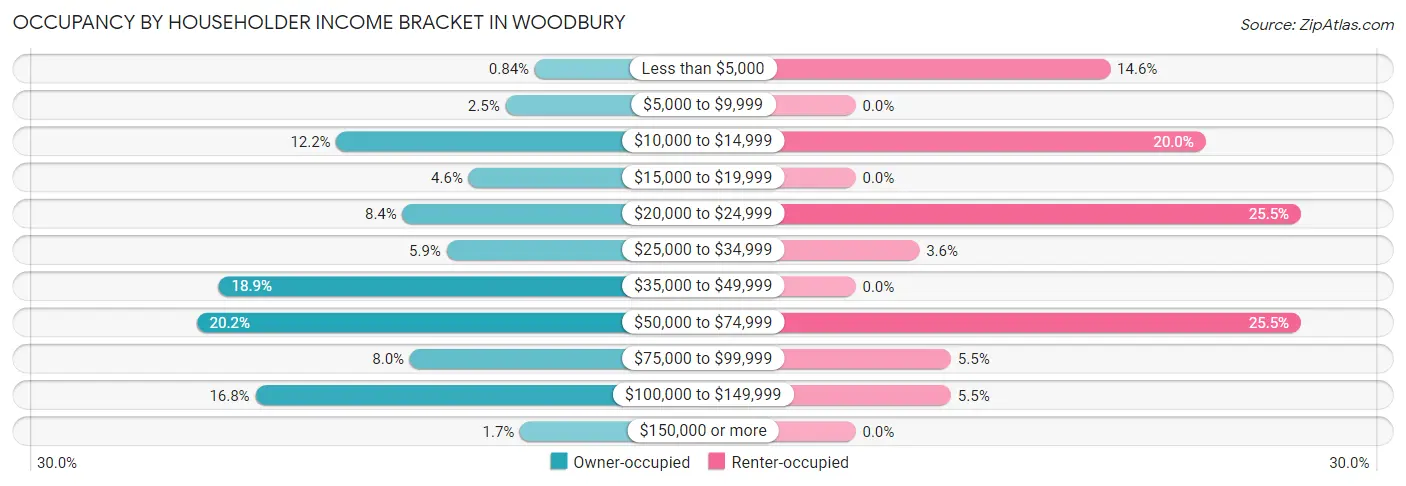
| Income Bracket | Owner-occupied | Renter-occupied |
| Less than $5,000 | 2 (0.8%) | 8 (14.5%) |
| $5,000 to $9,999 | 6 (2.5%) | 0 (0.0%) |
| $10,000 to $14,999 | 29 (12.2%) | 11 (20.0%) |
| $15,000 to $19,999 | 11 (4.6%) | 0 (0.0%) |
| $20,000 to $24,999 | 20 (8.4%) | 14 (25.5%) |
| $25,000 to $34,999 | 14 (5.9%) | 2 (3.6%) |
| $35,000 to $49,999 | 45 (18.9%) | 0 (0.0%) |
| $50,000 to $74,999 | 48 (20.2%) | 14 (25.5%) |
| $75,000 to $99,999 | 19 (8.0%) | 3 (5.4%) |
| $100,000 to $149,999 | 40 (16.8%) | 3 (5.4%) |
| $150,000 or more | 4 (1.7%) | 0 (0.0%) |
| Total | 238 (100.0%) | 55 (100.0%) |
Monthly Housing Cost Tiers in Woodbury
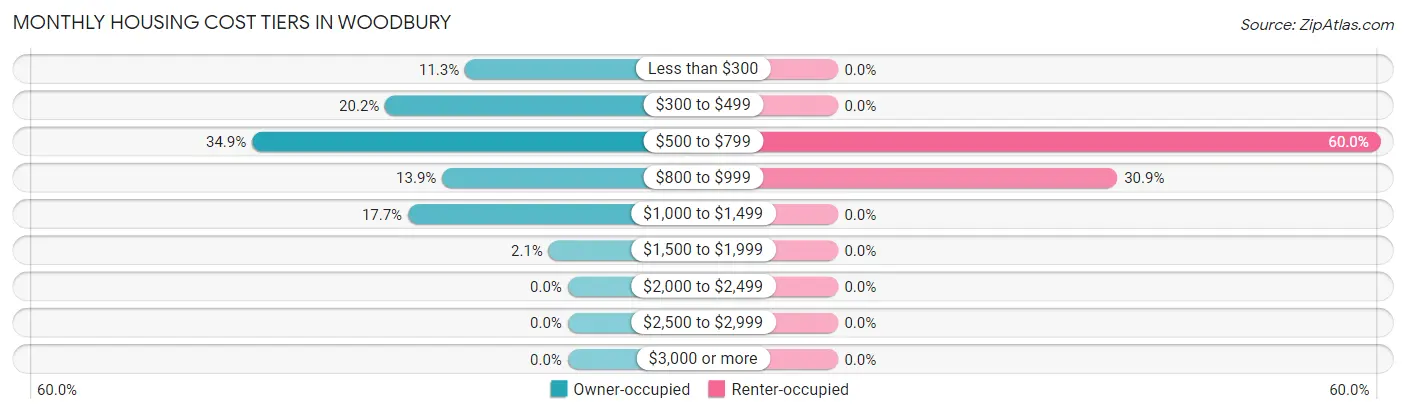
| Monthly Cost | Owner-occupied | Renter-occupied |
| Less than $300 | 27 (11.3%) | 0 (0.0%) |
| $300 to $499 | 48 (20.2%) | 0 (0.0%) |
| $500 to $799 | 83 (34.9%) | 33 (60.0%) |
| $800 to $999 | 33 (13.9%) | 17 (30.9%) |
| $1,000 to $1,499 | 42 (17.6%) | 0 (0.0%) |
| $1,500 to $1,999 | 5 (2.1%) | 0 (0.0%) |
| $2,000 to $2,499 | 0 (0.0%) | 0 (0.0%) |
| $2,500 to $2,999 | 0 (0.0%) | 0 (0.0%) |
| $3,000 or more | 0 (0.0%) | 0 (0.0%) |
| Total | 238 (100.0%) | 55 (100.0%) |
Physical Housing Characteristics in Woodbury
Housing Structures in Woodbury
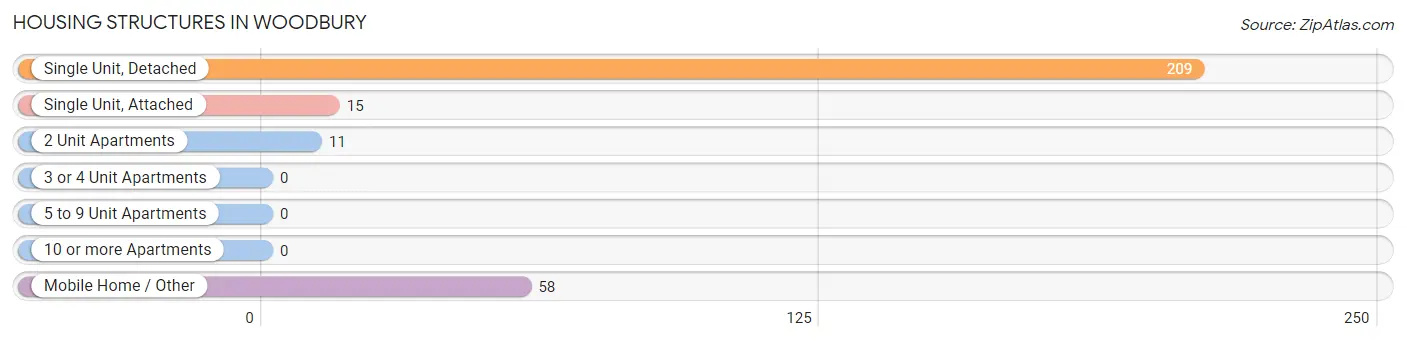
| Structure Type | # Housing Units | % Housing Units |
| Single Unit, Detached | 209 | 71.3% |
| Single Unit, Attached | 15 | 5.1% |
| 2 Unit Apartments | 11 | 3.7% |
| 3 or 4 Unit Apartments | 0 | 0.0% |
| 5 to 9 Unit Apartments | 0 | 0.0% |
| 10 or more Apartments | 0 | 0.0% |
| Mobile Home / Other | 58 | 19.8% |
| Total | 293 | 100.0% |
Housing Structures by Occupancy in Woodbury
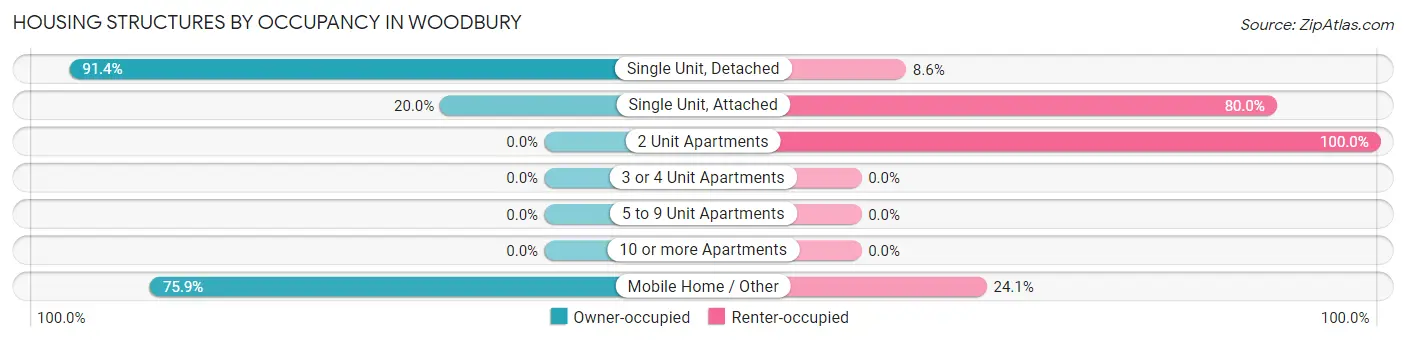
| Structure Type | Owner-occupied | Renter-occupied |
| Single Unit, Detached | 191 (91.4%) | 18 (8.6%) |
| Single Unit, Attached | 3 (20.0%) | 12 (80.0%) |
| 2 Unit Apartments | 0 (0.0%) | 11 (100.0%) |
| 3 or 4 Unit Apartments | 0 (0.0%) | 0 (0.0%) |
| 5 to 9 Unit Apartments | 0 (0.0%) | 0 (0.0%) |
| 10 or more Apartments | 0 (0.0%) | 0 (0.0%) |
| Mobile Home / Other | 44 (75.9%) | 14 (24.1%) |
| Total | 238 (81.2%) | 55 (18.8%) |
Housing Structures by Number of Rooms in Woodbury
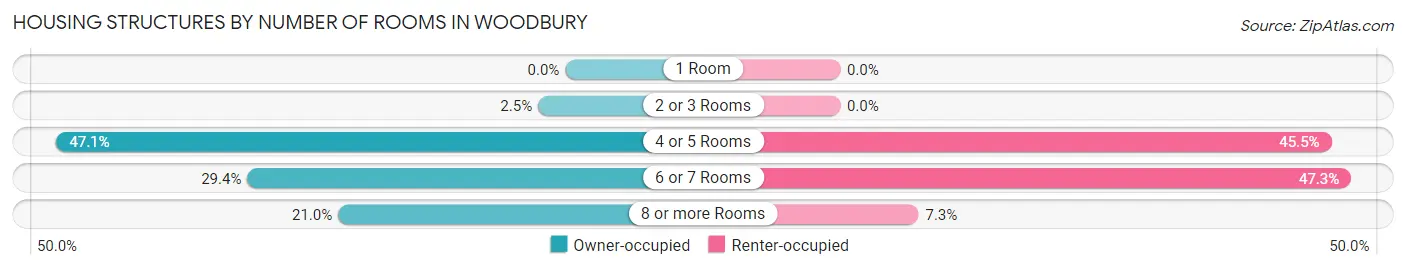
| Number of Rooms | Owner-occupied | Renter-occupied |
| 1 Room | 0 (0.0%) | 0 (0.0%) |
| 2 or 3 Rooms | 6 (2.5%) | 0 (0.0%) |
| 4 or 5 Rooms | 112 (47.1%) | 25 (45.5%) |
| 6 or 7 Rooms | 70 (29.4%) | 26 (47.3%) |
| 8 or more Rooms | 50 (21.0%) | 4 (7.3%) |
| Total | 238 (100.0%) | 55 (100.0%) |
Housing Structure by Heating Type in Woodbury
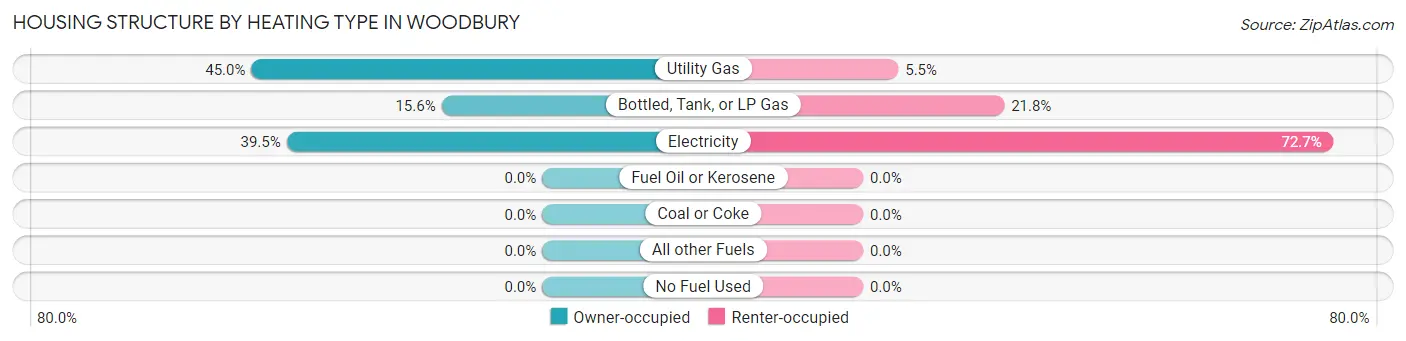
| Heating Type | Owner-occupied | Renter-occupied |
| Utility Gas | 107 (45.0%) | 3 (5.4%) |
| Bottled, Tank, or LP Gas | 37 (15.5%) | 12 (21.8%) |
| Electricity | 94 (39.5%) | 40 (72.7%) |
| Fuel Oil or Kerosene | 0 (0.0%) | 0 (0.0%) |
| Coal or Coke | 0 (0.0%) | 0 (0.0%) |
| All other Fuels | 0 (0.0%) | 0 (0.0%) |
| No Fuel Used | 0 (0.0%) | 0 (0.0%) |
| Total | 238 (100.0%) | 55 (100.0%) |
Household Vehicle Usage in Woodbury
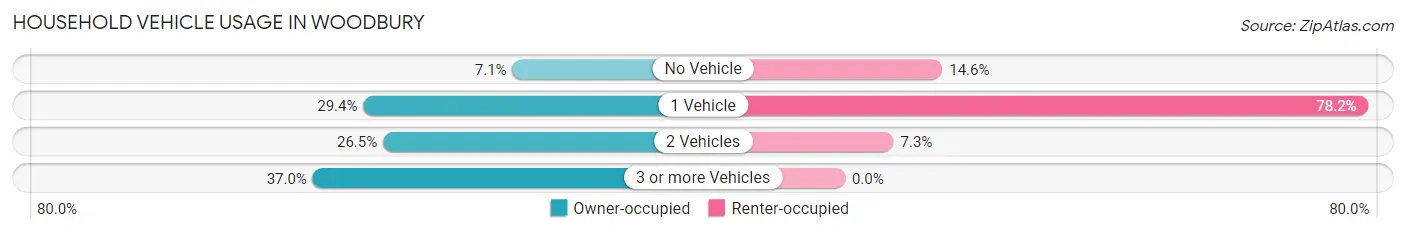
| Vehicles per Household | Owner-occupied | Renter-occupied |
| No Vehicle | 17 (7.1%) | 8 (14.5%) |
| 1 Vehicle | 70 (29.4%) | 43 (78.2%) |
| 2 Vehicles | 63 (26.5%) | 4 (7.3%) |
| 3 or more Vehicles | 88 (37.0%) | 0 (0.0%) |
| Total | 238 (100.0%) | 55 (100.0%) |
Real Estate & Mortgages in Woodbury
Real Estate and Mortgage Overview in Woodbury
| Characteristic | Without Mortgage | With Mortgage |
| Housing Units | 146 | 92 |
| Median Property Value | $68,100 | $130,400 |
| Median Household Income | $47,917 | $4 |
| Monthly Housing Costs | $491 | $0 |
| Real Estate Taxes | $865 | $0 |
Property Value by Mortgage Status in Woodbury
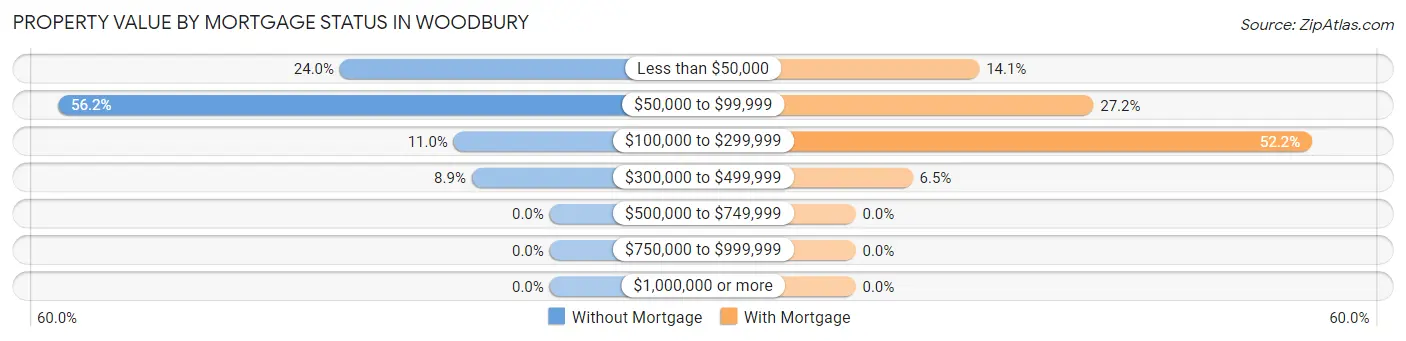
| Property Value | Without Mortgage | With Mortgage |
| Less than $50,000 | 35 (24.0%) | 13 (14.1%) |
| $50,000 to $99,999 | 82 (56.2%) | 25 (27.2%) |
| $100,000 to $299,999 | 16 (11.0%) | 48 (52.2%) |
| $300,000 to $499,999 | 13 (8.9%) | 6 (6.5%) |
| $500,000 to $749,999 | 0 (0.0%) | 0 (0.0%) |
| $750,000 to $999,999 | 0 (0.0%) | 0 (0.0%) |
| $1,000,000 or more | 0 (0.0%) | 0 (0.0%) |
| Total | 146 (100.0%) | 92 (100.0%) |
Household Income by Mortgage Status in Woodbury
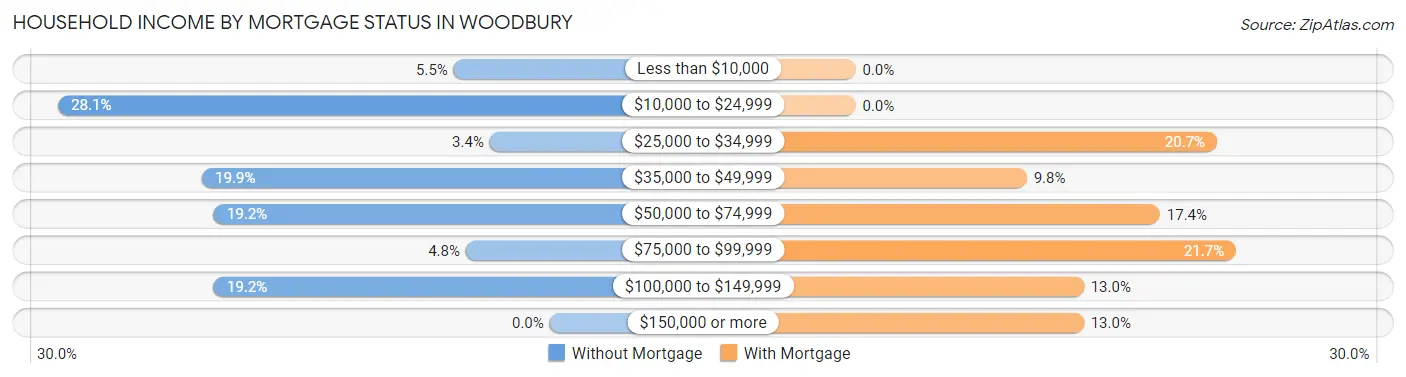
| Household Income | Without Mortgage | With Mortgage |
| Less than $10,000 | 8 (5.5%) | 0 (0.0%) |
| $10,000 to $24,999 | 41 (28.1%) | 0 (0.0%) |
| $25,000 to $34,999 | 5 (3.4%) | 19 (20.6%) |
| $35,000 to $49,999 | 29 (19.9%) | 9 (9.8%) |
| $50,000 to $74,999 | 28 (19.2%) | 16 (17.4%) |
| $75,000 to $99,999 | 7 (4.8%) | 20 (21.7%) |
| $100,000 to $149,999 | 28 (19.2%) | 12 (13.0%) |
| $150,000 or more | 0 (0.0%) | 12 (13.0%) |
| Total | 146 (100.0%) | 92 (100.0%) |
Property Value to Household Income Ratio in Woodbury
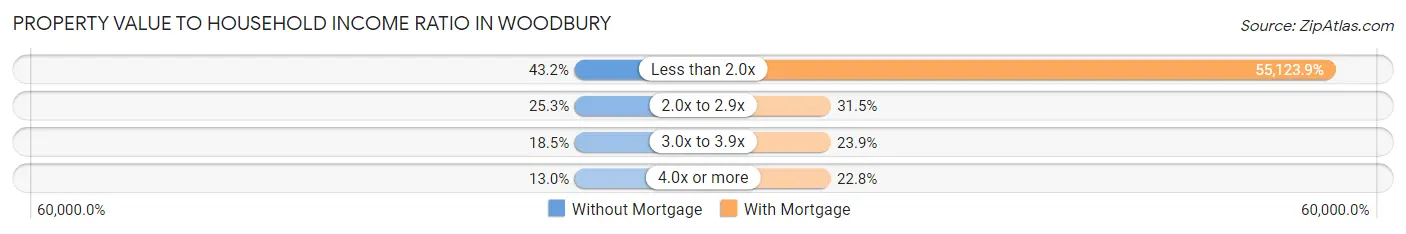
| Value-to-Income Ratio | Without Mortgage | With Mortgage |
| Less than 2.0x | 63 (43.1%) | 50,714 (55,123.9%) |
| 2.0x to 2.9x | 37 (25.3%) | 29 (31.5%) |
| 3.0x to 3.9x | 27 (18.5%) | 22 (23.9%) |
| 4.0x or more | 19 (13.0%) | 21 (22.8%) |
| Total | 146 (100.0%) | 92 (100.0%) |
Real Estate Taxes by Mortgage Status in Woodbury
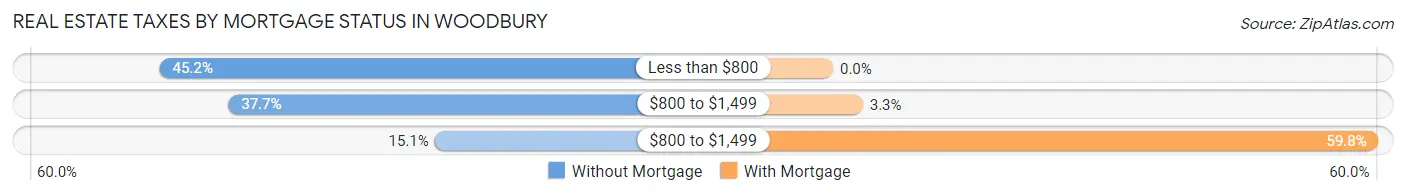
| Property Taxes | Without Mortgage | With Mortgage |
| Less than $800 | 66 (45.2%) | 0 (0.0%) |
| $800 to $1,499 | 55 (37.7%) | 3 (3.3%) |
| $800 to $1,499 | 22 (15.1%) | 55 (59.8%) |
| Total | 146 (100.0%) | 92 (100.0%) |
Health & Disability in Woodbury
Health Insurance Coverage by Age in Woodbury
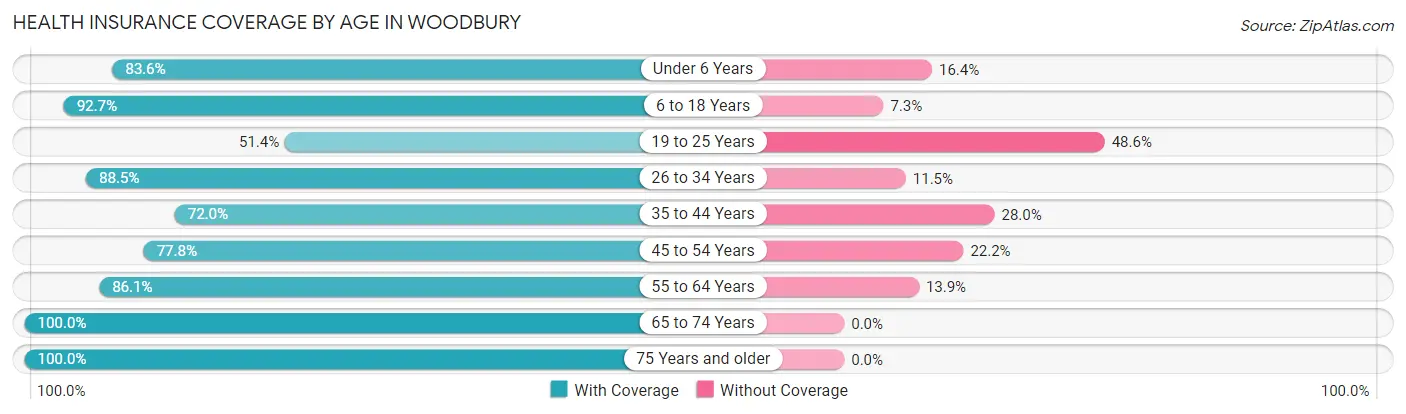
| Age Bracket | With Coverage | Without Coverage |
| Under 6 Years | 46 (83.6%) | 9 (16.4%) |
| 6 to 18 Years | 127 (92.7%) | 10 (7.3%) |
| 19 to 25 Years | 18 (51.4%) | 17 (48.6%) |
| 26 to 34 Years | 54 (88.5%) | 7 (11.5%) |
| 35 to 44 Years | 149 (72.0%) | 58 (28.0%) |
| 45 to 54 Years | 98 (77.8%) | 28 (22.2%) |
| 55 to 64 Years | 68 (86.1%) | 11 (13.9%) |
| 65 to 74 Years | 104 (100.0%) | 0 (0.0%) |
| 75 Years and older | 68 (100.0%) | 0 (0.0%) |
| Total | 732 (83.9%) | 140 (16.1%) |
Health Insurance Coverage by Citizenship Status in Woodbury
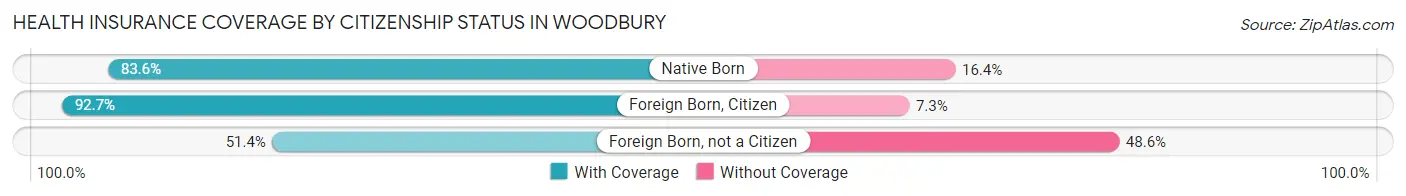
| Citizenship Status | With Coverage | Without Coverage |
| Native Born | 46 (83.6%) | 9 (16.4%) |
| Foreign Born, Citizen | 127 (92.7%) | 10 (7.3%) |
| Foreign Born, not a Citizen | 18 (51.4%) | 17 (48.6%) |
Health Insurance Coverage by Household Income in Woodbury
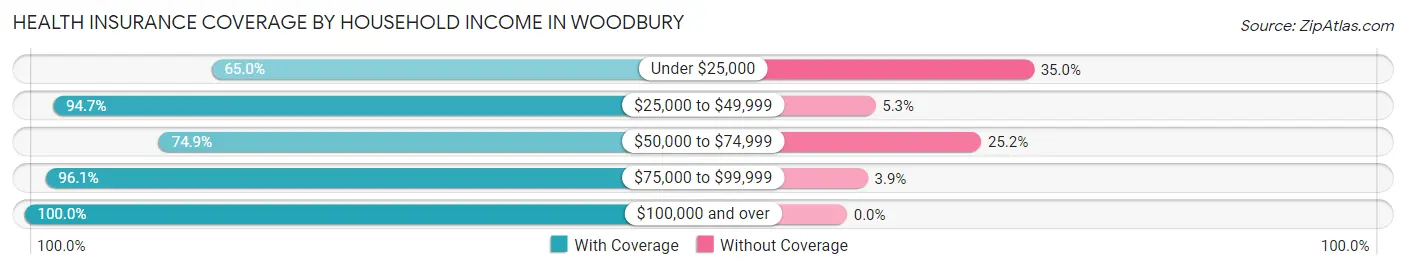
| Household Income | With Coverage | Without Coverage |
| Under $25,000 | 154 (65.0%) | 83 (35.0%) |
| $25,000 to $49,999 | 195 (94.7%) | 11 (5.3%) |
| $50,000 to $74,999 | 128 (74.9%) | 43 (25.2%) |
| $75,000 to $99,999 | 74 (96.1%) | 3 (3.9%) |
| $100,000 and over | 181 (100.0%) | 0 (0.0%) |
Public vs Private Health Insurance Coverage by Age in Woodbury
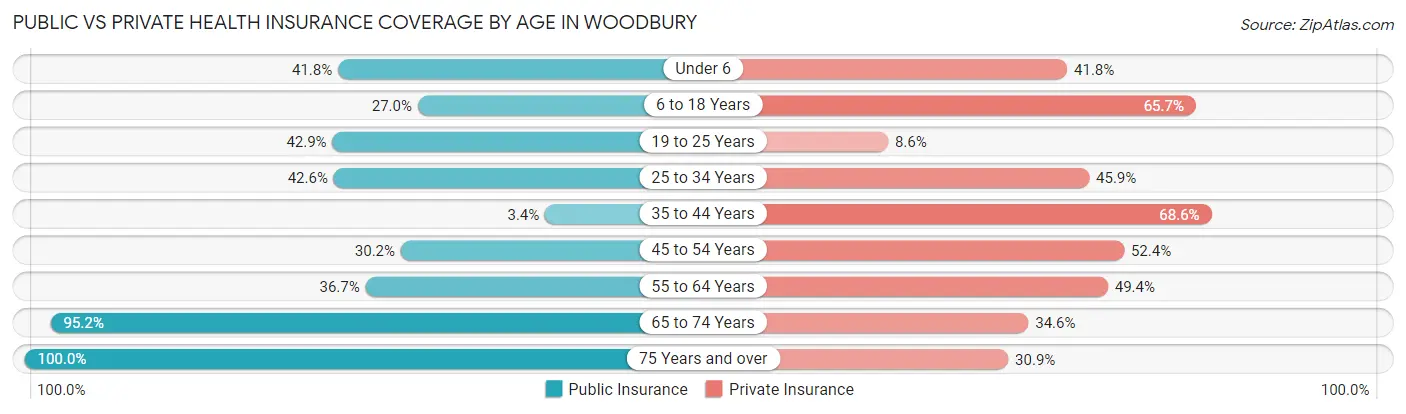
| Age Bracket | Public Insurance | Private Insurance |
| Under 6 | 23 (41.8%) | 23 (41.8%) |
| 6 to 18 Years | 37 (27.0%) | 90 (65.7%) |
| 19 to 25 Years | 15 (42.9%) | 3 (8.6%) |
| 25 to 34 Years | 26 (42.6%) | 28 (45.9%) |
| 35 to 44 Years | 7 (3.4%) | 142 (68.6%) |
| 45 to 54 Years | 38 (30.2%) | 66 (52.4%) |
| 55 to 64 Years | 29 (36.7%) | 39 (49.4%) |
| 65 to 74 Years | 99 (95.2%) | 36 (34.6%) |
| 75 Years and over | 68 (100.0%) | 21 (30.9%) |
| Total | 342 (39.2%) | 448 (51.4%) |
Disability Status by Sex by Age in Woodbury
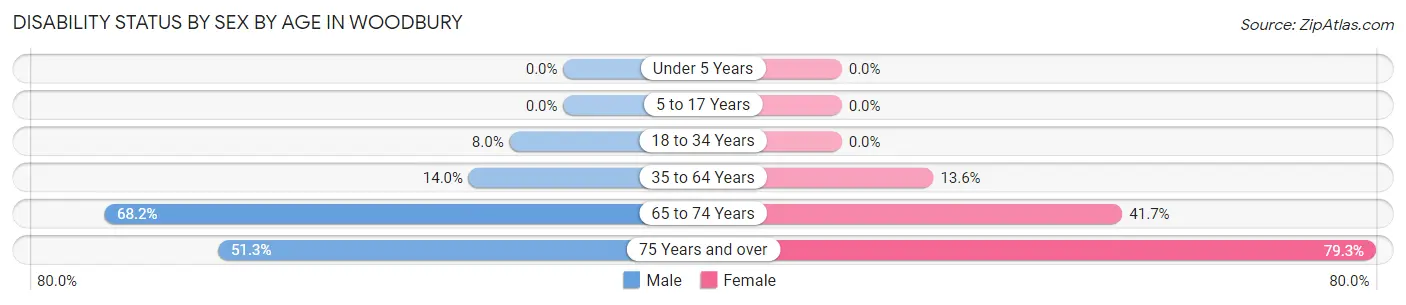
| Age Bracket | Male | Female |
| Under 5 Years | 0 (0.0%) | 0 (0.0%) |
| 5 to 17 Years | 0 (0.0%) | 0 (0.0%) |
| 18 to 34 Years | 4 (8.0%) | 0 (0.0%) |
| 35 to 64 Years | 31 (14.0%) | 26 (13.6%) |
| 65 to 74 Years | 30 (68.2%) | 25 (41.7%) |
| 75 Years and over | 20 (51.3%) | 23 (79.3%) |
Disability Class by Sex by Age in Woodbury
Disability Class: Hearing Difficulty
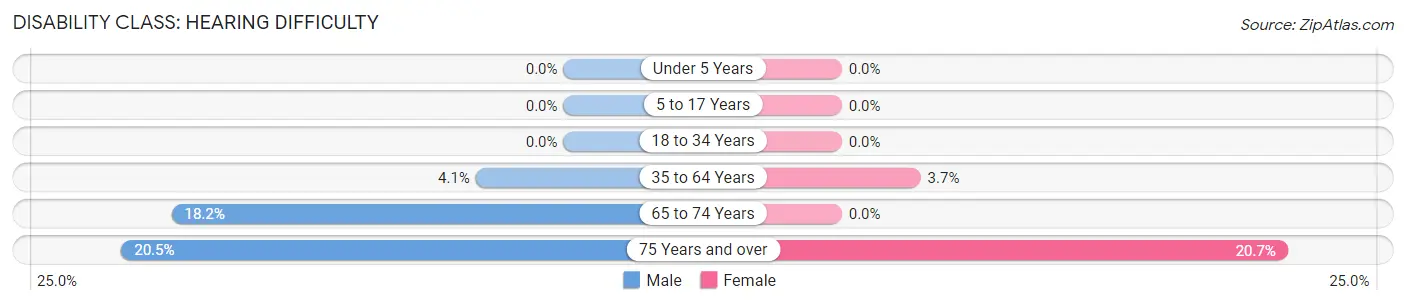
| Age Bracket | Male | Female |
| Under 5 Years | 0 (0.0%) | 0 (0.0%) |
| 5 to 17 Years | 0 (0.0%) | 0 (0.0%) |
| 18 to 34 Years | 0 (0.0%) | 0 (0.0%) |
| 35 to 64 Years | 9 (4.1%) | 7 (3.7%) |
| 65 to 74 Years | 8 (18.2%) | 0 (0.0%) |
| 75 Years and over | 8 (20.5%) | 6 (20.7%) |
Disability Class: Vision Difficulty
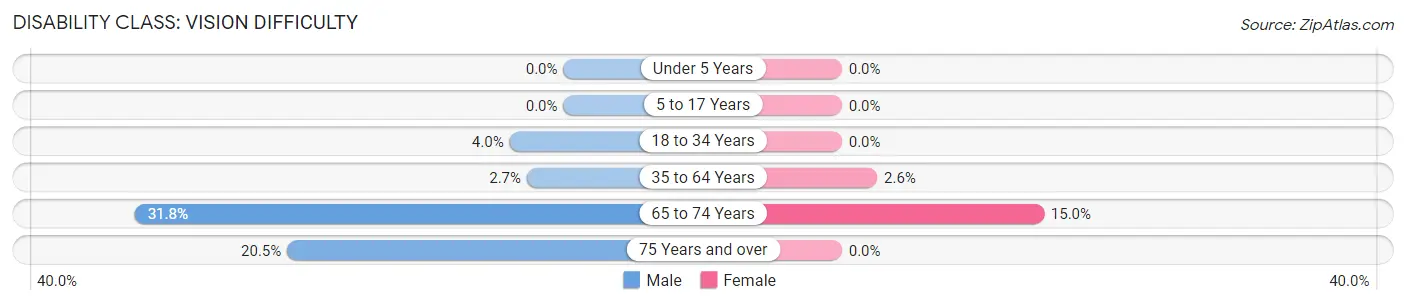
| Age Bracket | Male | Female |
| Under 5 Years | 0 (0.0%) | 0 (0.0%) |
| 5 to 17 Years | 0 (0.0%) | 0 (0.0%) |
| 18 to 34 Years | 2 (4.0%) | 0 (0.0%) |
| 35 to 64 Years | 6 (2.7%) | 5 (2.6%) |
| 65 to 74 Years | 14 (31.8%) | 9 (15.0%) |
| 75 Years and over | 8 (20.5%) | 0 (0.0%) |
Disability Class: Cognitive Difficulty
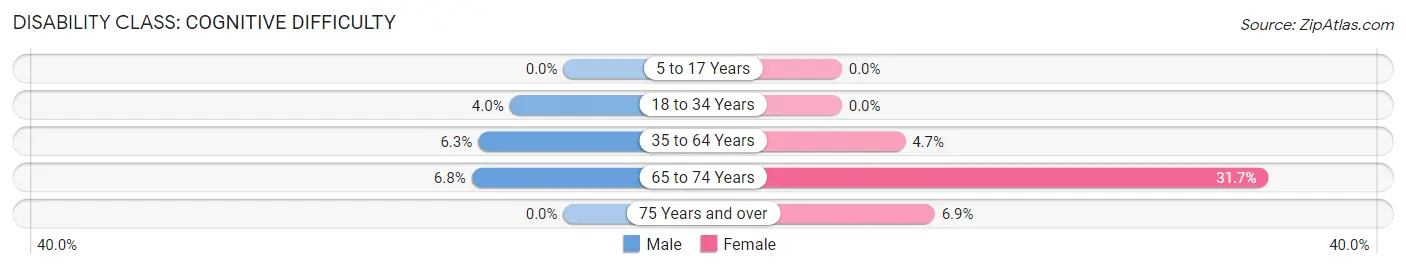
| Age Bracket | Male | Female |
| 5 to 17 Years | 0 (0.0%) | 0 (0.0%) |
| 18 to 34 Years | 2 (4.0%) | 0 (0.0%) |
| 35 to 64 Years | 14 (6.3%) | 9 (4.7%) |
| 65 to 74 Years | 3 (6.8%) | 19 (31.7%) |
| 75 Years and over | 0 (0.0%) | 2 (6.9%) |
Disability Class: Ambulatory Difficulty
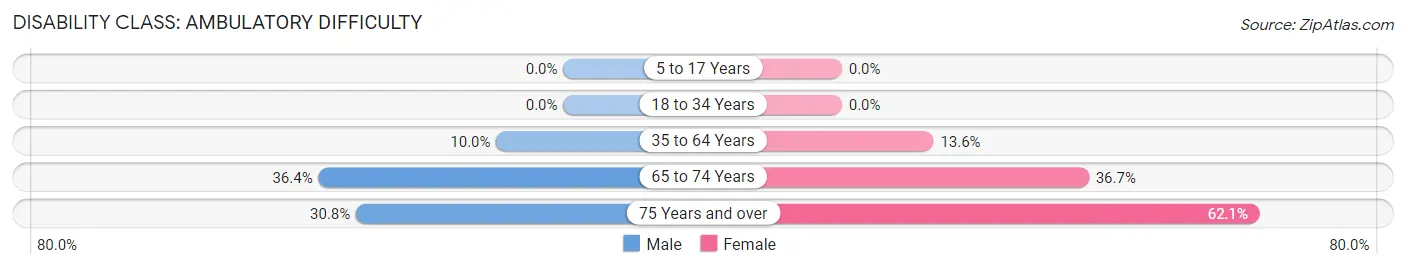
| Age Bracket | Male | Female |
| 5 to 17 Years | 0 (0.0%) | 0 (0.0%) |
| 18 to 34 Years | 0 (0.0%) | 0 (0.0%) |
| 35 to 64 Years | 22 (10.0%) | 26 (13.6%) |
| 65 to 74 Years | 16 (36.4%) | 22 (36.7%) |
| 75 Years and over | 12 (30.8%) | 18 (62.1%) |
Disability Class: Self-Care Difficulty
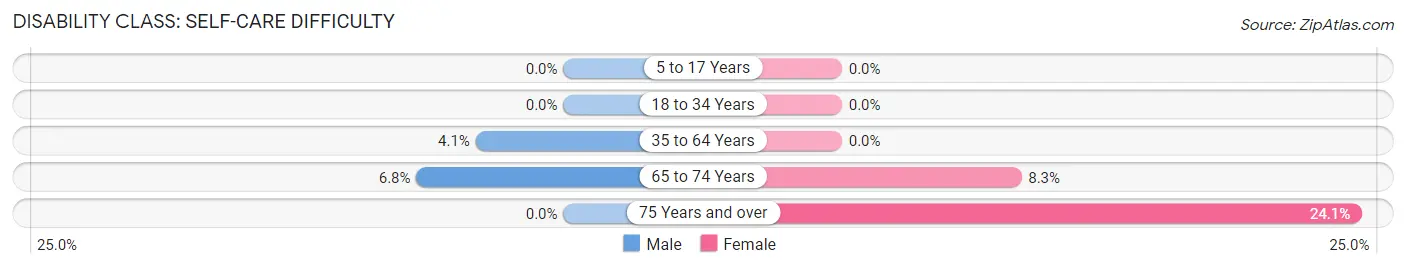
| Age Bracket | Male | Female |
| 5 to 17 Years | 0 (0.0%) | 0 (0.0%) |
| 18 to 34 Years | 0 (0.0%) | 0 (0.0%) |
| 35 to 64 Years | 9 (4.1%) | 0 (0.0%) |
| 65 to 74 Years | 3 (6.8%) | 5 (8.3%) |
| 75 Years and over | 0 (0.0%) | 7 (24.1%) |
Technology Access in Woodbury
Computing Device Access in Woodbury
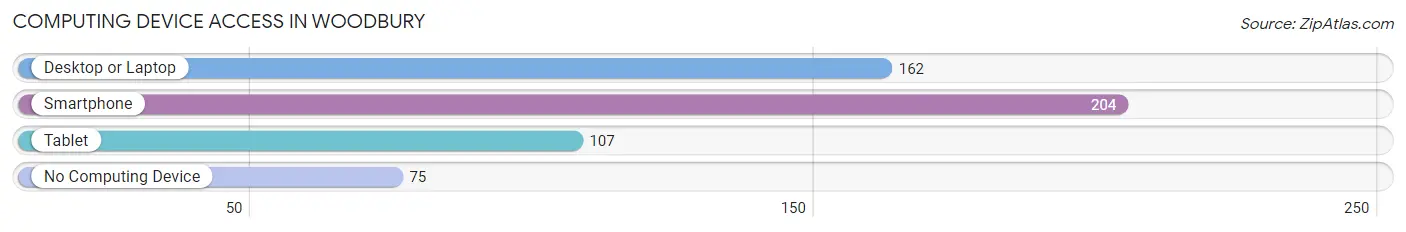
| Device Type | # Households | % Households |
| Desktop or Laptop | 162 | 55.3% |
| Smartphone | 204 | 69.6% |
| Tablet | 107 | 36.5% |
| No Computing Device | 75 | 25.6% |
| Total | 293 | 100.0% |
Internet Access in Woodbury
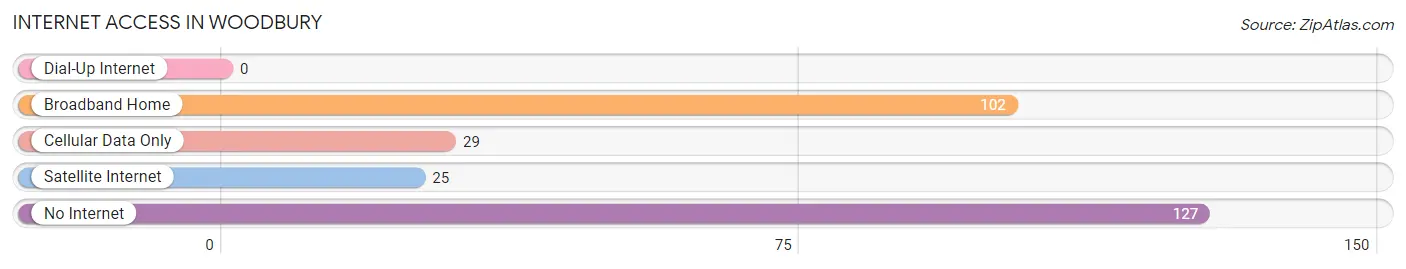
| Internet Type | # Households | % Households |
| Dial-Up Internet | 0 | 0.0% |
| Broadband Home | 102 | 34.8% |
| Cellular Data Only | 29 | 9.9% |
| Satellite Internet | 25 | 8.5% |
| No Internet | 127 | 43.3% |
| Total | 293 | 100.0% |
Woodbury Summary
Woodbury, Georgia is a small city located in Meriwether County, Georgia. It is situated in the foothills of the Appalachian Mountains, approximately 50 miles south of Atlanta. The city has a population of approximately 1,500 people and is the county seat of Meriwether County.
History
Woodbury was founded in 1825 by a group of settlers from South Carolina. The town was named after the first settler, William Woodbury. The town was originally a trading post and was the first county seat of Meriwether County. In 1832, the town was incorporated and the first courthouse was built.
In the late 1800s, Woodbury was a thriving agricultural community. The town was known for its cotton production and was home to several cotton mills. The town also had a thriving timber industry and was home to several sawmills.
In the early 1900s, the town began to decline as the cotton and timber industries moved away. The town was revitalized in the 1950s when the Georgia Power Company built a hydroelectric dam on the Flint River. The dam provided electricity to the town and the surrounding area.
Geography
Woodbury is located in the foothills of the Appalachian Mountains in Meriwether County, Georgia. The city is situated on the banks of the Flint River and is approximately 50 miles south of Atlanta. The city has a total area of 2.2 square miles, all of which is land.
The climate in Woodbury is humid subtropical, with hot, humid summers and mild winters. The average annual temperature is 64 degrees Fahrenheit. The average annual precipitation is 48 inches.
Economy
The economy of Woodbury is largely based on agriculture and tourism. The town is home to several farms that produce cotton, corn, soybeans, and other crops. The town is also home to several tourist attractions, including the Meriwether County Historical Museum and the Woodbury Wildlife Refuge.
The town is also home to several small businesses, including restaurants, retail stores, and service providers. The town is also home to several manufacturing companies, including a furniture factory and a paper mill.
Demographics
As of the 2010 census, the population of Woodbury was 1,500. The racial makeup of the town was 79.2% White, 17.3% African American, 0.7% Native American, 0.7% Asian, 0.2% Pacific Islander, and 1.9% from other races. Hispanic or Latino of any race were 2.3% of the population.
The median household income in Woodbury was $31,250, and the median family income was $37,500. The per capita income in Woodbury was $17,857. About 17.3% of families and 20.2% of the population were below the poverty line, including 28.3% of those under age 18 and 11.1% of those age 65 or over.
Common Questions
What is Per Capita Income in Woodbury?
Per Capita income in Woodbury is $22,831.
What is the Median Family Income in Woodbury?
Median Family Income in Woodbury is $53,611.
What is the Median Household income in Woodbury?
Median Household Income in Woodbury is $47,292.
What is Income or Wage Gap in Woodbury?
Income or Wage Gap in Woodbury is 32.4%.
Women in Woodbury earn 67.6 cents for every dollar earned by a man.
What is Family Income Deficit in Woodbury?
Family Income Deficit in Woodbury is $13,529.
Families that are below poverty line in Woodbury earn $13,529 less on average than the poverty threshold level.
What is Inequality or Gini Index in Woodbury?
Inequality or Gini Index in Woodbury is 0.40.
What is the Total Population of Woodbury?
Total Population of Woodbury is 872.
What is the Total Male Population of Woodbury?
Total Male Population of Woodbury is 427.
What is the Total Female Population of Woodbury?
Total Female Population of Woodbury is 445.
What is the Ratio of Males per 100 Females in Woodbury?
There are 95.96 Males per 100 Females in Woodbury.
What is the Ratio of Females per 100 Males in Woodbury?
There are 104.22 Females per 100 Males in Woodbury.
What is the Median Population Age in Woodbury?
Median Population Age in Woodbury is 41.2 Years.
What is the Average Family Size in Woodbury
Average Family Size in Woodbury is 3.8 People.
What is the Average Household Size in Woodbury
Average Household Size in Woodbury is 3.0 People.
How Large is the Labor Force in Woodbury?
There are 380 People in the Labor Forcein in Woodbury.
What is the Percentage of People in the Labor Force in Woodbury?
53.4% of People are in the Labor Force in Woodbury.