Ashburn, GA Map & Demographics
Ashburn Map
Ashburn Overview
$20,175
PER CAPITA INCOME
$40,238
AVG FAMILY INCOME
$35,987
AVG HOUSEHOLD INCOME
42.7%
WAGE / INCOME GAP [ % ]
57.3¢/ $1
WAGE / INCOME GAP [ $ ]
0.42
INEQUALITY / GINI INDEX
4,223
TOTAL POPULATION
2,021
MALE POPULATION
2,202
FEMALE POPULATION
91.78
MALES / 100 FEMALES
108.96
FEMALES / 100 MALES
39.9
MEDIAN AGE
3.6
AVG FAMILY SIZE
2.6
AVG HOUSEHOLD SIZE
1,610
LABOR FORCE [ PEOPLE ]
49.1%
PERCENT IN LABOR FORCE
10.8%
UNEMPLOYMENT RATE
Ashburn Zip Codes
Ashburn Area Codes
Income in Ashburn
Income Overview in Ashburn
Per Capita Income in Ashburn is $20,175, while median incomes of families and households are $40,238 and $35,987 respectively.
| Characteristic | Number | Measure |
| Per Capita Income | 4,223 | $20,175 |
| Median Family Income | 830 | $40,238 |
| Mean Family Income | 830 | $56,157 |
| Median Household Income | 1,589 | $35,987 |
| Mean Household Income | 1,589 | $49,101 |
| Income Deficit | 830 | $0 |
| Wage / Income Gap (%) | 4,223 | 42.74% |
| Wage / Income Gap ($) | 4,223 | 57.26¢ per $1 |
| Gini / Inequality Index | 4,223 | 0.42 |
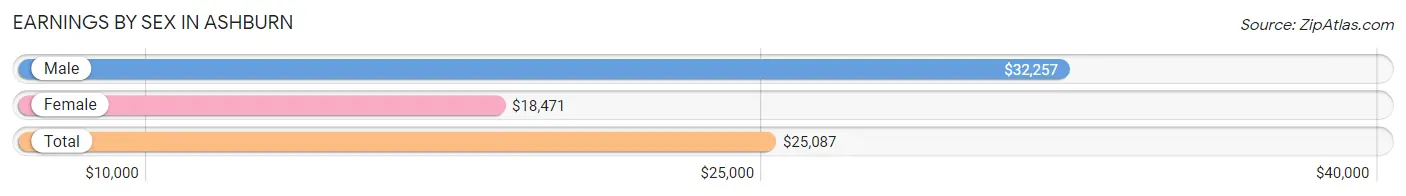
Earnings by Sex in Ashburn
Average Earnings in Ashburn are $25,087, $32,257 for men and $18,471 for women, a difference of 42.7%.
| Sex | Number | Average Earnings |
| Male | 997 (58.8%) | $32,257 |
| Female | 700 (41.2%) | $18,471 |
| Total | 1,697 (100.0%) | $25,087 |
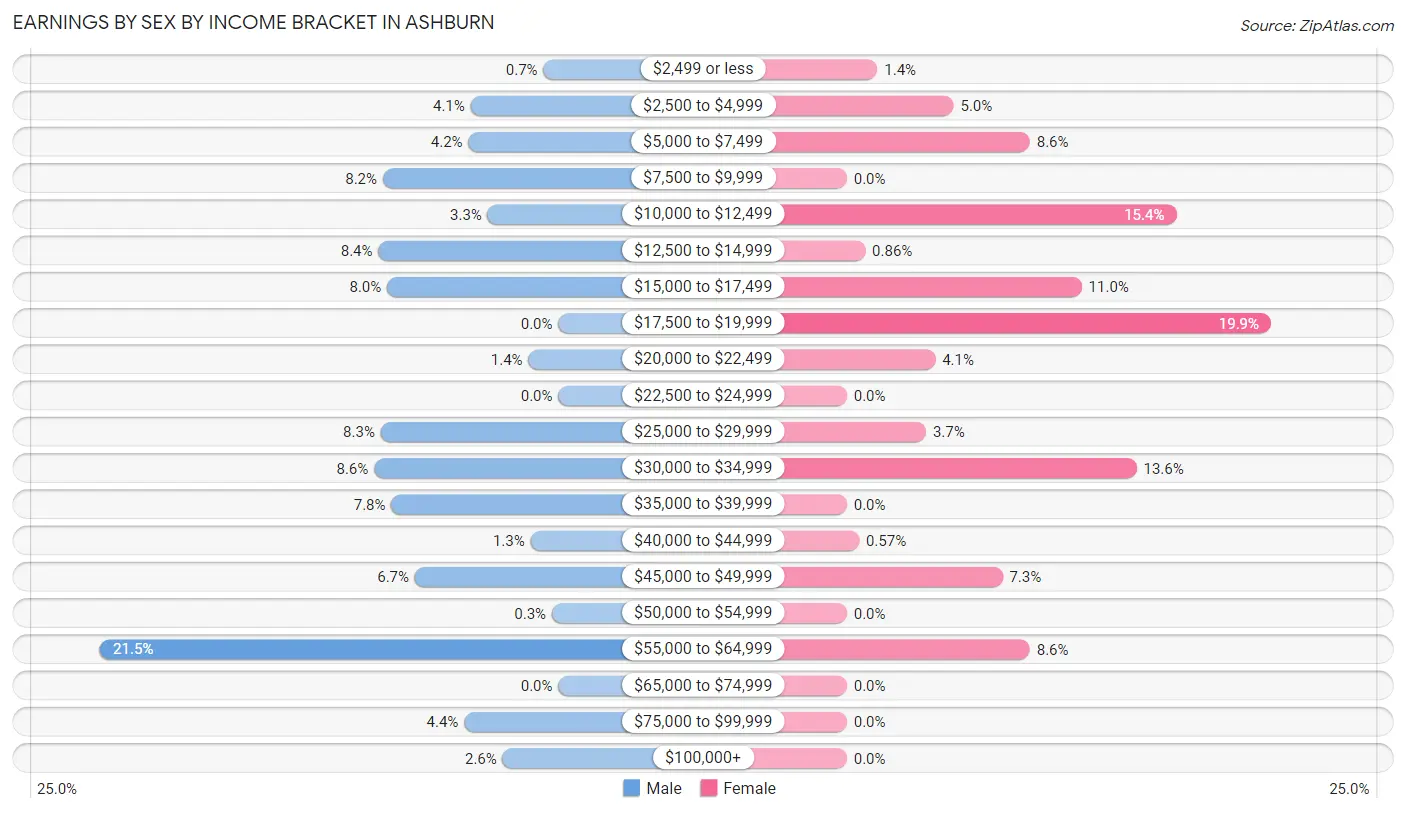
Earnings by Sex by Income Bracket in Ashburn
The most common earnings brackets in Ashburn are $55,000 to $64,999 for men (214 | 21.5%) and $17,500 to $19,999 for women (139 | 19.9%).
| Income | Male | Female |
| $2,499 or less | 7 (0.7%) | 10 (1.4%) |
| $2,500 to $4,999 | 41 (4.1%) | 35 (5.0%) |
| $5,000 to $7,499 | 42 (4.2%) | 60 (8.6%) |
| $7,500 to $9,999 | 82 (8.2%) | 0 (0.0%) |
| $10,000 to $12,499 | 33 (3.3%) | 108 (15.4%) |
| $12,500 to $14,999 | 84 (8.4%) | 6 (0.9%) |
| $15,000 to $17,499 | 80 (8.0%) | 77 (11.0%) |
| $17,500 to $19,999 | 0 (0.0%) | 139 (19.9%) |
| $20,000 to $22,499 | 14 (1.4%) | 29 (4.1%) |
| $22,500 to $24,999 | 0 (0.0%) | 0 (0.0%) |
| $25,000 to $29,999 | 83 (8.3%) | 26 (3.7%) |
| $30,000 to $34,999 | 86 (8.6%) | 95 (13.6%) |
| $35,000 to $39,999 | 78 (7.8%) | 0 (0.0%) |
| $40,000 to $44,999 | 13 (1.3%) | 4 (0.6%) |
| $45,000 to $49,999 | 67 (6.7%) | 51 (7.3%) |
| $50,000 to $54,999 | 3 (0.3%) | 0 (0.0%) |
| $55,000 to $64,999 | 214 (21.5%) | 60 (8.6%) |
| $65,000 to $74,999 | 0 (0.0%) | 0 (0.0%) |
| $75,000 to $99,999 | 44 (4.4%) | 0 (0.0%) |
| $100,000+ | 26 (2.6%) | 0 (0.0%) |
| Total | 997 (100.0%) | 700 (100.0%) |
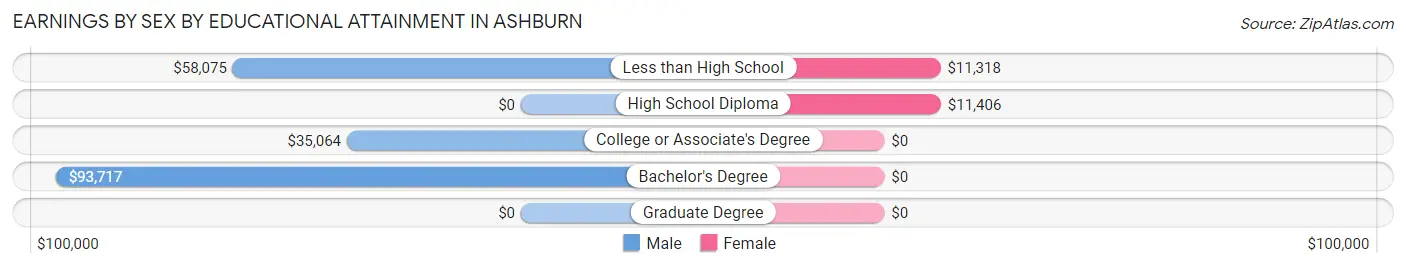
Earnings by Sex by Educational Attainment in Ashburn
Average earnings in Ashburn are $36,635 for men and $18,606 for women, a difference of 49.2%. Men with an educational attainment of bachelor's degree enjoy the highest average annual earnings of $93,717, while those with college or associate's degree education earn the least with $35,064. Women with an educational attainment of high school diploma earn the most with the average annual earnings of $11,406, while those with less than high school education have the smallest earnings of $11,318.
| Educational Attainment | Male Income | Female Income |
| Less than High School | $58,075 | $11,318 |
| High School Diploma | - | - |
| College or Associate's Degree | $35,064 | $0 |
| Bachelor's Degree | $93,717 | $0 |
| Graduate Degree | - | - |
| Total | $36,635 | $18,606 |
Family Income in Ashburn
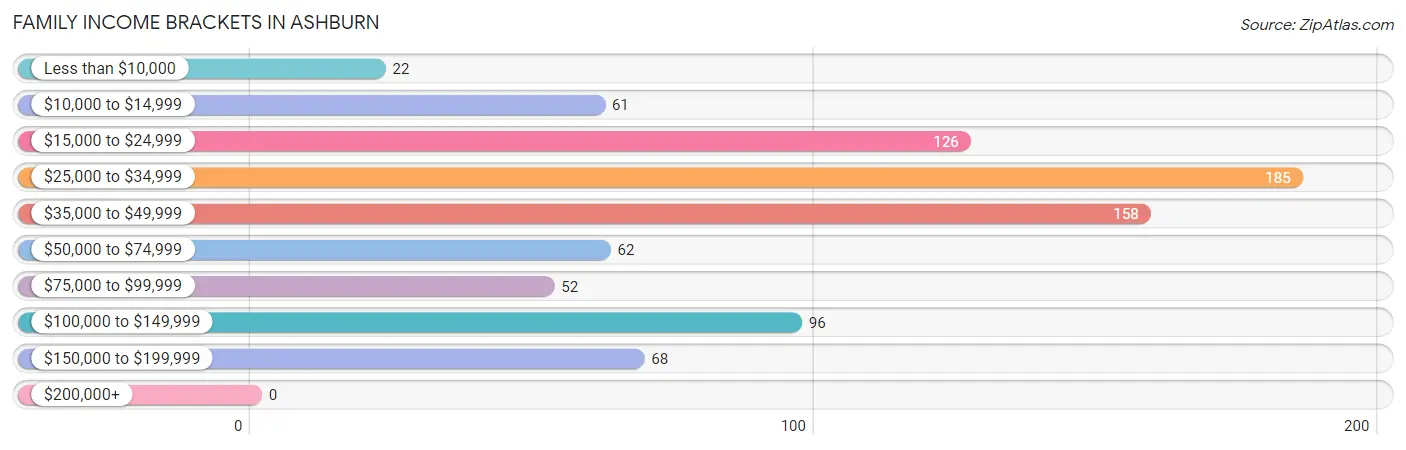
Family Income Brackets in Ashburn
According to the Ashburn family income data, there are 185 families falling into the $25,000 to $34,999 income range, which is the most common income bracket and makes up 22.3% of all families.
| Income Bracket | # Families | % Families |
| Less than $10,000 | 22 | 2.7% |
| $10,000 to $14,999 | 61 | 7.3% |
| $15,000 to $24,999 | 126 | 15.2% |
| $25,000 to $34,999 | 185 | 22.3% |
| $35,000 to $49,999 | 158 | 19.0% |
| $50,000 to $74,999 | 62 | 7.5% |
| $75,000 to $99,999 | 52 | 6.3% |
| $100,000 to $149,999 | 96 | 11.6% |
| $150,000 to $199,999 | 68 | 8.2% |
| $200,000+ | 0 | 0.0% |
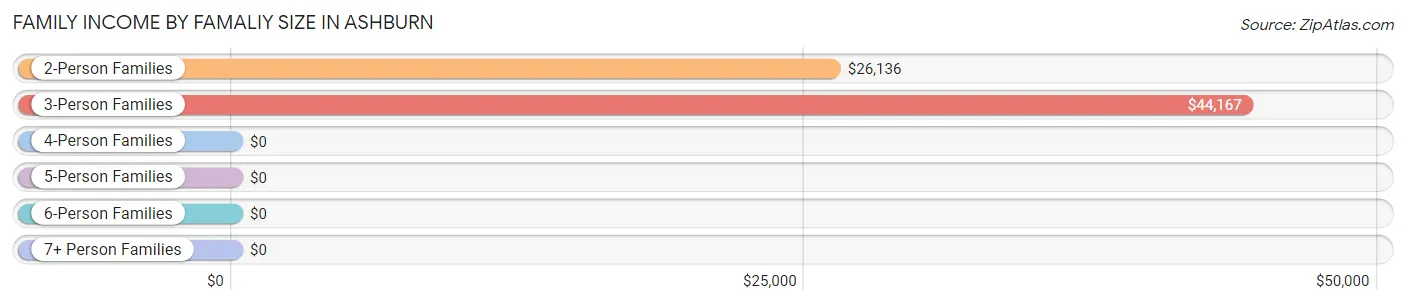
Family Income by Famaliy Size in Ashburn
3-person families (258 | 31.1%) account for the highest median family income in Ashburn with $44,167 per family, while 3-person families (258 | 31.1%) have the highest median income of $14,722 per family member.
| Income Bracket | # Families | Median Income |
| 2-Person Families | 344 (41.4%) | $26,136 |
| 3-Person Families | 258 (31.1%) | $44,167 |
| 4-Person Families | 153 (18.4%) | $0 |
| 5-Person Families | 46 (5.5%) | $0 |
| 6-Person Families | 29 (3.5%) | $0 |
| 7+ Person Families | 0 (0.0%) | $0 |
| Total | 830 (100.0%) | $40,238 |
Family Income by Number of Earners in Ashburn
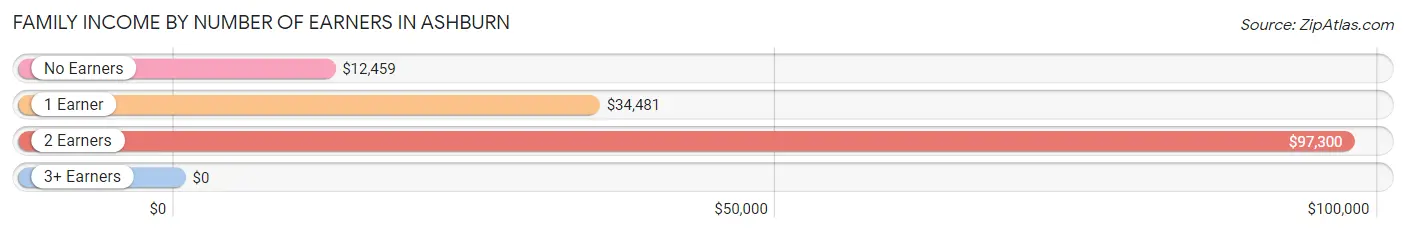
| Number of Earners | # Families | Median Income |
| No Earners | 144 (17.3%) | $12,459 |
| 1 Earner | 469 (56.5%) | $34,481 |
| 2 Earners | 156 (18.8%) | $97,300 |
| 3+ Earners | 61 (7.3%) | $0 |
| Total | 830 (100.0%) | $40,238 |
Household Income in Ashburn
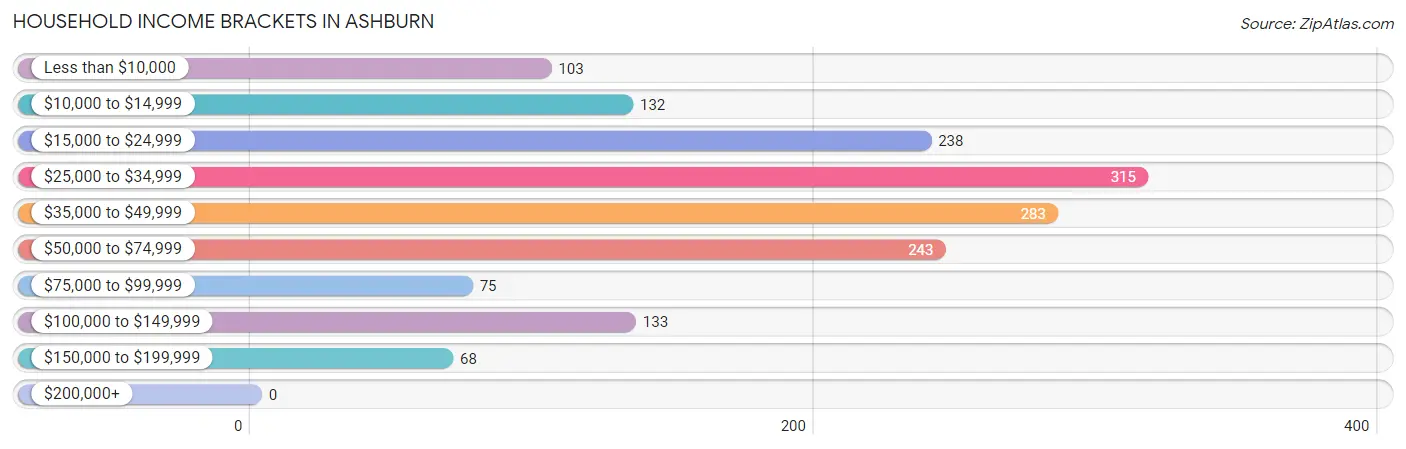
Household Income Brackets in Ashburn
With 315 households falling in the category, the $25,000 to $34,999 income range is the most frequent in Ashburn, accounting for 19.8% of all households.
| Income Bracket | # Households | % Households |
| Less than $10,000 | 103 | 6.5% |
| $10,000 to $14,999 | 132 | 8.3% |
| $15,000 to $24,999 | 238 | 15.0% |
| $25,000 to $34,999 | 315 | 19.8% |
| $35,000 to $49,999 | 283 | 17.8% |
| $50,000 to $74,999 | 243 | 15.3% |
| $75,000 to $99,999 | 75 | 4.7% |
| $100,000 to $149,999 | 133 | 8.4% |
| $150,000 to $199,999 | 68 | 4.3% |
| $200,000+ | 0 | 0.0% |
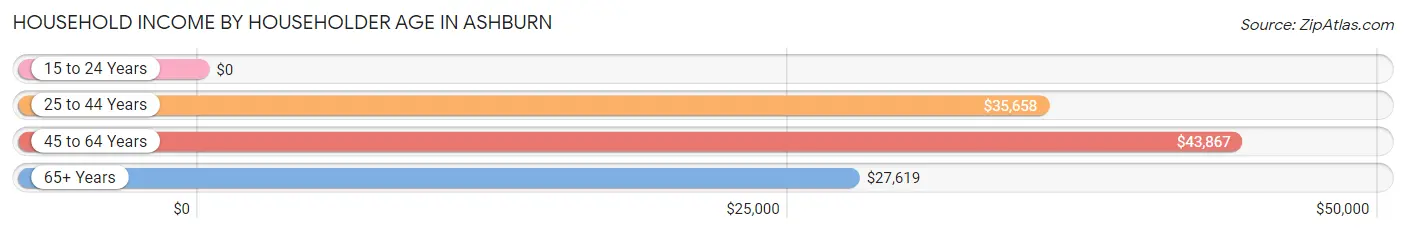
Household Income by Householder Age in Ashburn
The median household income in Ashburn is $35,987, with the highest median household income of $43,867 found in the 45 to 64 years age bracket for the primary householder. A total of 671 households (42.2%) fall into this category.
| Income Bracket | # Households | Median Income |
| 15 to 24 Years | 0 (0.0%) | $0 |
| 25 to 44 Years | 390 (24.5%) | $35,658 |
| 45 to 64 Years | 671 (42.2%) | $43,867 |
| 65+ Years | 528 (33.2%) | $27,619 |
| Total | 1,589 (100.0%) | $35,987 |
Poverty in Ashburn
Income Below Poverty by Sex and Age in Ashburn
With 14.9% poverty level for males and 35.2% for females among the residents of Ashburn, 12 to 14 year old males and 18 to 24 year old females are the most vulnerable to poverty, with 49 males (47.6%) and 42 females (73.7%) in their respective age groups living below the poverty level.
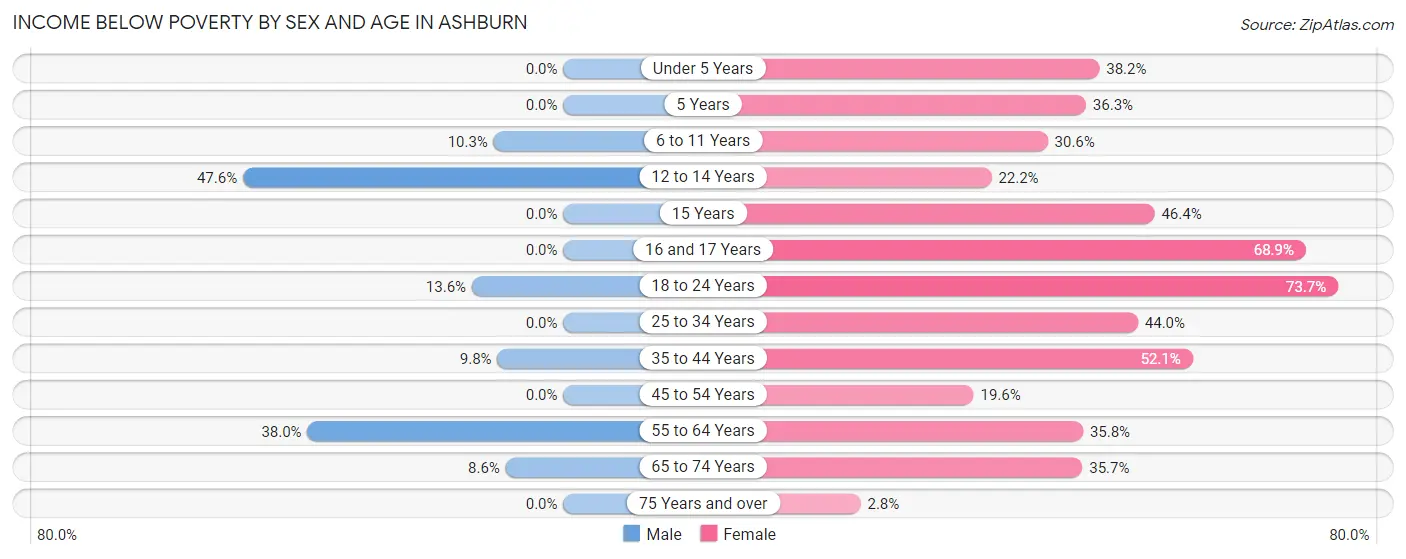
| Age Bracket | Male | Female |
| Under 5 Years | 0 (0.0%) | 39 (38.2%) |
| 5 Years | 0 (0.0%) | 29 (36.2%) |
| 6 to 11 Years | 12 (10.3%) | 55 (30.6%) |
| 12 to 14 Years | 49 (47.6%) | 14 (22.2%) |
| 15 Years | 0 (0.0%) | 13 (46.4%) |
| 16 and 17 Years | 0 (0.0%) | 31 (68.9%) |
| 18 to 24 Years | 33 (13.6%) | 42 (73.7%) |
| 25 to 34 Years | 0 (0.0%) | 171 (44.0%) |
| 35 to 44 Years | 19 (9.8%) | 62 (52.1%) |
| 45 to 54 Years | 0 (0.0%) | 64 (19.6%) |
| 55 to 64 Years | 163 (38.0%) | 82 (35.8%) |
| 65 to 74 Years | 18 (8.6%) | 140 (35.7%) |
| 75 Years and over | 0 (0.0%) | 3 (2.8%) |
| Total | 294 (14.9%) | 745 (35.2%) |
Income Above Poverty by Sex and Age in Ashburn
According to the poverty statistics in Ashburn, males aged under 5 years and females aged 75 years and over are the age groups that are most secure financially, with 100.0% of males and 97.2% of females in these age groups living above the poverty line.
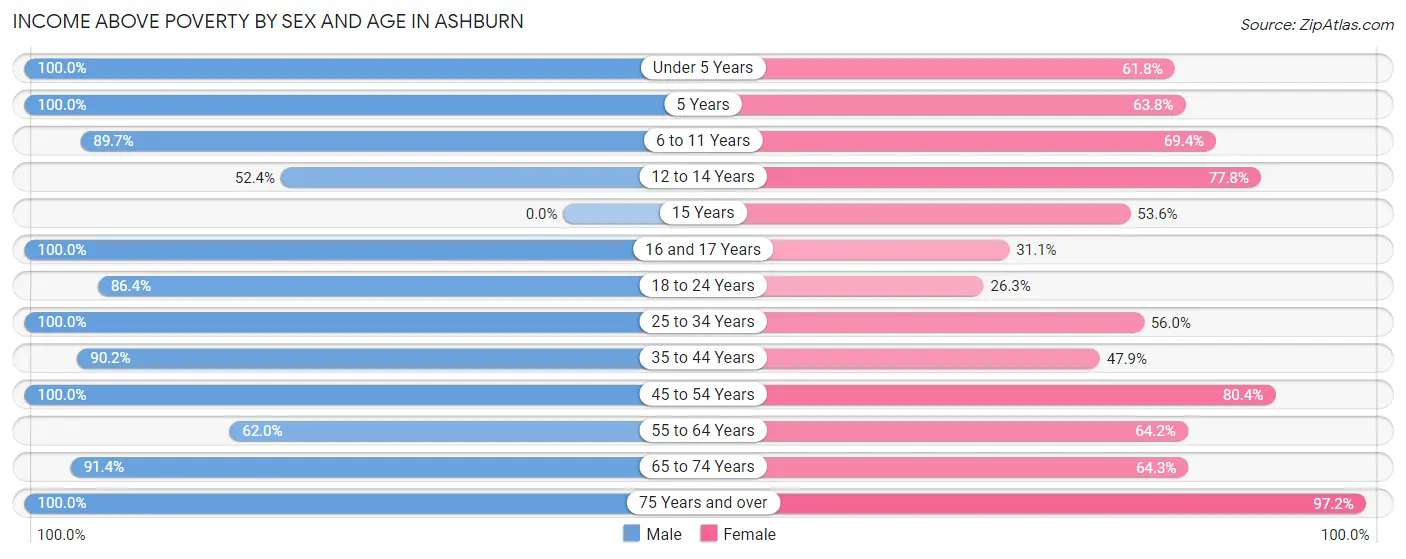
| Age Bracket | Male | Female |
| Under 5 Years | 167 (100.0%) | 63 (61.8%) |
| 5 Years | 28 (100.0%) | 51 (63.7%) |
| 6 to 11 Years | 104 (89.7%) | 125 (69.4%) |
| 12 to 14 Years | 54 (52.4%) | 49 (77.8%) |
| 15 Years | 0 (0.0%) | 15 (53.6%) |
| 16 and 17 Years | 74 (100.0%) | 14 (31.1%) |
| 18 to 24 Years | 210 (86.4%) | 15 (26.3%) |
| 25 to 34 Years | 201 (100.0%) | 218 (56.0%) |
| 35 to 44 Years | 175 (90.2%) | 57 (47.9%) |
| 45 to 54 Years | 102 (100.0%) | 263 (80.4%) |
| 55 to 64 Years | 266 (62.0%) | 147 (64.2%) |
| 65 to 74 Years | 192 (91.4%) | 252 (64.3%) |
| 75 Years and over | 99 (100.0%) | 105 (97.2%) |
| Total | 1,672 (85.1%) | 1,374 (64.8%) |
Income Below Poverty Among Married-Couple Families in Ashburn
The poverty statistics for married-couple families in Ashburn show that 19.5% or 76 of the total 389 families live below the poverty line. Families with no children have the highest poverty rate of 21.5%, comprising of 76 families. On the other hand, families with 1 or 2 children have the lowest poverty rate of 0.0%, which includes 0 families.
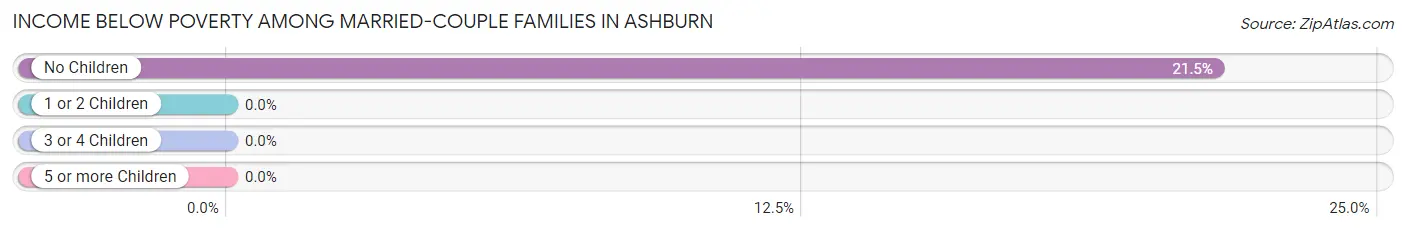
| Children | Above Poverty | Below Poverty |
| No Children | 278 (78.5%) | 76 (21.5%) |
| 1 or 2 Children | 35 (100.0%) | 0 (0.0%) |
| 3 or 4 Children | 0 (0.0%) | 0 (0.0%) |
| 5 or more Children | 0 (0.0%) | 0 (0.0%) |
| Total | 313 (80.5%) | 76 (19.5%) |
Income Below Poverty Among Single-Parent Households in Ashburn
According to the poverty data in Ashburn, 11.3% or 14 single-father households and 27.4% or 87 single-mother households are living below the poverty line. Among single-father households, those with 3 or 4 children have the highest poverty rate, with 14 households (45.2%) experiencing poverty. Likewise, among single-mother households, those with 5 or more children have the highest poverty rate, with 12 households (100.0%) falling below the poverty line.
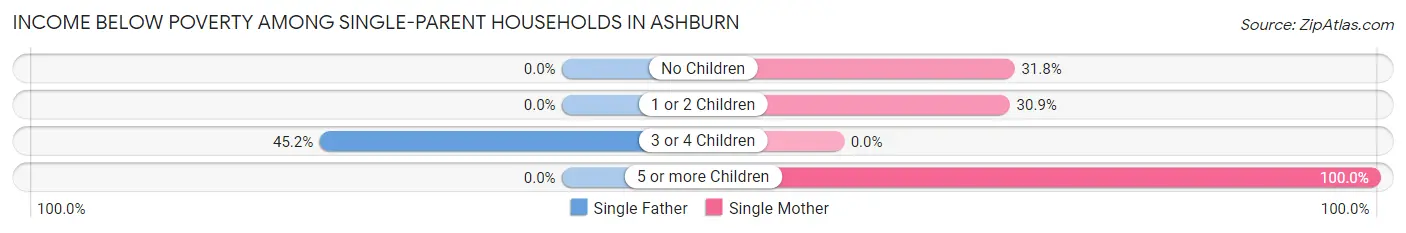
| Children | Single Father | Single Mother |
| No Children | 0 (0.0%) | 28 (31.8%) |
| 1 or 2 Children | 0 (0.0%) | 47 (30.9%) |
| 3 or 4 Children | 14 (45.2%) | 0 (0.0%) |
| 5 or more Children | 0 (0.0%) | 12 (100.0%) |
| Total | 14 (11.3%) | 87 (27.4%) |
Income Below Poverty Among Married-Couple vs Single-Parent Households in Ashburn
The poverty data for Ashburn shows that 76 of the married-couple family households (19.5%) and 101 of the single-parent households (22.9%) are living below the poverty level. Within the married-couple family households, those with no children have the highest poverty rate, with 76 households (21.5%) falling below the poverty line. Among the single-parent households, those with 5 or more children have the highest poverty rate, with 12 household (100.0%) living below poverty.
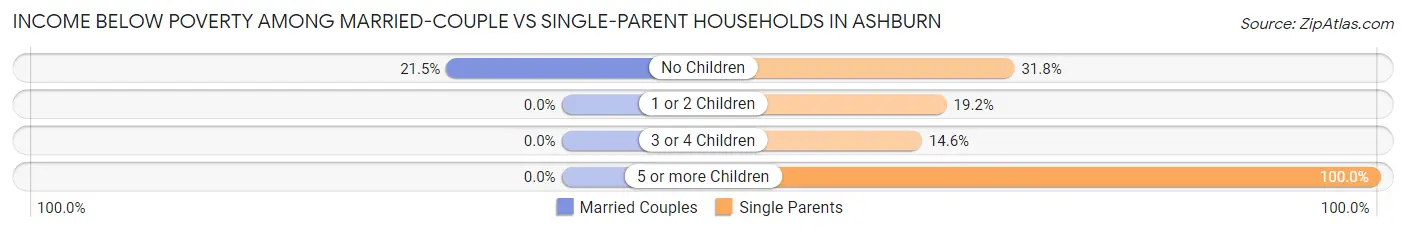
| Children | Married-Couple Families | Single-Parent Households |
| No Children | 76 (21.5%) | 28 (31.8%) |
| 1 or 2 Children | 0 (0.0%) | 47 (19.2%) |
| 3 or 4 Children | 0 (0.0%) | 14 (14.6%) |
| 5 or more Children | 0 (0.0%) | 12 (100.0%) |
| Total | 76 (19.5%) | 101 (22.9%) |
Race in Ashburn
The most populous races in Ashburn are Black / African American (2,976 | 70.5%), White / Caucasian (1,168 | 27.7%), and Hispanic or Latino (192 | 4.5%).
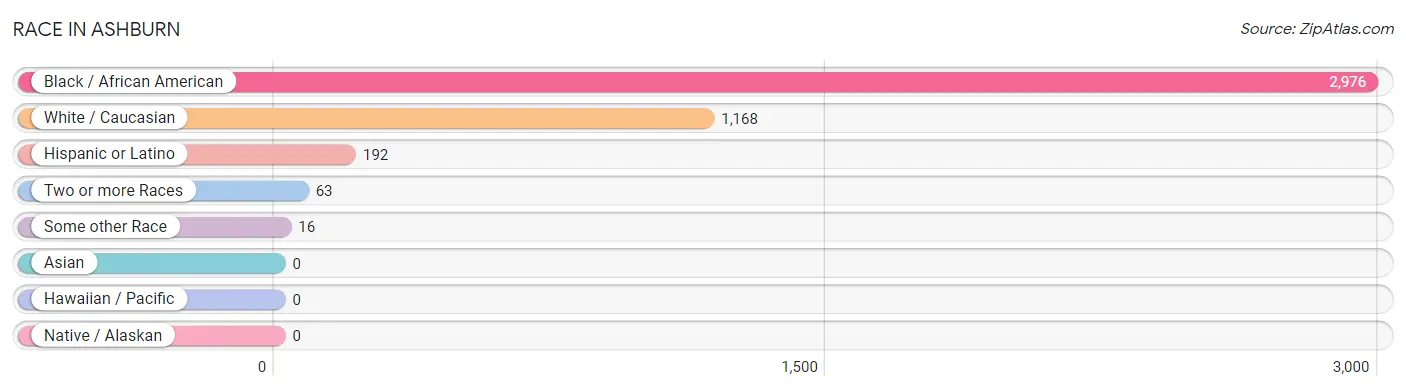
| Race | # Population | % Population |
| Asian | 0 | 0.0% |
| Black / African American | 2,976 | 70.5% |
| Hawaiian / Pacific | 0 | 0.0% |
| Hispanic or Latino | 192 | 4.5% |
| Native / Alaskan | 0 | 0.0% |
| White / Caucasian | 1,168 | 27.7% |
| Two or more Races | 63 | 1.5% |
| Some other Race | 16 | 0.4% |
| Total | 4,223 | 100.0% |
Ancestry in Ashburn
The most populous ancestries reported in Ashburn are American (265 | 6.3%), Central American (176 | 4.2%), Honduran (176 | 4.2%), English (111 | 2.6%), and Scottish (91 | 2.1%), together accounting for 19.4% of all Ashburn residents.
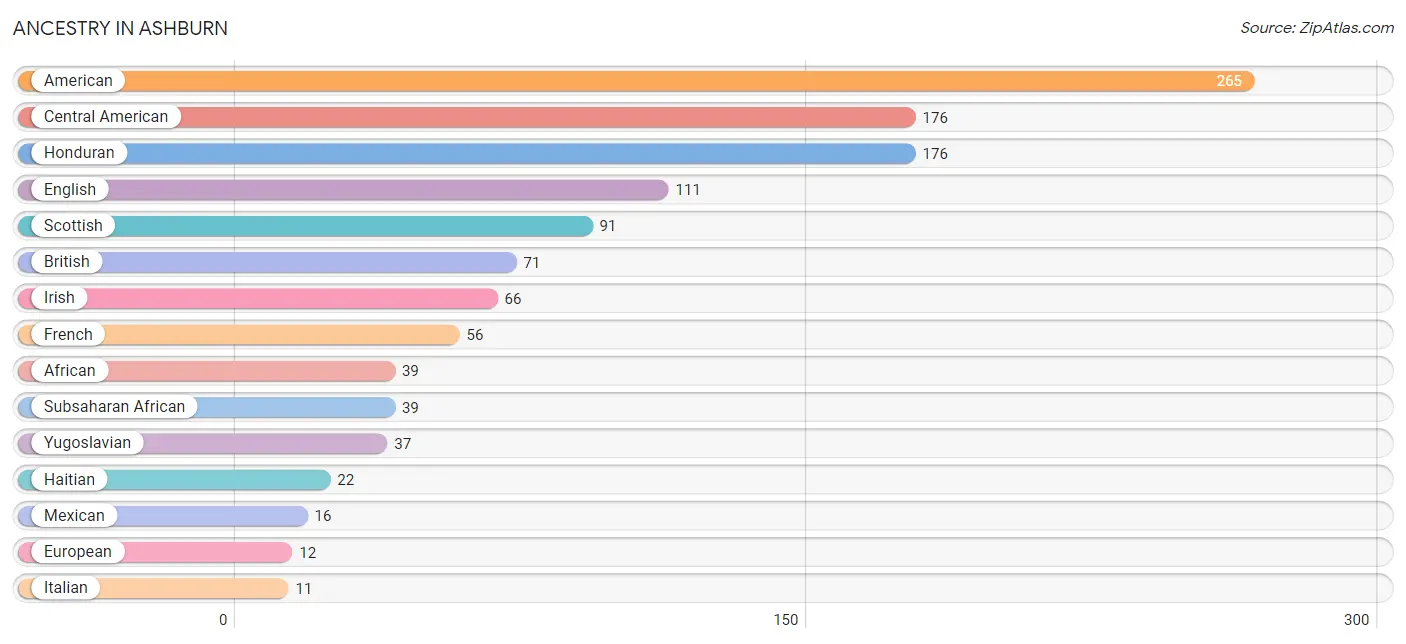
| Ancestry | # Population | % Population |
| African | 39 | 0.9% |
| American | 265 | 6.3% |
| British | 71 | 1.7% |
| Central American | 176 | 4.2% |
| Dutch | 1 | 0.0% |
| English | 111 | 2.6% |
| European | 12 | 0.3% |
| French | 56 | 1.3% |
| German | 6 | 0.1% |
| Haitian | 22 | 0.5% |
| Honduran | 176 | 4.2% |
| Irish | 66 | 1.6% |
| Italian | 11 | 0.3% |
| Mexican | 16 | 0.4% |
| Scottish | 91 | 2.1% |
| Subsaharan African | 39 | 0.9% |
| Yugoslavian | 37 | 0.9% | View All 17 Rows |
Immigrants in Ashburn
The most numerous immigrant groups reported in Ashburn came from Latin America (237 | 5.6%), Central America (176 | 4.2%), Honduras (176 | 4.2%), Caribbean (61 | 1.4%), and Haiti (61 | 1.4%), together accounting for 16.8% of all Ashburn residents.
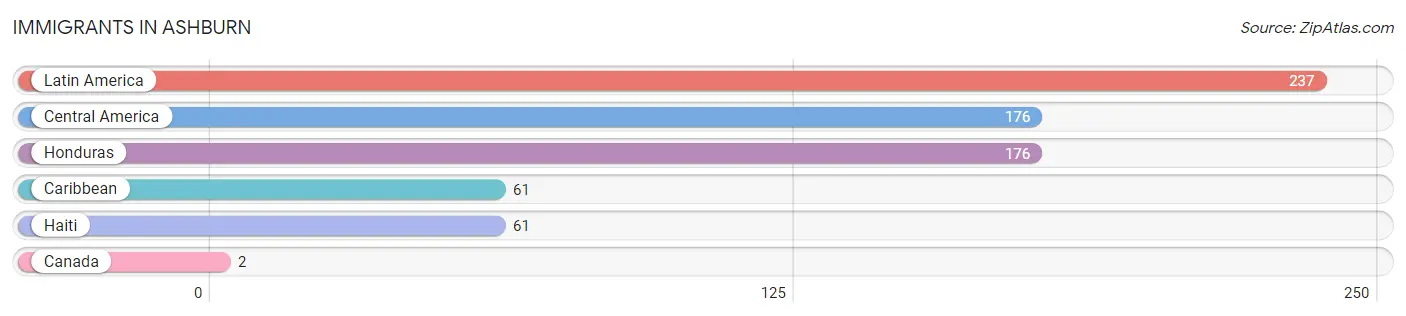
| Immigration Origin | # Population | % Population |
| Canada | 2 | 0.1% |
| Caribbean | 61 | 1.4% |
| Central America | 176 | 4.2% |
| Haiti | 61 | 1.4% |
| Honduras | 176 | 4.2% |
| Latin America | 237 | 5.6% | View All 6 Rows |
Sex and Age in Ashburn
Sex and Age in Ashburn
The most populous age groups in Ashburn are 60 to 64 Years (293 | 14.5%) for men and 10 to 14 Years (296 | 13.4%) for women.
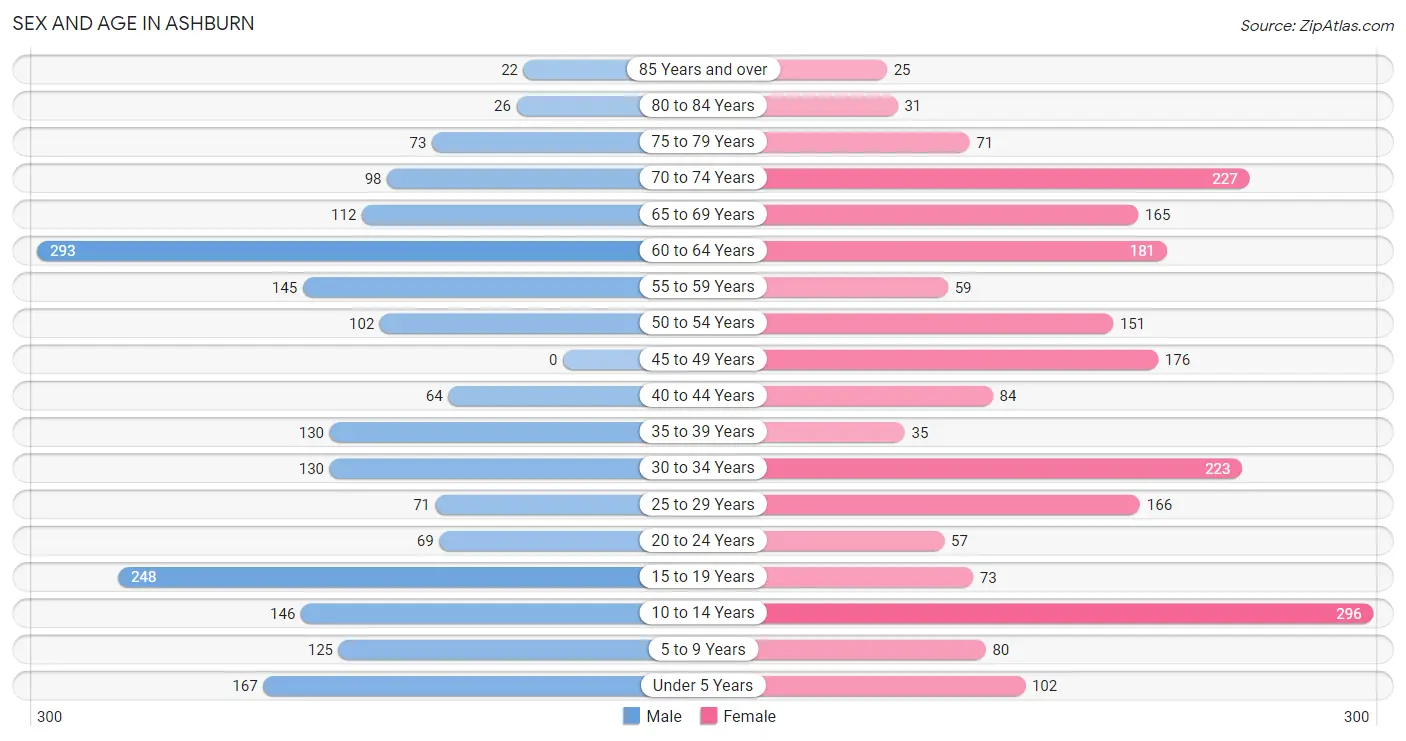
| Age Bracket | Male | Female |
| Under 5 Years | 167 (8.3%) | 102 (4.6%) |
| 5 to 9 Years | 125 (6.2%) | 80 (3.6%) |
| 10 to 14 Years | 146 (7.2%) | 296 (13.4%) |
| 15 to 19 Years | 248 (12.3%) | 73 (3.3%) |
| 20 to 24 Years | 69 (3.4%) | 57 (2.6%) |
| 25 to 29 Years | 71 (3.5%) | 166 (7.5%) |
| 30 to 34 Years | 130 (6.4%) | 223 (10.1%) |
| 35 to 39 Years | 130 (6.4%) | 35 (1.6%) |
| 40 to 44 Years | 64 (3.2%) | 84 (3.8%) |
| 45 to 49 Years | 0 (0.0%) | 176 (8.0%) |
| 50 to 54 Years | 102 (5.1%) | 151 (6.9%) |
| 55 to 59 Years | 145 (7.2%) | 59 (2.7%) |
| 60 to 64 Years | 293 (14.5%) | 181 (8.2%) |
| 65 to 69 Years | 112 (5.5%) | 165 (7.5%) |
| 70 to 74 Years | 98 (4.9%) | 227 (10.3%) |
| 75 to 79 Years | 73 (3.6%) | 71 (3.2%) |
| 80 to 84 Years | 26 (1.3%) | 31 (1.4%) |
| 85 Years and over | 22 (1.1%) | 25 (1.1%) |
| Total | 2,021 (100.0%) | 2,202 (100.0%) |
Families and Households in Ashburn
Median Family Size in Ashburn
The median family size in Ashburn is 3.63 persons per family, with single male/father families (124 | 14.9%) accounting for the largest median family size of 5.12 persons per family. On the other hand, married-couple families (389 | 46.9%) represent the smallest median family size with 2.77 persons per family.
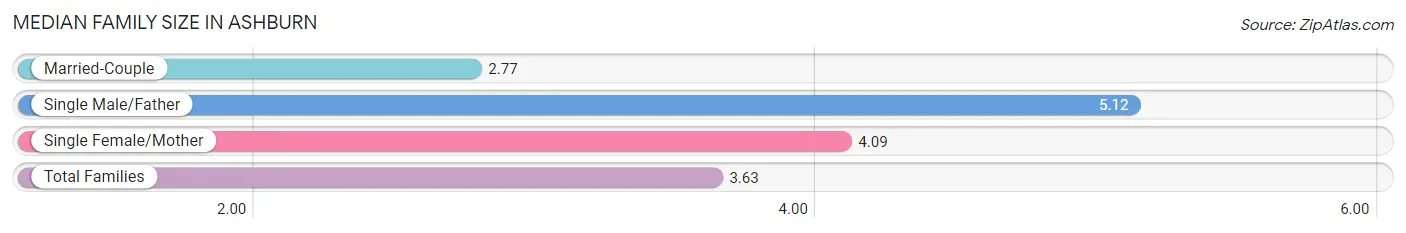
| Family Type | # Families | Family Size |
| Married-Couple | 389 (46.9%) | 2.77 |
| Single Male/Father | 124 (14.9%) | 5.12 |
| Single Female/Mother | 317 (38.2%) | 4.09 |
| Total Families | 830 (100.0%) | 3.63 |
Median Household Size in Ashburn
The median household size in Ashburn is 2.62 persons per household, with single male/father households (124 | 7.8%) accounting for the largest median household size of 5.73 persons per household. non-family households (759 | 47.8%) represent the smallest median household size with 1.12 persons per household.
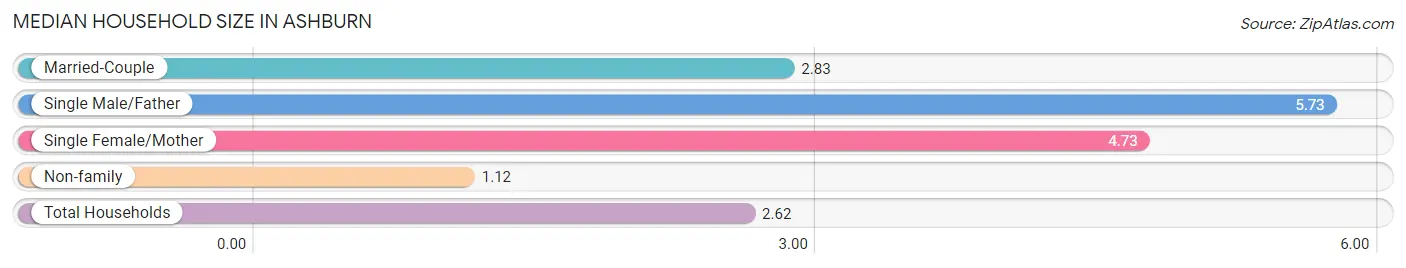
| Household Type | # Households | Household Size |
| Married-Couple | 389 (24.5%) | 2.83 |
| Single Male/Father | 124 (7.8%) | 5.73 |
| Single Female/Mother | 317 (20.0%) | 4.73 |
| Non-family | 759 (47.8%) | 1.12 |
| Total Households | 1,589 (100.0%) | 2.62 |
Household Size by Marriage Status in Ashburn
Out of a total of 1,589 households in Ashburn, 830 (52.2%) are family households, while 759 (47.8%) are nonfamily households. The most numerous type of family households are 2-person households, comprising 307, and the most common type of nonfamily households are 1-person households, comprising 663.
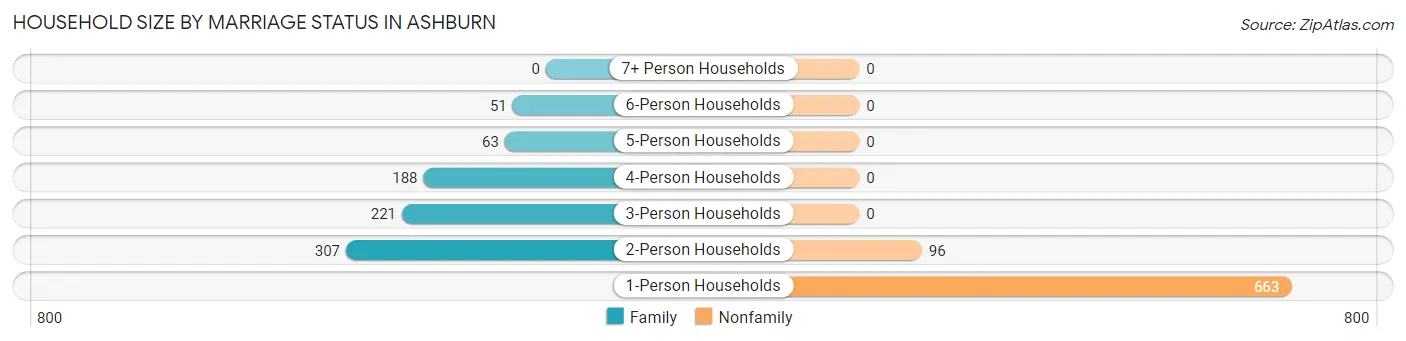
| Household Size | Family Households | Nonfamily Households |
| 1-Person Households | - | 663 (41.7%) |
| 2-Person Households | 307 (19.3%) | 96 (6.0%) |
| 3-Person Households | 221 (13.9%) | 0 (0.0%) |
| 4-Person Households | 188 (11.8%) | 0 (0.0%) |
| 5-Person Households | 63 (4.0%) | 0 (0.0%) |
| 6-Person Households | 51 (3.2%) | 0 (0.0%) |
| 7+ Person Households | 0 (0.0%) | 0 (0.0%) |
| Total | 830 (52.2%) | 759 (47.8%) |
Female Fertility in Ashburn
Fertility by Age in Ashburn
Average fertility rate in Ashburn is 46.0 births per 1,000 women. Women in the age bracket of 20 to 34 years have the highest fertility rate with 90.0 births per 1,000 women. Women in the age bracket of 20 to 34 years acount for 100.0% of all women with births.
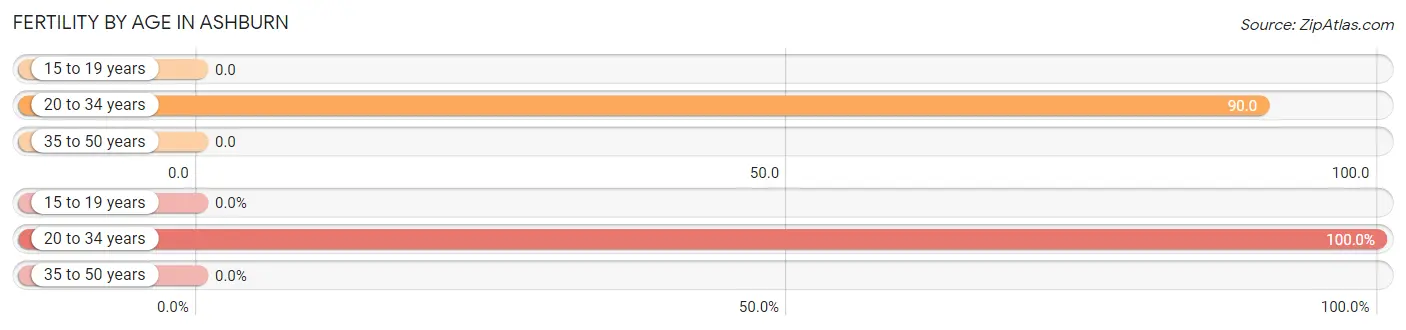
| Age Bracket | Women with Births | Births / 1,000 Women |
| 15 to 19 years | 0 (0.0%) | 0.0 |
| 20 to 34 years | 40 (100.0%) | 90.0 |
| 35 to 50 years | 0 (0.0%) | 0.0 |
| Total | 40 (100.0%) | 46.0 |
Fertility by Age by Marriage Status in Ashburn
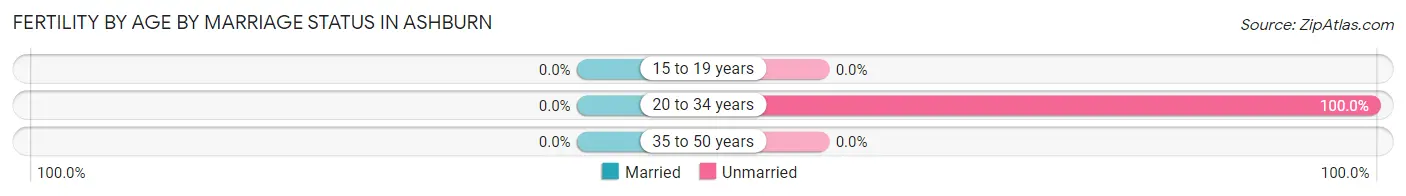
| Age Bracket | Married | Unmarried |
| 15 to 19 years | 0 (0.0%) | 0 (0.0%) |
| 20 to 34 years | 0 (0.0%) | 40 (100.0%) |
| 35 to 50 years | 0 (0.0%) | 0 (0.0%) |
| Total | 0 (0.0%) | 40 (100.0%) |
Fertility by Education in Ashburn
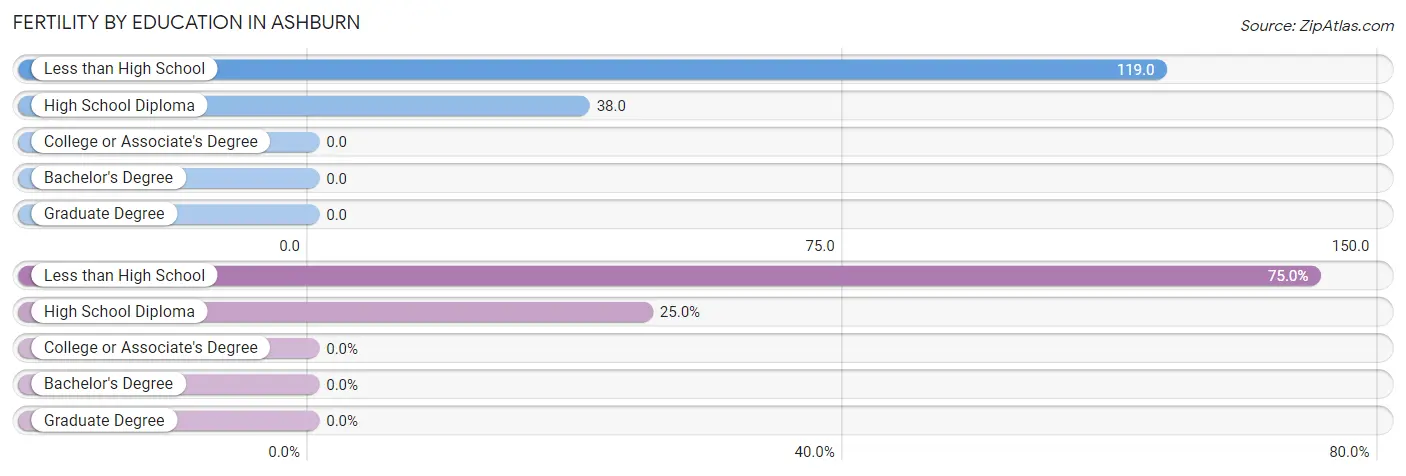
| Educational Attainment | Women with Births | Births / 1,000 Women |
| Less than High School | 30 (75.0%) | 119.0 |
| High School Diploma | 10 (25.0%) | 38.0 |
| College or Associate's Degree | 0 (0.0%) | 0.0 |
| Bachelor's Degree | 0 (0.0%) | 0.0 |
| Graduate Degree | 0 (0.0%) | 0.0 |
| Total | 40 (100.0%) | 46.0 |
Fertility by Education by Marriage Status in Ashburn
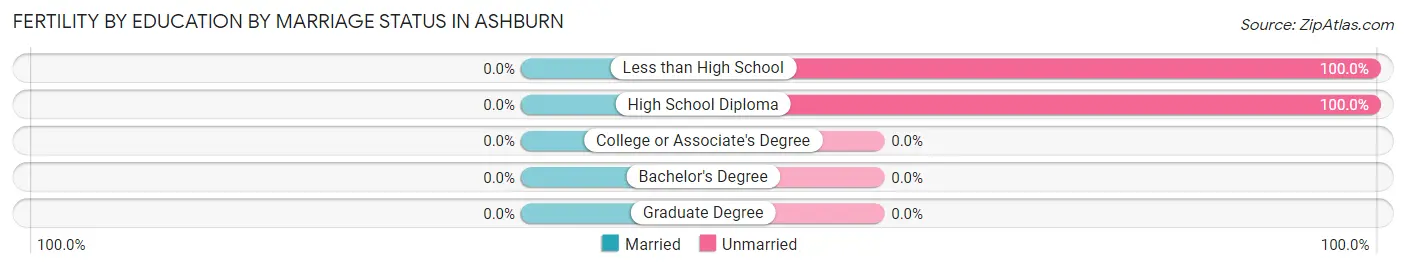
| Educational Attainment | Married | Unmarried |
| Less than High School | 0 (0.0%) | 30 (100.0%) |
| High School Diploma | 0 (0.0%) | 10 (100.0%) |
| College or Associate's Degree | 0 (0.0%) | 0 (0.0%) |
| Bachelor's Degree | 0 (0.0%) | 0 (0.0%) |
| Graduate Degree | 0 (0.0%) | 0 (0.0%) |
| Total | 0 (0.0%) | 40 (100.0%) |
Employment Characteristics in Ashburn
Employment by Class of Employer in Ashburn
Among the 1,400 employed individuals in Ashburn, private company employees (935 | 66.8%), local government employees (169 | 12.1%), and state government employees (85 | 6.1%) make up the most common classes of employment.
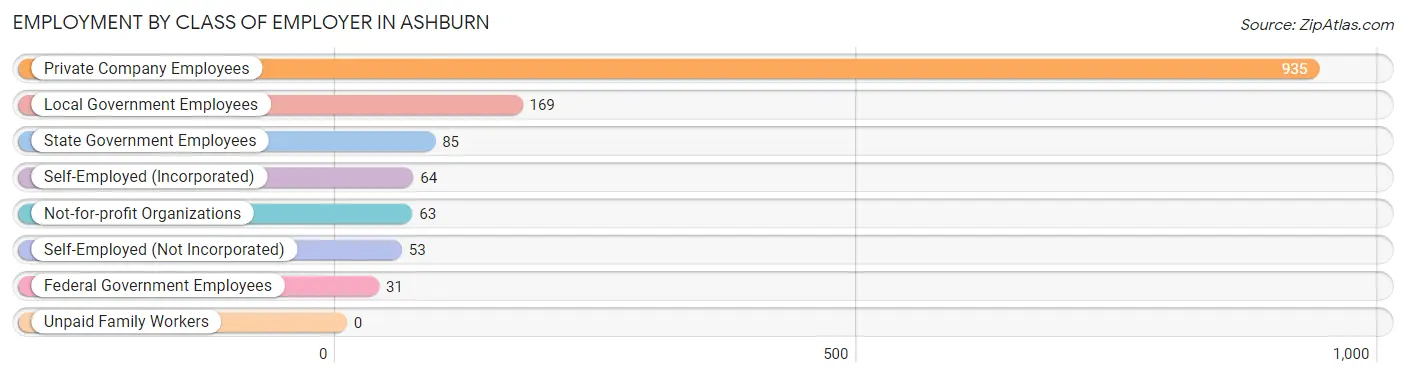
| Employer Class | # Employees | % Employees |
| Private Company Employees | 935 | 66.8% |
| Self-Employed (Incorporated) | 64 | 4.6% |
| Self-Employed (Not Incorporated) | 53 | 3.8% |
| Not-for-profit Organizations | 63 | 4.5% |
| Local Government Employees | 169 | 12.1% |
| State Government Employees | 85 | 6.1% |
| Federal Government Employees | 31 | 2.2% |
| Unpaid Family Workers | 0 | 0.0% |
| Total | 1,400 | 100.0% |
Employment Status by Age in Ashburn
According to the labor force statistics for Ashburn, out of the total population over 16 years of age (3,279), 49.1% or 1,610 individuals are in the labor force, with 10.8% or 174 of them unemployed. The age group with the highest labor force participation rate is 25 to 29 years, with 100.0% or 237 individuals in the labor force. Within the labor force, the 45 to 54 years age range has the highest percentage of unemployed individuals, with 31.8% or 110 of them being unemployed.
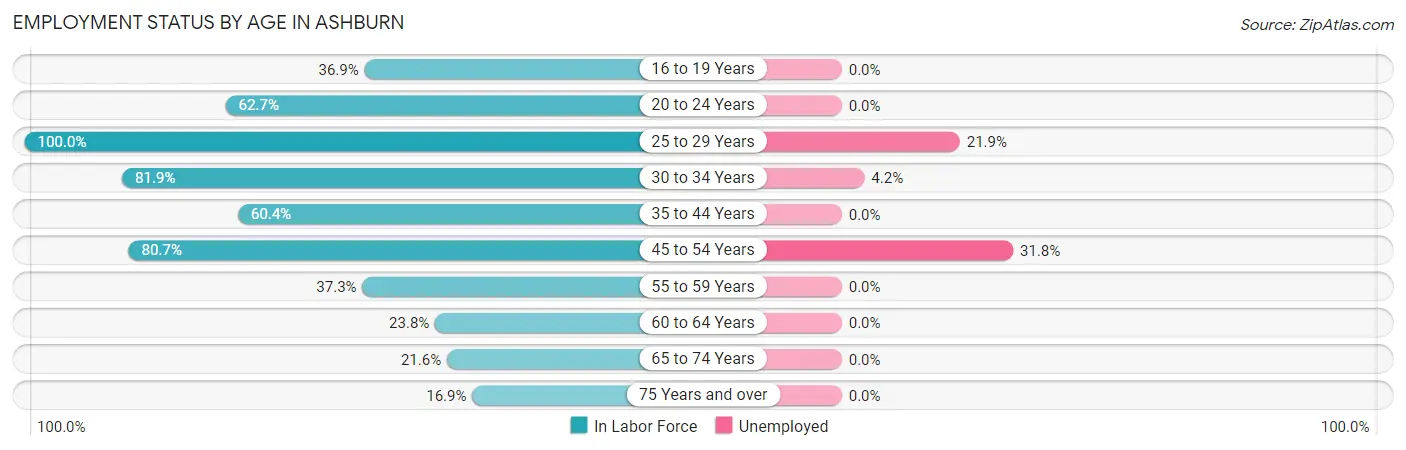
| Age Bracket | In Labor Force | Unemployed |
| 16 to 19 Years | 108 (36.9%) | 0 (0.0%) |
| 20 to 24 Years | 79 (62.7%) | 0 (0.0%) |
| 25 to 29 Years | 237 (100.0%) | 52 (21.9%) |
| 30 to 34 Years | 289 (81.9%) | 12 (4.2%) |
| 35 to 44 Years | 189 (60.4%) | 0 (0.0%) |
| 45 to 54 Years | 346 (80.7%) | 110 (31.8%) |
| 55 to 59 Years | 76 (37.3%) | 0 (0.0%) |
| 60 to 64 Years | 113 (23.8%) | 0 (0.0%) |
| 65 to 74 Years | 130 (21.6%) | 0 (0.0%) |
| 75 Years and over | 42 (16.9%) | 0 (0.0%) |
| Total | 1,610 (49.1%) | 174 (10.8%) |
Employment Status by Educational Attainment in Ashburn
According to labor force statistics for Ashburn, 62.2% of individuals (1,250) out of the total population between 25 and 64 years of age (2,010) are in the labor force, with 13.9% or 174 of them being unemployed. The group with the highest labor force participation rate are those with the educational attainment of college / associate degree, with 76.4% or 450 individuals in the labor force. Within the labor force, individuals with less than high school education have the highest percentage of unemployment, with 21.6% or 64 of them being unemployed.
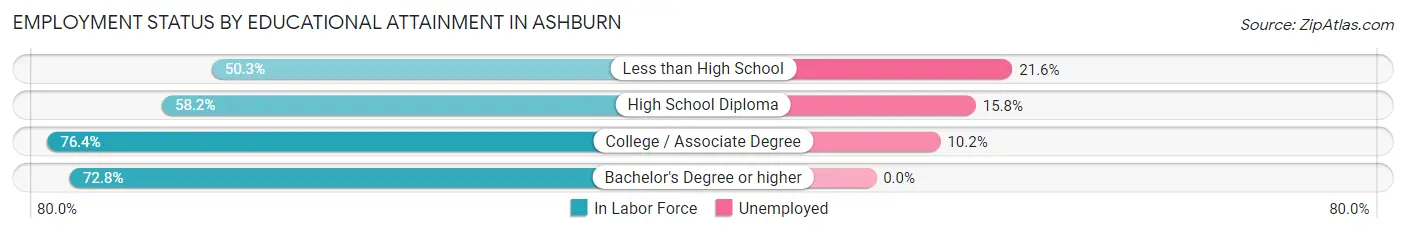
| Educational Attainment | In Labor Force | Unemployed |
| Less than High School | 296 (50.3%) | 127 (21.6%) |
| High School Diploma | 405 (58.2%) | 110 (15.8%) |
| College / Associate Degree | 450 (76.4%) | 60 (10.2%) |
| Bachelor's Degree or higher | 99 (72.8%) | 0 (0.0%) |
| Total | 1,250 (62.2%) | 279 (13.9%) |
Employment Occupations by Sex in Ashburn
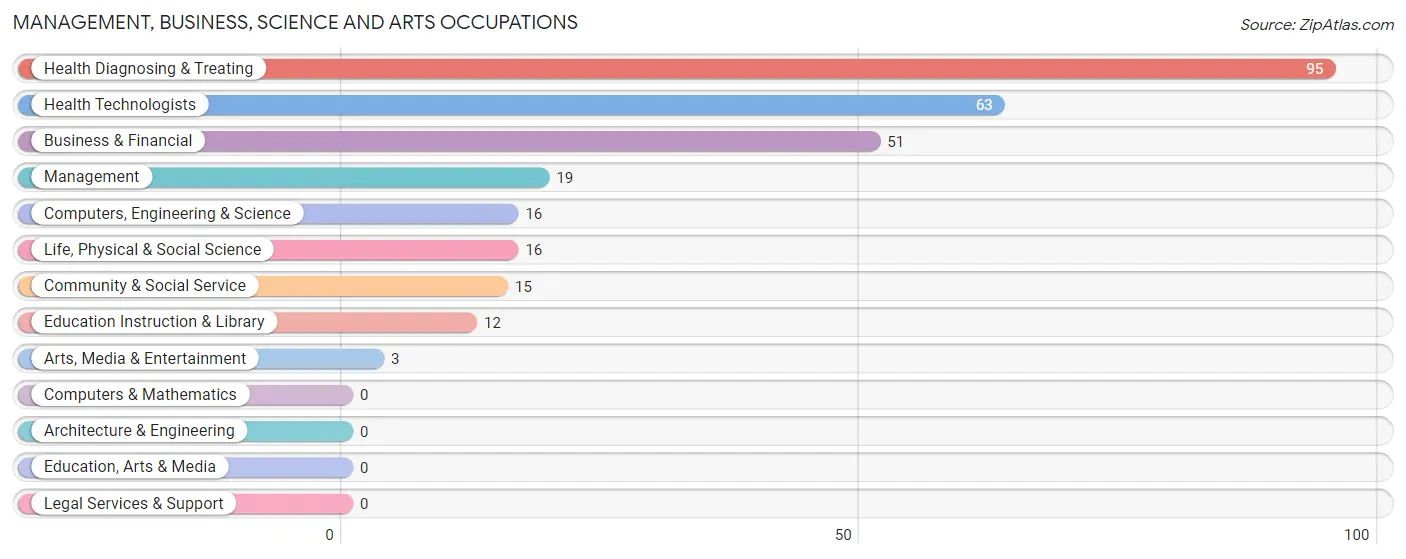
Management, Business, Science and Arts Occupations
The most common Management, Business, Science and Arts occupations in Ashburn are Health Diagnosing & Treating (95 | 6.6%), Health Technologists (63 | 4.4%), Business & Financial (51 | 3.5%), Management (19 | 1.3%), and Computers, Engineering & Science (16 | 1.1%).
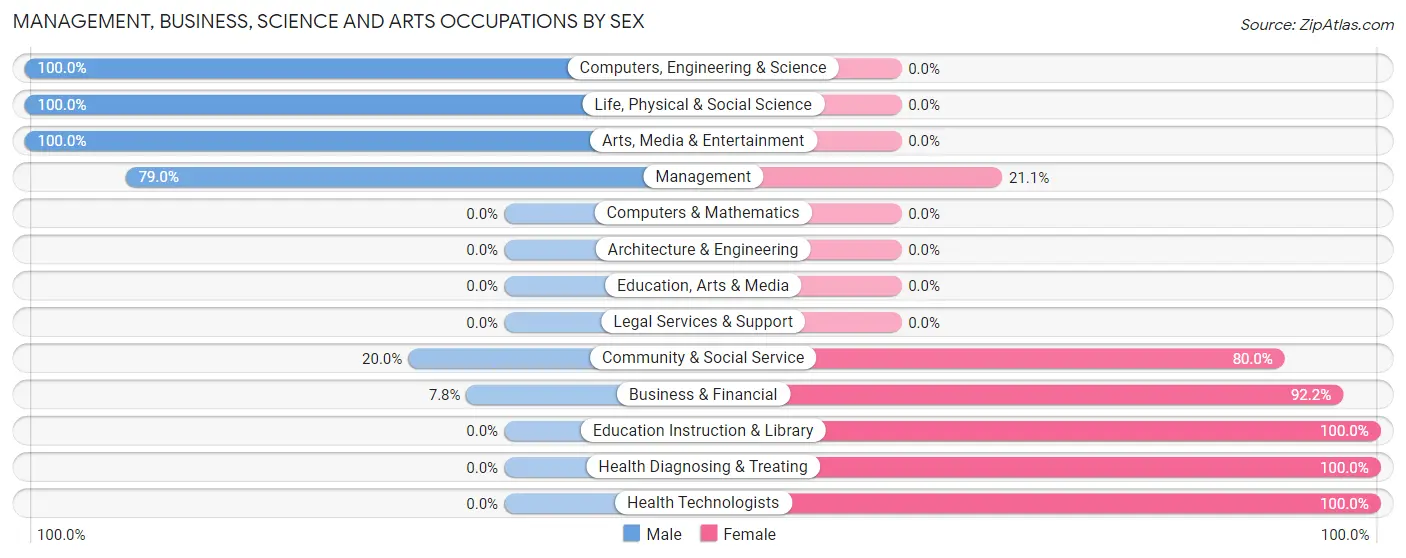
Management, Business, Science and Arts Occupations by Sex
Within the Management, Business, Science and Arts occupations in Ashburn, the most male-oriented occupations are Computers, Engineering & Science (100.0%), Life, Physical & Social Science (100.0%), and Arts, Media & Entertainment (100.0%), while the most female-oriented occupations are Education Instruction & Library (100.0%), Health Diagnosing & Treating (100.0%), and Health Technologists (100.0%).
| Occupation | Male | Female |
| Management | 15 (78.9%) | 4 (21.0%) |
| Business & Financial | 4 (7.8%) | 47 (92.2%) |
| Computers, Engineering & Science | 16 (100.0%) | 0 (0.0%) |
| Computers & Mathematics | 0 (0.0%) | 0 (0.0%) |
| Architecture & Engineering | 0 (0.0%) | 0 (0.0%) |
| Life, Physical & Social Science | 16 (100.0%) | 0 (0.0%) |
| Community & Social Service | 3 (20.0%) | 12 (80.0%) |
| Education, Arts & Media | 0 (0.0%) | 0 (0.0%) |
| Legal Services & Support | 0 (0.0%) | 0 (0.0%) |
| Education Instruction & Library | 0 (0.0%) | 12 (100.0%) |
| Arts, Media & Entertainment | 3 (100.0%) | 0 (0.0%) |
| Health Diagnosing & Treating | 0 (0.0%) | 95 (100.0%) |
| Health Technologists | 0 (0.0%) | 63 (100.0%) |
| Total (Category) | 38 (19.4%) | 158 (80.6%) |
| Total (Overall) | 735 (51.2%) | 700 (48.8%) |
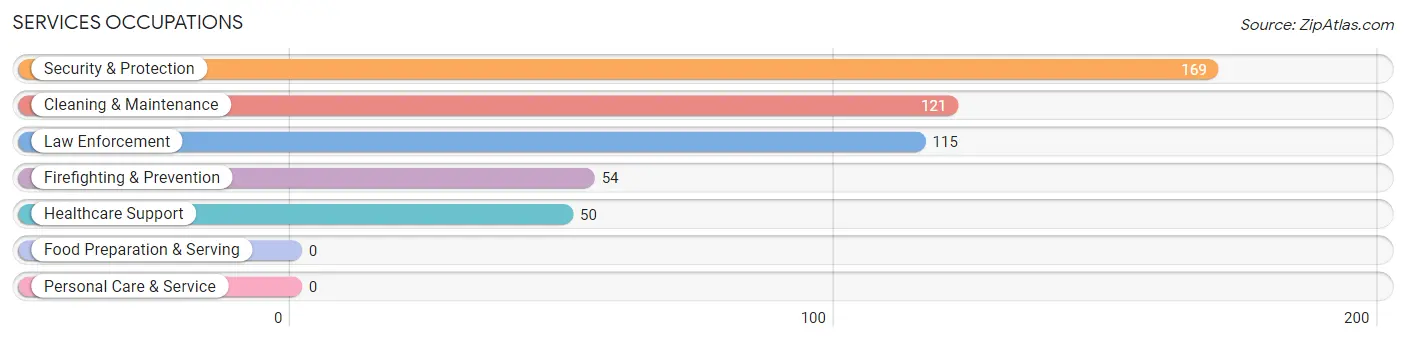
Services Occupations
The most common Services occupations in Ashburn are Security & Protection (169 | 11.8%), Cleaning & Maintenance (121 | 8.4%), Law Enforcement (115 | 8.0%), Firefighting & Prevention (54 | 3.8%), and Healthcare Support (50 | 3.5%).
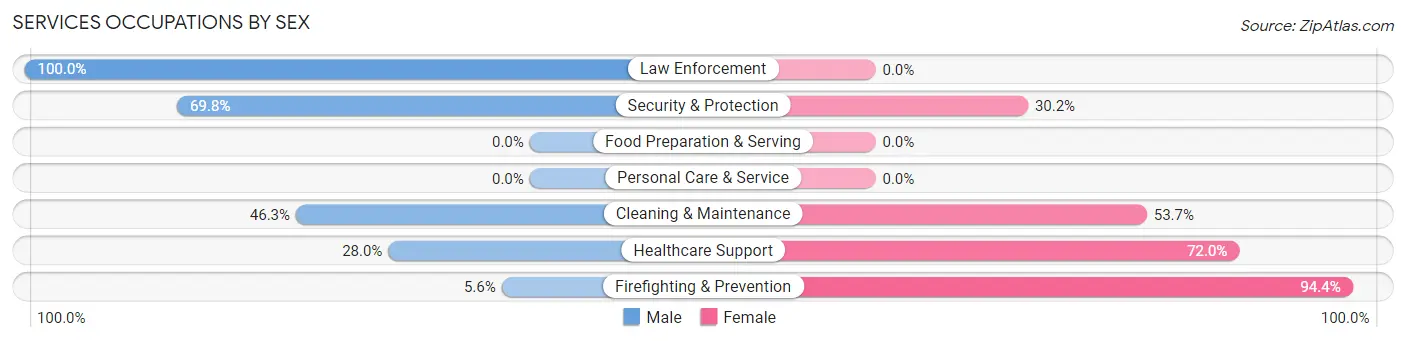
Services Occupations by Sex
Within the Services occupations in Ashburn, the most male-oriented occupations are Law Enforcement (100.0%), Security & Protection (69.8%), and Cleaning & Maintenance (46.3%), while the most female-oriented occupations are Firefighting & Prevention (94.4%), Healthcare Support (72.0%), and Cleaning & Maintenance (53.7%).
| Occupation | Male | Female |
| Healthcare Support | 14 (28.0%) | 36 (72.0%) |
| Security & Protection | 118 (69.8%) | 51 (30.2%) |
| Firefighting & Prevention | 3 (5.6%) | 51 (94.4%) |
| Law Enforcement | 115 (100.0%) | 0 (0.0%) |
| Food Preparation & Serving | 0 (0.0%) | 0 (0.0%) |
| Cleaning & Maintenance | 56 (46.3%) | 65 (53.7%) |
| Personal Care & Service | 0 (0.0%) | 0 (0.0%) |
| Total (Category) | 188 (55.3%) | 152 (44.7%) |
| Total (Overall) | 735 (51.2%) | 700 (48.8%) |
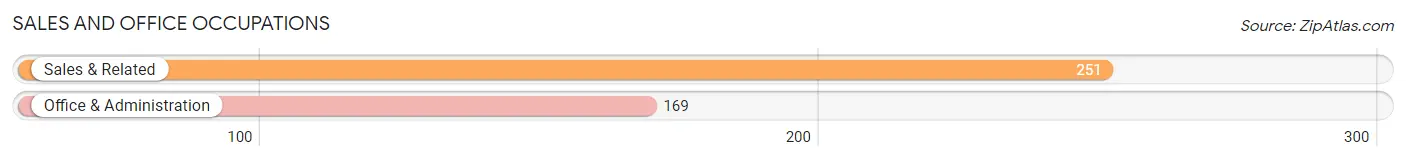
Sales and Office Occupations
The most common Sales and Office occupations in Ashburn are Sales & Related (251 | 17.5%), and Office & Administration (169 | 11.8%).
Sales and Office Occupations by Sex
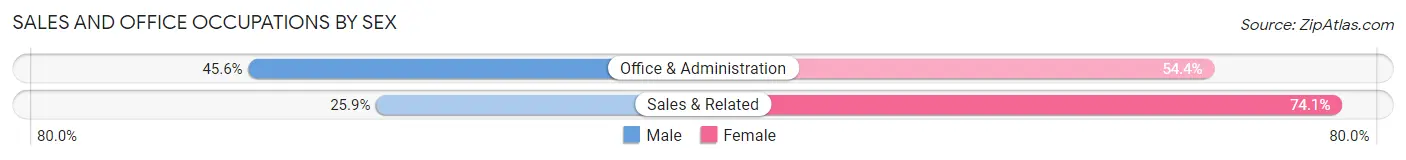
| Occupation | Male | Female |
| Sales & Related | 65 (25.9%) | 186 (74.1%) |
| Office & Administration | 77 (45.6%) | 92 (54.4%) |
| Total (Category) | 142 (33.8%) | 278 (66.2%) |
| Total (Overall) | 735 (51.2%) | 700 (48.8%) |
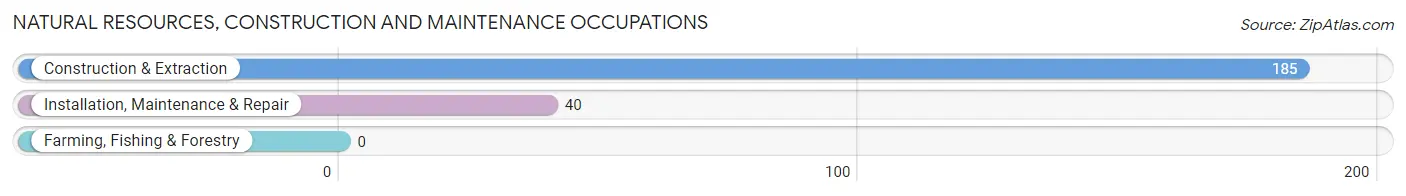
Natural Resources, Construction and Maintenance Occupations
The most common Natural Resources, Construction and Maintenance occupations in Ashburn are Construction & Extraction (185 | 12.9%), and Installation, Maintenance & Repair (40 | 2.8%).
Natural Resources, Construction and Maintenance Occupations by Sex
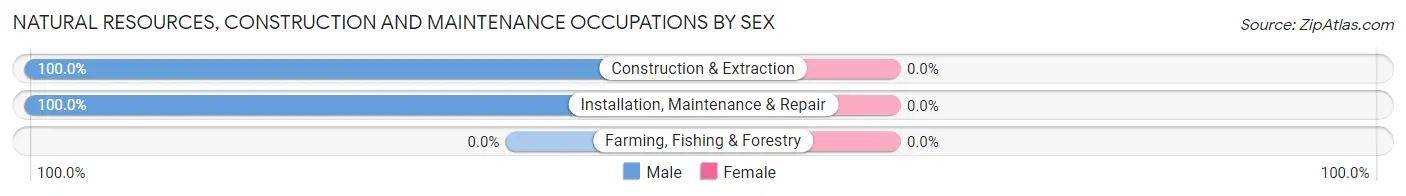
| Occupation | Male | Female |
| Farming, Fishing & Forestry | 0 (0.0%) | 0 (0.0%) |
| Construction & Extraction | 185 (100.0%) | 0 (0.0%) |
| Installation, Maintenance & Repair | 40 (100.0%) | 0 (0.0%) |
| Total (Category) | 225 (100.0%) | 0 (0.0%) |
| Total (Overall) | 735 (51.2%) | 700 (48.8%) |
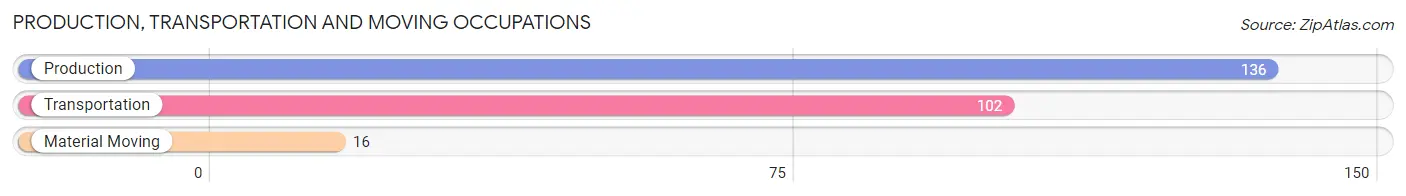
Production, Transportation and Moving Occupations
The most common Production, Transportation and Moving occupations in Ashburn are Production (136 | 9.5%), Transportation (102 | 7.1%), and Material Moving (16 | 1.1%).
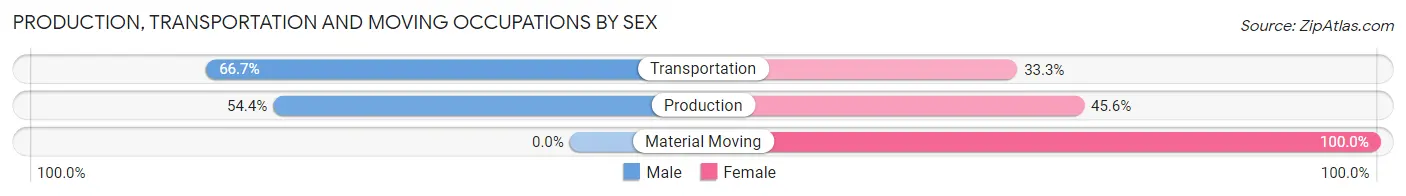
Production, Transportation and Moving Occupations by Sex
| Occupation | Male | Female |
| Production | 74 (54.4%) | 62 (45.6%) |
| Transportation | 68 (66.7%) | 34 (33.3%) |
| Material Moving | 0 (0.0%) | 16 (100.0%) |
| Total (Category) | 142 (55.9%) | 112 (44.1%) |
| Total (Overall) | 735 (51.2%) | 700 (48.8%) |
Employment Industries by Sex in Ashburn
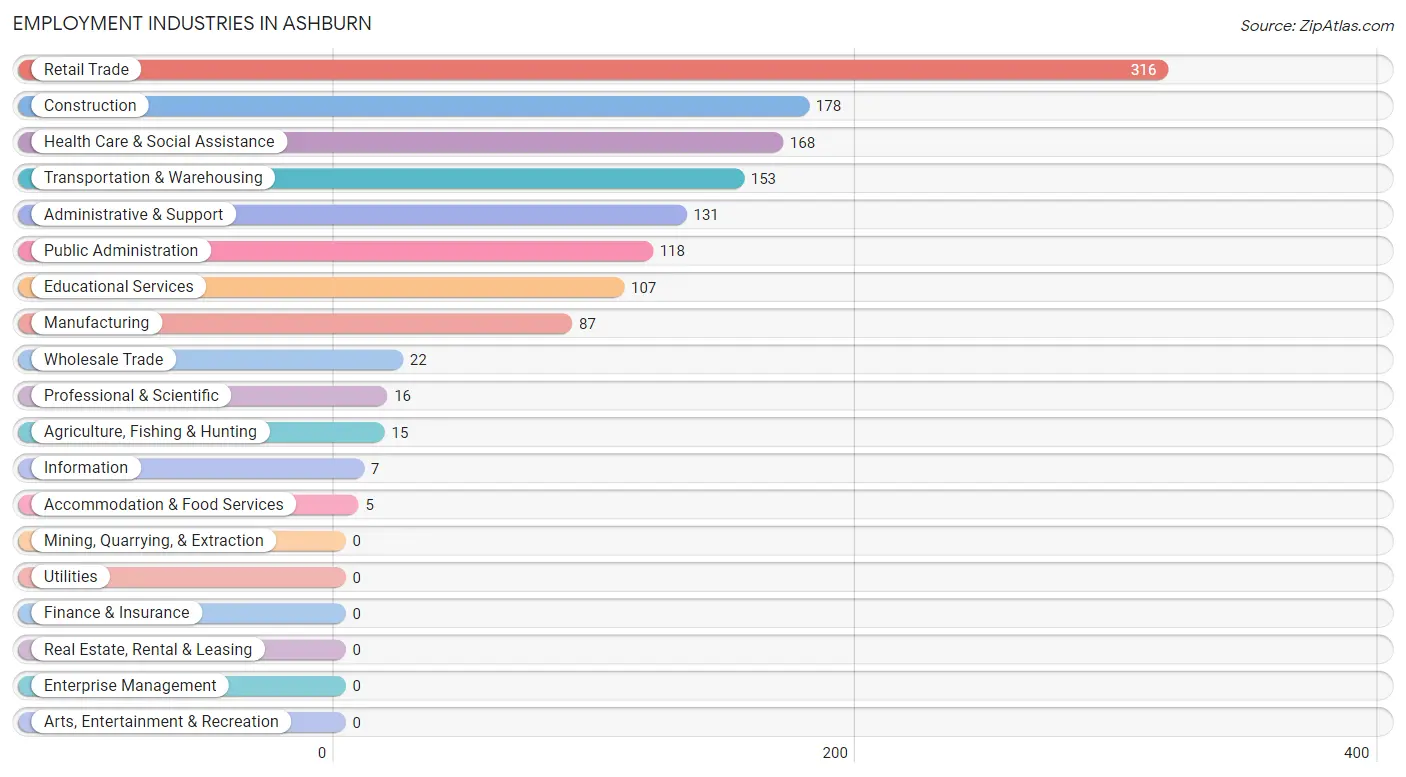
Employment Industries in Ashburn
The major employment industries in Ashburn include Retail Trade (316 | 22.0%), Construction (178 | 12.4%), Health Care & Social Assistance (168 | 11.7%), Transportation & Warehousing (153 | 10.7%), and Administrative & Support (131 | 9.1%).
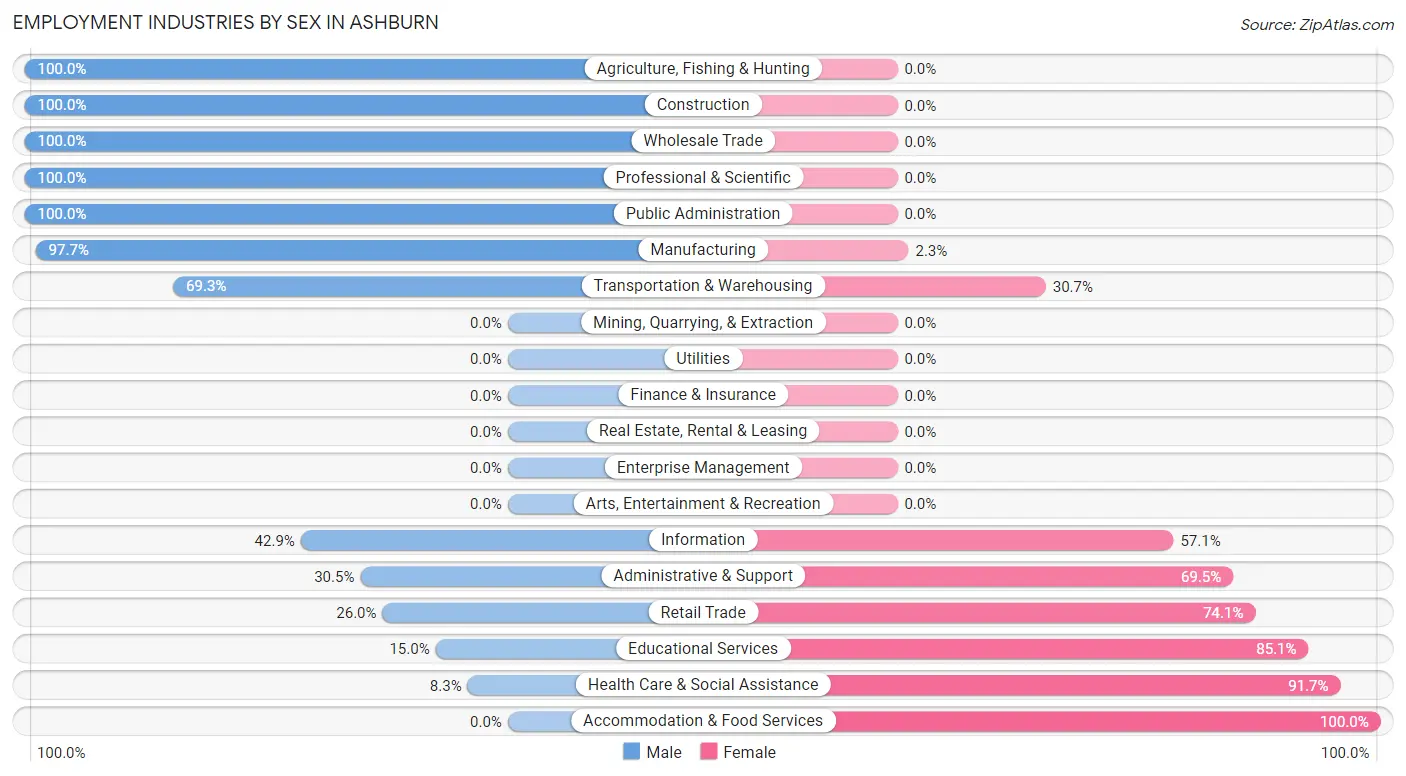
Employment Industries by Sex in Ashburn
The Ashburn industries that see more men than women are Agriculture, Fishing & Hunting (100.0%), Construction (100.0%), and Wholesale Trade (100.0%), whereas the industries that tend to have a higher number of women are Accommodation & Food Services (100.0%), Health Care & Social Assistance (91.7%), and Educational Services (85.1%).
| Industry | Male | Female |
| Agriculture, Fishing & Hunting | 15 (100.0%) | 0 (0.0%) |
| Mining, Quarrying, & Extraction | 0 (0.0%) | 0 (0.0%) |
| Construction | 178 (100.0%) | 0 (0.0%) |
| Manufacturing | 85 (97.7%) | 2 (2.3%) |
| Wholesale Trade | 22 (100.0%) | 0 (0.0%) |
| Retail Trade | 82 (26.0%) | 234 (74.1%) |
| Transportation & Warehousing | 106 (69.3%) | 47 (30.7%) |
| Utilities | 0 (0.0%) | 0 (0.0%) |
| Information | 3 (42.9%) | 4 (57.1%) |
| Finance & Insurance | 0 (0.0%) | 0 (0.0%) |
| Real Estate, Rental & Leasing | 0 (0.0%) | 0 (0.0%) |
| Professional & Scientific | 16 (100.0%) | 0 (0.0%) |
| Enterprise Management | 0 (0.0%) | 0 (0.0%) |
| Administrative & Support | 40 (30.5%) | 91 (69.5%) |
| Educational Services | 16 (14.9%) | 91 (85.1%) |
| Health Care & Social Assistance | 14 (8.3%) | 154 (91.7%) |
| Arts, Entertainment & Recreation | 0 (0.0%) | 0 (0.0%) |
| Accommodation & Food Services | 0 (0.0%) | 5 (100.0%) |
| Public Administration | 118 (100.0%) | 0 (0.0%) |
| Total | 735 (51.2%) | 700 (48.8%) |
Education in Ashburn
School Enrollment in Ashburn
The most common levels of schooling among the 1,090 students in Ashburn are middle school (304 | 27.9%), college / undergraduate (240 | 22.0%), and elementary school (224 | 20.5%).
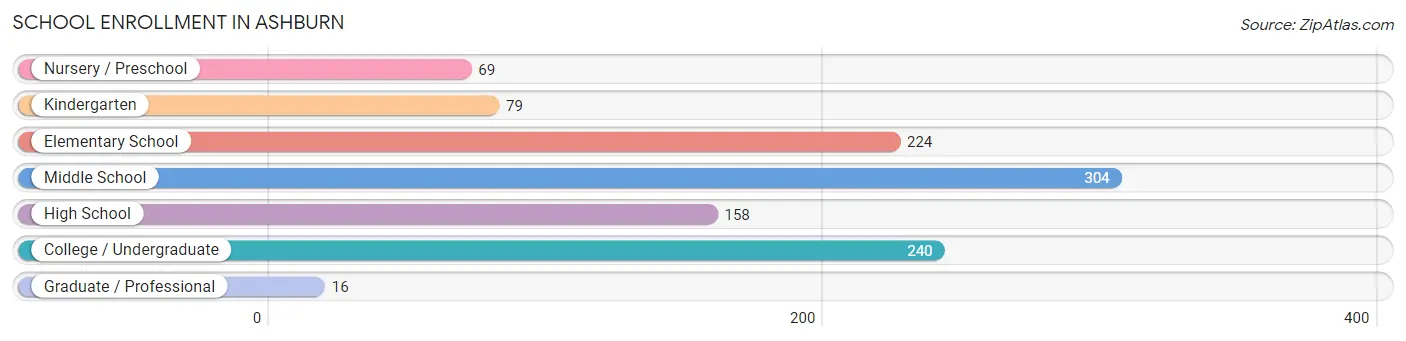
| School Level | # Students | % Students |
| Nursery / Preschool | 69 | 6.3% |
| Kindergarten | 79 | 7.2% |
| Elementary School | 224 | 20.5% |
| Middle School | 304 | 27.9% |
| High School | 158 | 14.5% |
| College / Undergraduate | 240 | 22.0% |
| Graduate / Professional | 16 | 1.5% |
| Total | 1,090 | 100.0% |
School Enrollment by Age by Funding Source in Ashburn
Out of a total of 1,090 students who are enrolled in schools in Ashburn, 69 (6.3%) attend a private institution, while the remaining 1,021 (93.7%) are enrolled in public schools. The age group of 15 to 17 year olds has the highest likelihood of being enrolled in private schools, with 29 (19.7% in the age bracket) enrolled. Conversely, the age group of 3 to 4 year olds has the lowest likelihood of being enrolled in a private school, with 40 (100.0% in the age bracket) attending a public institution.
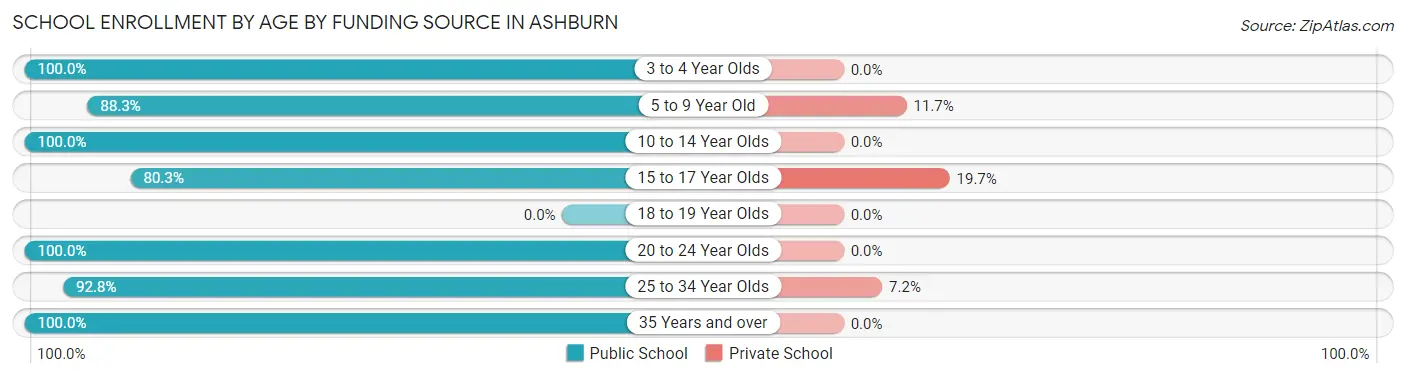
| Age Bracket | Public School | Private School |
| 3 to 4 Year Olds | 40 (100.0%) | 0 (0.0%) |
| 5 to 9 Year Old | 181 (88.3%) | 24 (11.7%) |
| 10 to 14 Year Olds | 442 (100.0%) | 0 (0.0%) |
| 15 to 17 Year Olds | 118 (80.3%) | 29 (19.7%) |
| 18 to 19 Year Olds | 0 (0.0%) | 0 (0.0%) |
| 20 to 24 Year Olds | 19 (100.0%) | 0 (0.0%) |
| 25 to 34 Year Olds | 207 (92.8%) | 16 (7.2%) |
| 35 Years and over | 14 (100.0%) | 0 (0.0%) |
| Total | 1,021 (93.7%) | 69 (6.3%) |
Educational Attainment by Field of Study in Ashburn
Education (102 | 32.5%), business (87 | 27.7%), psychology (44 | 14.0%), bio, nature & agricultural (30 | 9.6%), and arts & humanities (27 | 8.6%) are the most common fields of study among 314 individuals in Ashburn who have obtained a bachelor's degree or higher.
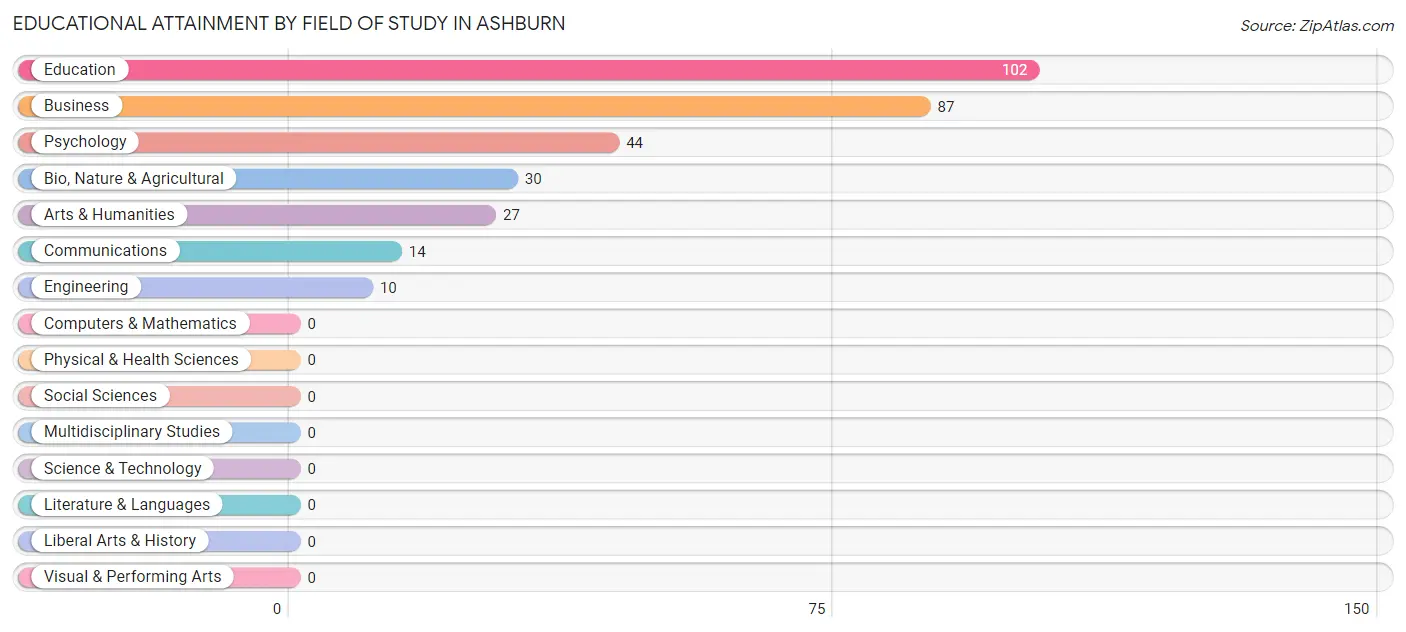
| Field of Study | # Graduates | % Graduates |
| Computers & Mathematics | 0 | 0.0% |
| Bio, Nature & Agricultural | 30 | 9.6% |
| Physical & Health Sciences | 0 | 0.0% |
| Psychology | 44 | 14.0% |
| Social Sciences | 0 | 0.0% |
| Engineering | 10 | 3.2% |
| Multidisciplinary Studies | 0 | 0.0% |
| Science & Technology | 0 | 0.0% |
| Business | 87 | 27.7% |
| Education | 102 | 32.5% |
| Literature & Languages | 0 | 0.0% |
| Liberal Arts & History | 0 | 0.0% |
| Visual & Performing Arts | 0 | 0.0% |
| Communications | 14 | 4.5% |
| Arts & Humanities | 27 | 8.6% |
| Total | 314 | 100.0% |
Transportation & Commute in Ashburn
Vehicle Availability by Sex in Ashburn
The most prevalent vehicle ownership categories in Ashburn are males with 2 vehicles (258, accounting for 35.2%) and females with 2 vehicles (278, making up 38.6%).
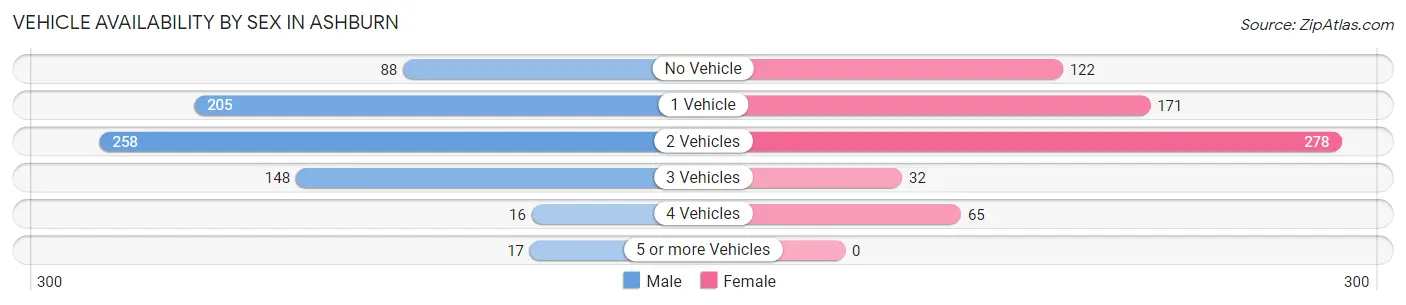
| Vehicles Available | Male | Female |
| No Vehicle | 88 (12.0%) | 122 (18.3%) |
| 1 Vehicle | 205 (28.0%) | 171 (25.6%) |
| 2 Vehicles | 258 (35.2%) | 278 (41.6%) |
| 3 Vehicles | 148 (20.2%) | 32 (4.8%) |
| 4 Vehicles | 16 (2.2%) | 65 (9.7%) |
| 5 or more Vehicles | 17 (2.3%) | 0 (0.0%) |
| Total | 732 (100.0%) | 668 (100.0%) |
Commute Time in Ashburn
The most frequently occuring commute durations in Ashburn are 5 to 9 minutes (280 commuters, 21.5%), 40 to 44 minutes (177 commuters, 13.6%), and 25 to 29 minutes (148 commuters, 11.4%).
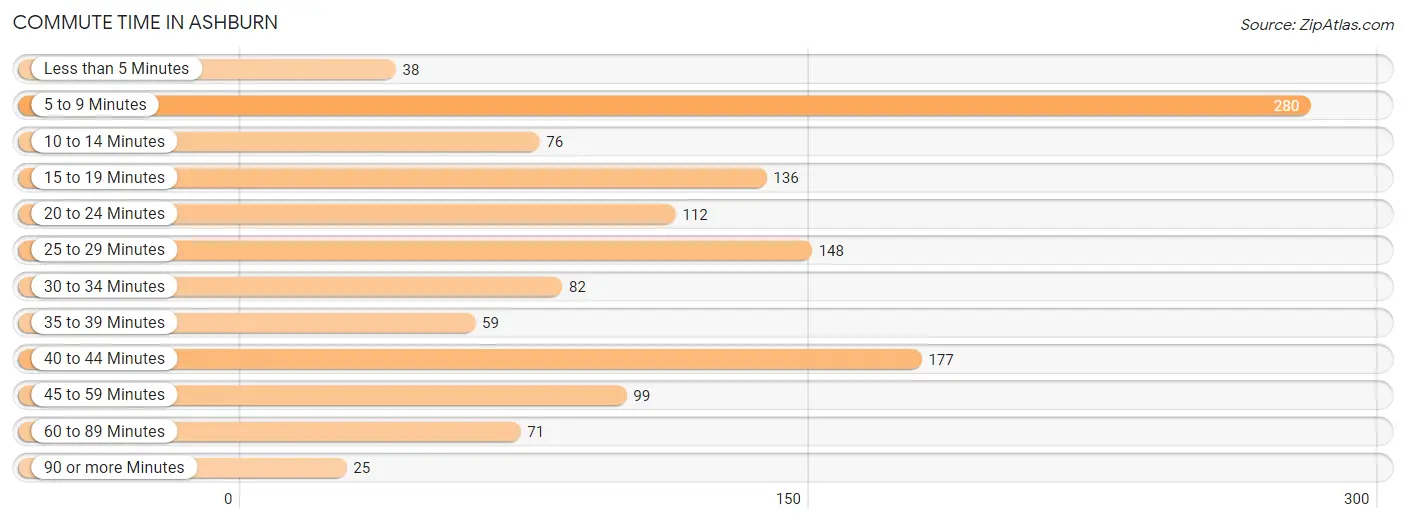
| Commute Time | # Commuters | % Commuters |
| Less than 5 Minutes | 38 | 2.9% |
| 5 to 9 Minutes | 280 | 21.5% |
| 10 to 14 Minutes | 76 | 5.8% |
| 15 to 19 Minutes | 136 | 10.4% |
| 20 to 24 Minutes | 112 | 8.6% |
| 25 to 29 Minutes | 148 | 11.4% |
| 30 to 34 Minutes | 82 | 6.3% |
| 35 to 39 Minutes | 59 | 4.5% |
| 40 to 44 Minutes | 177 | 13.6% |
| 45 to 59 Minutes | 99 | 7.6% |
| 60 to 89 Minutes | 71 | 5.4% |
| 90 or more Minutes | 25 | 1.9% |
Commute Time by Sex in Ashburn
The most common commute times in Ashburn are 5 to 9 minutes (169 commuters, 23.7%) for males and 40 to 44 minutes (177 commuters, 30.0%) for females.
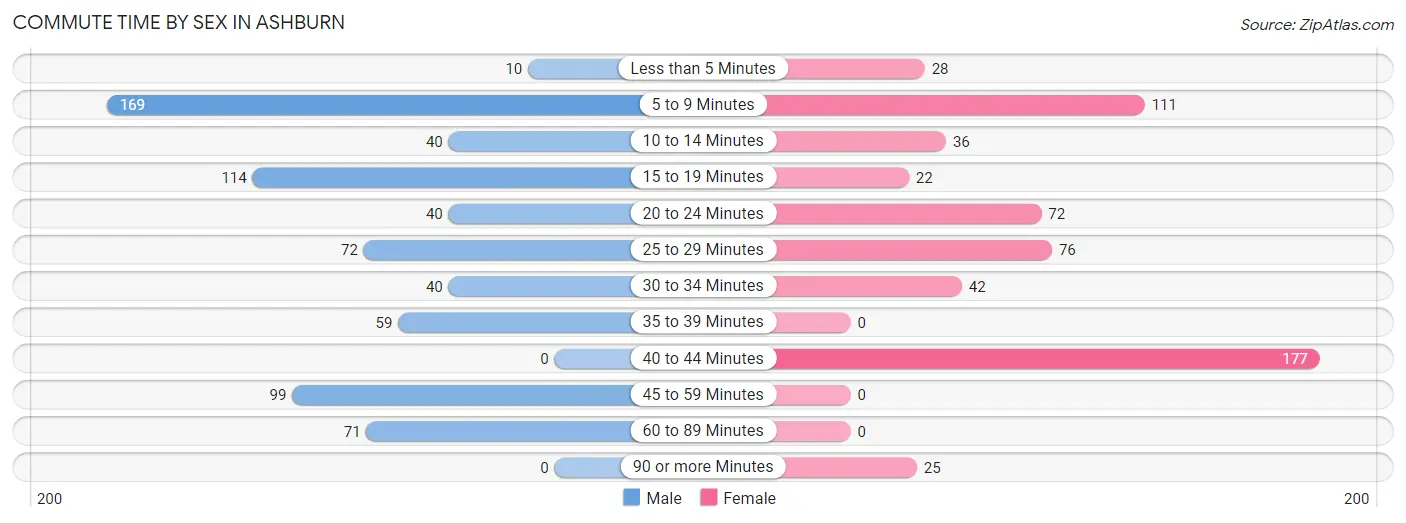
| Commute Time | Male | Female |
| Less than 5 Minutes | 10 (1.4%) | 28 (4.8%) |
| 5 to 9 Minutes | 169 (23.7%) | 111 (18.9%) |
| 10 to 14 Minutes | 40 (5.6%) | 36 (6.1%) |
| 15 to 19 Minutes | 114 (16.0%) | 22 (3.7%) |
| 20 to 24 Minutes | 40 (5.6%) | 72 (12.2%) |
| 25 to 29 Minutes | 72 (10.1%) | 76 (12.9%) |
| 30 to 34 Minutes | 40 (5.6%) | 42 (7.1%) |
| 35 to 39 Minutes | 59 (8.3%) | 0 (0.0%) |
| 40 to 44 Minutes | 0 (0.0%) | 177 (30.0%) |
| 45 to 59 Minutes | 99 (13.9%) | 0 (0.0%) |
| 60 to 89 Minutes | 71 (9.9%) | 0 (0.0%) |
| 90 or more Minutes | 0 (0.0%) | 25 (4.2%) |
Time of Departure to Work by Sex in Ashburn
The most frequent times of departure to work in Ashburn are 6:30 AM to 6:59 AM (196, 27.5%) for males and 7:00 AM to 7:29 AM (276, 46.9%) for females.
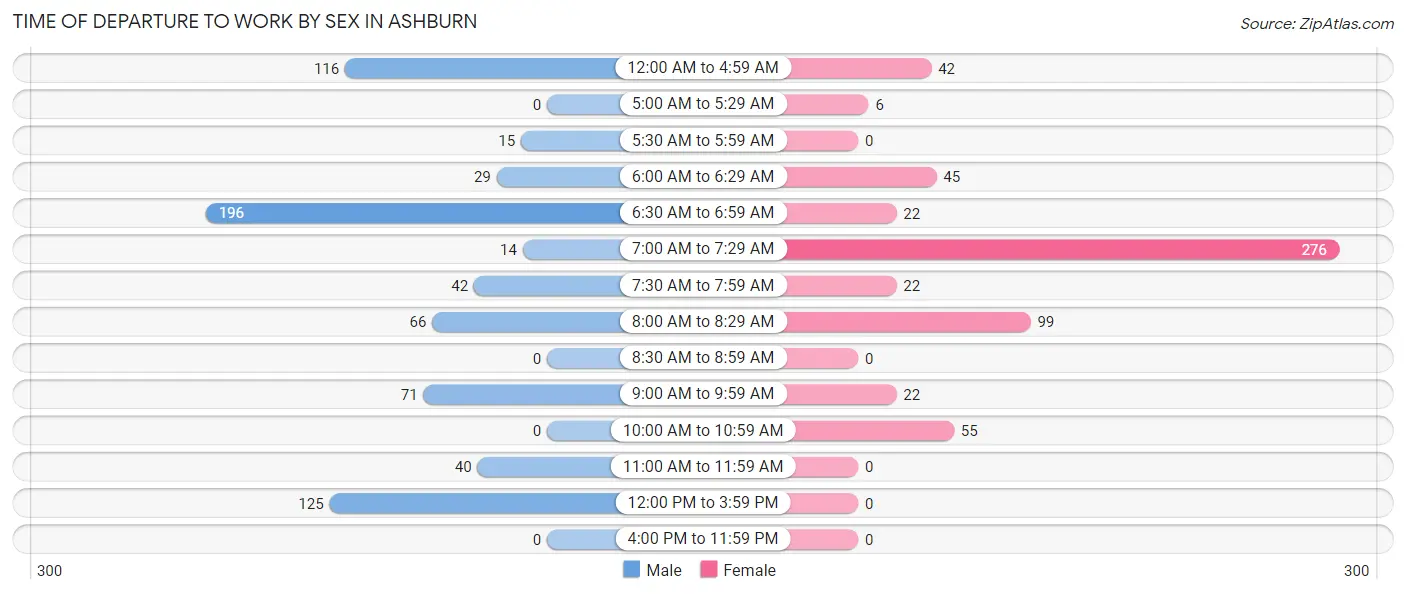
| Time of Departure | Male | Female |
| 12:00 AM to 4:59 AM | 116 (16.3%) | 42 (7.1%) |
| 5:00 AM to 5:29 AM | 0 (0.0%) | 6 (1.0%) |
| 5:30 AM to 5:59 AM | 15 (2.1%) | 0 (0.0%) |
| 6:00 AM to 6:29 AM | 29 (4.1%) | 45 (7.6%) |
| 6:30 AM to 6:59 AM | 196 (27.5%) | 22 (3.7%) |
| 7:00 AM to 7:29 AM | 14 (2.0%) | 276 (46.9%) |
| 7:30 AM to 7:59 AM | 42 (5.9%) | 22 (3.7%) |
| 8:00 AM to 8:29 AM | 66 (9.2%) | 99 (16.8%) |
| 8:30 AM to 8:59 AM | 0 (0.0%) | 0 (0.0%) |
| 9:00 AM to 9:59 AM | 71 (9.9%) | 22 (3.7%) |
| 10:00 AM to 10:59 AM | 0 (0.0%) | 55 (9.3%) |
| 11:00 AM to 11:59 AM | 40 (5.6%) | 0 (0.0%) |
| 12:00 PM to 3:59 PM | 125 (17.5%) | 0 (0.0%) |
| 4:00 PM to 11:59 PM | 0 (0.0%) | 0 (0.0%) |
| Total | 714 (100.0%) | 589 (100.0%) |
Housing Occupancy in Ashburn
Occupancy by Ownership in Ashburn
Of the total 1,589 dwellings in Ashburn, owner-occupied units account for 893 (56.2%), while renter-occupied units make up 696 (43.8%).
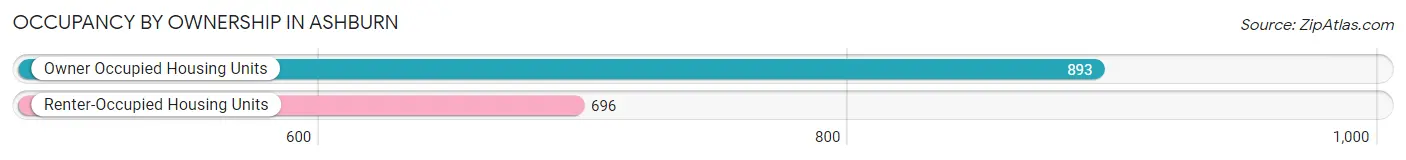
| Occupancy | # Housing Units | % Housing Units |
| Owner Occupied Housing Units | 893 | 56.2% |
| Renter-Occupied Housing Units | 696 | 43.8% |
| Total Occupied Housing Units | 1,589 | 100.0% |
Occupancy by Household Size in Ashburn
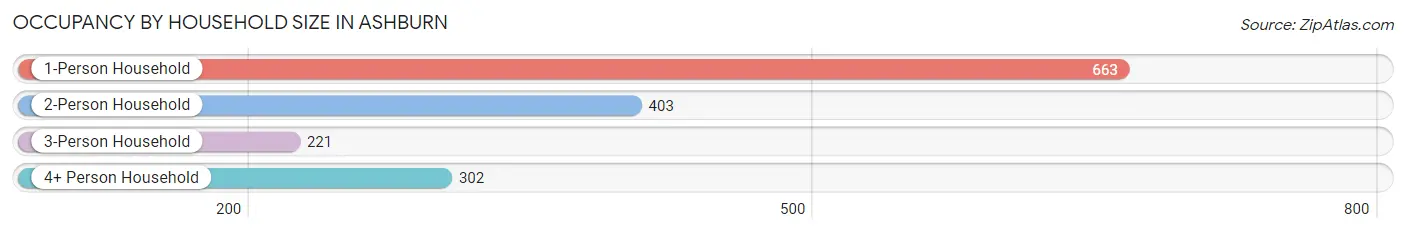
| Household Size | # Housing Units | % Housing Units |
| 1-Person Household | 663 | 41.7% |
| 2-Person Household | 403 | 25.4% |
| 3-Person Household | 221 | 13.9% |
| 4+ Person Household | 302 | 19.0% |
| Total Housing Units | 1,589 | 100.0% |
Occupancy by Ownership by Household Size in Ashburn
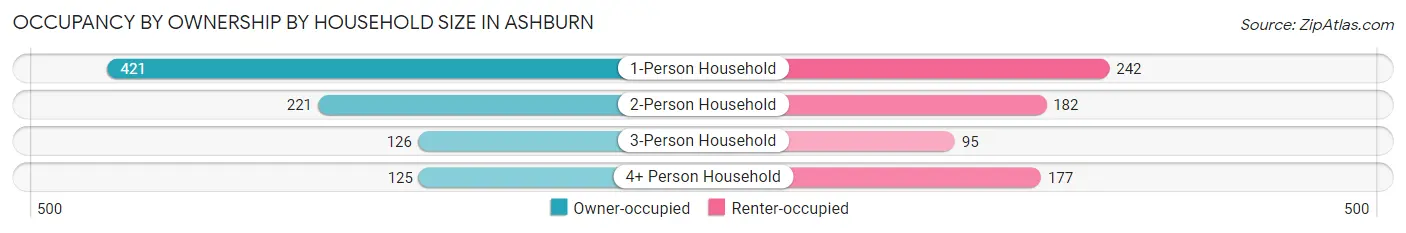
| Household Size | Owner-occupied | Renter-occupied |
| 1-Person Household | 421 (63.5%) | 242 (36.5%) |
| 2-Person Household | 221 (54.8%) | 182 (45.2%) |
| 3-Person Household | 126 (57.0%) | 95 (43.0%) |
| 4+ Person Household | 125 (41.4%) | 177 (58.6%) |
| Total Housing Units | 893 (56.2%) | 696 (43.8%) |
Occupancy by Educational Attainment in Ashburn
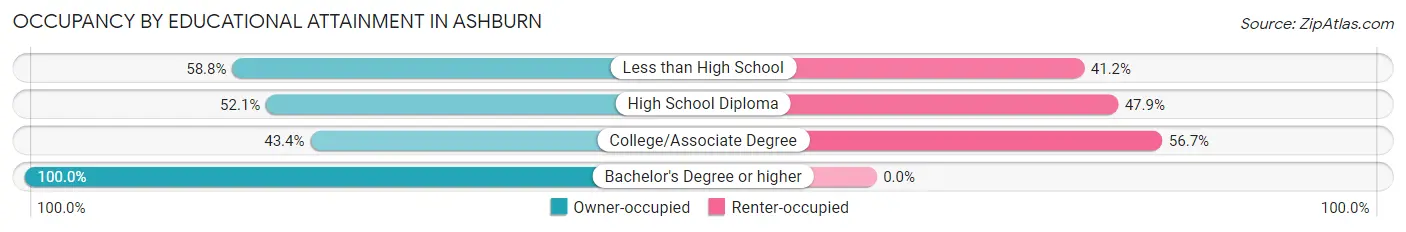
| Household Size | Owner-occupied | Renter-occupied |
| Less than High School | 240 (58.8%) | 168 (41.2%) |
| High School Diploma | 185 (52.1%) | 170 (47.9%) |
| College/Associate Degree | 274 (43.3%) | 358 (56.7%) |
| Bachelor's Degree or higher | 194 (100.0%) | 0 (0.0%) |
Occupancy by Age of Householder in Ashburn
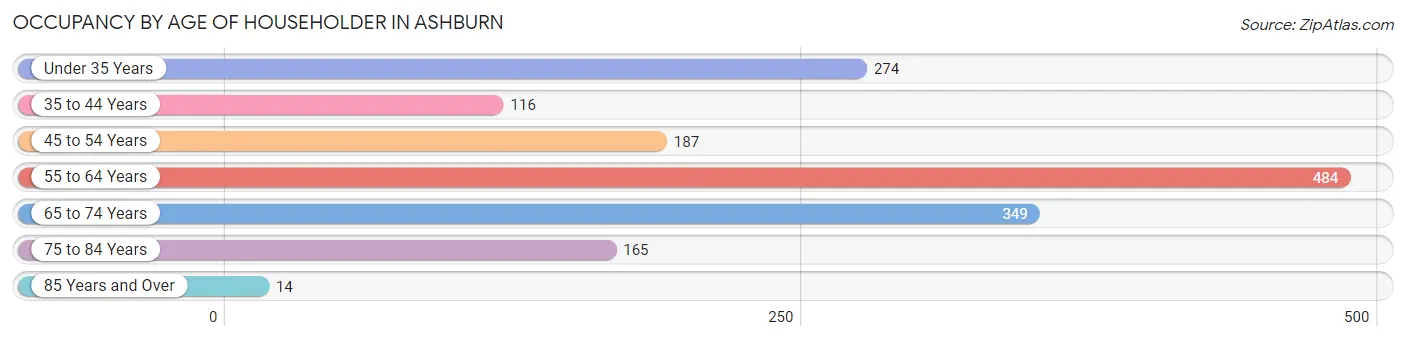
| Age Bracket | # Households | % Households |
| Under 35 Years | 274 | 17.2% |
| 35 to 44 Years | 116 | 7.3% |
| 45 to 54 Years | 187 | 11.8% |
| 55 to 64 Years | 484 | 30.5% |
| 65 to 74 Years | 349 | 22.0% |
| 75 to 84 Years | 165 | 10.4% |
| 85 Years and Over | 14 | 0.9% |
| Total | 1,589 | 100.0% |
Housing Finances in Ashburn
Median Income by Occupancy in Ashburn
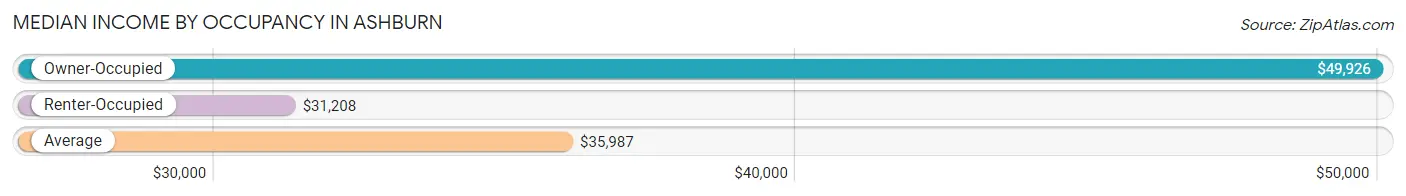
| Occupancy Type | # Households | Median Income |
| Owner-Occupied | 893 (56.2%) | $49,926 |
| Renter-Occupied | 696 (43.8%) | $31,208 |
| Average | 1,589 (100.0%) | $35,987 |
Occupancy by Householder Income Bracket in Ashburn
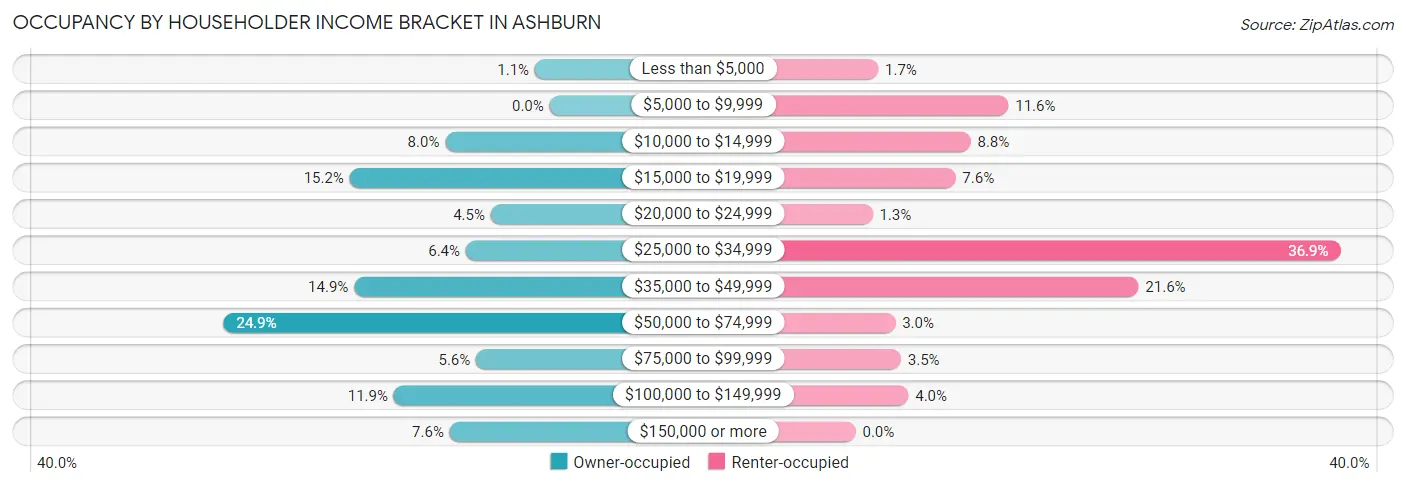
| Income Bracket | Owner-occupied | Renter-occupied |
| Less than $5,000 | 10 (1.1%) | 12 (1.7%) |
| $5,000 to $9,999 | 0 (0.0%) | 81 (11.6%) |
| $10,000 to $14,999 | 71 (8.0%) | 61 (8.8%) |
| $15,000 to $19,999 | 136 (15.2%) | 53 (7.6%) |
| $20,000 to $24,999 | 40 (4.5%) | 9 (1.3%) |
| $25,000 to $34,999 | 57 (6.4%) | 257 (36.9%) |
| $35,000 to $49,999 | 133 (14.9%) | 150 (21.5%) |
| $50,000 to $74,999 | 222 (24.9%) | 21 (3.0%) |
| $75,000 to $99,999 | 50 (5.6%) | 24 (3.5%) |
| $100,000 to $149,999 | 106 (11.9%) | 28 (4.0%) |
| $150,000 or more | 68 (7.6%) | 0 (0.0%) |
| Total | 893 (100.0%) | 696 (100.0%) |
Monthly Housing Cost Tiers in Ashburn
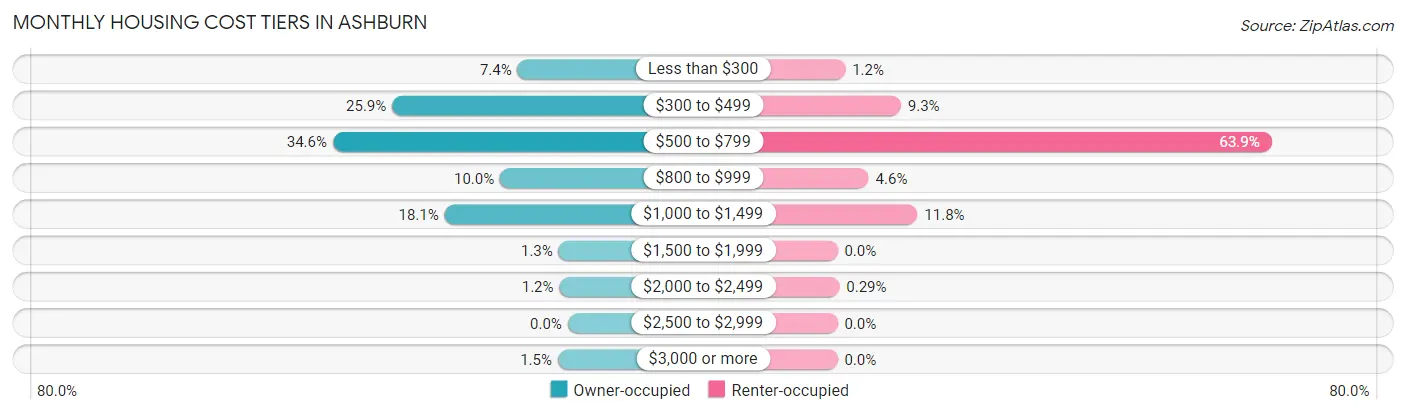
| Monthly Cost | Owner-occupied | Renter-occupied |
| Less than $300 | 66 (7.4%) | 8 (1.1%) |
| $300 to $499 | 231 (25.9%) | 65 (9.3%) |
| $500 to $799 | 309 (34.6%) | 445 (63.9%) |
| $800 to $999 | 89 (10.0%) | 32 (4.6%) |
| $1,000 to $1,499 | 162 (18.1%) | 82 (11.8%) |
| $1,500 to $1,999 | 12 (1.3%) | 0 (0.0%) |
| $2,000 to $2,499 | 11 (1.2%) | 2 (0.3%) |
| $2,500 to $2,999 | 0 (0.0%) | 0 (0.0%) |
| $3,000 or more | 13 (1.5%) | 0 (0.0%) |
| Total | 893 (100.0%) | 696 (100.0%) |
Physical Housing Characteristics in Ashburn
Housing Structures in Ashburn
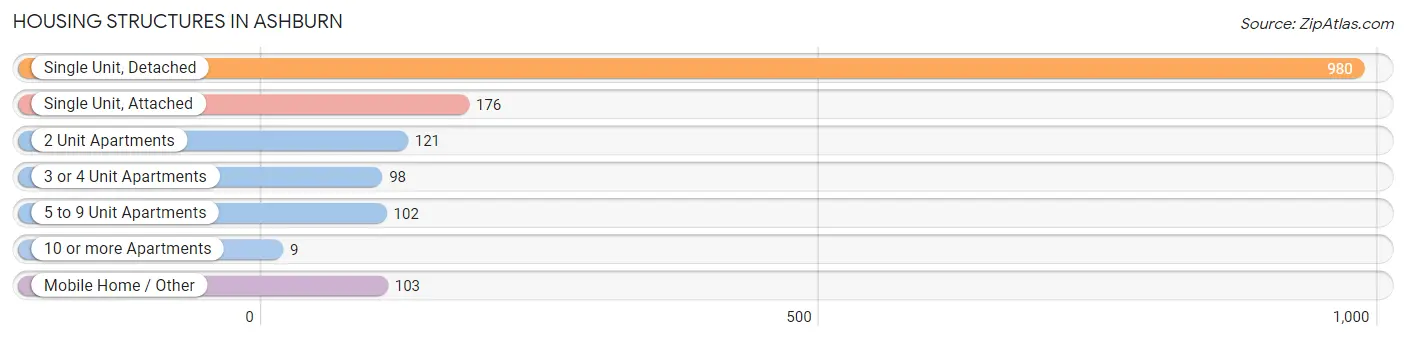
| Structure Type | # Housing Units | % Housing Units |
| Single Unit, Detached | 980 | 61.7% |
| Single Unit, Attached | 176 | 11.1% |
| 2 Unit Apartments | 121 | 7.6% |
| 3 or 4 Unit Apartments | 98 | 6.2% |
| 5 to 9 Unit Apartments | 102 | 6.4% |
| 10 or more Apartments | 9 | 0.6% |
| Mobile Home / Other | 103 | 6.5% |
| Total | 1,589 | 100.0% |
Housing Structures by Occupancy in Ashburn
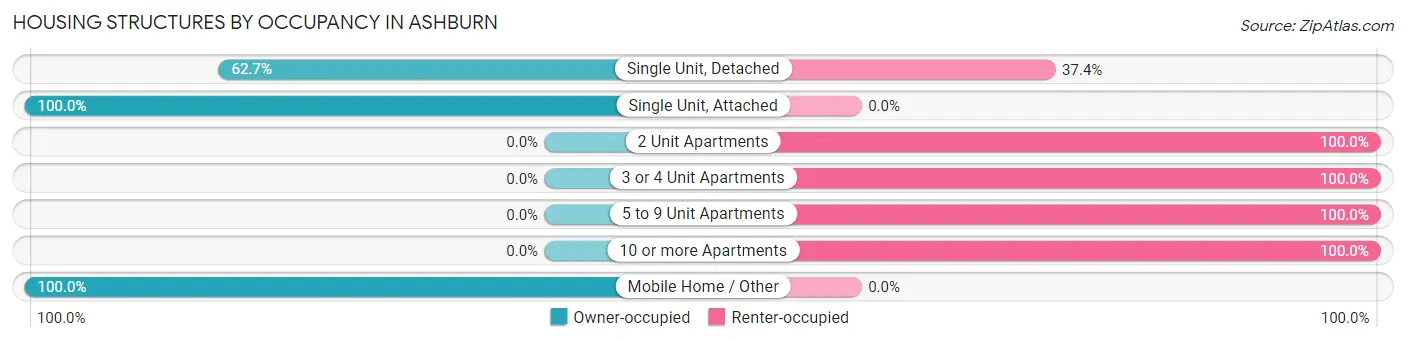
| Structure Type | Owner-occupied | Renter-occupied |
| Single Unit, Detached | 614 (62.6%) | 366 (37.3%) |
| Single Unit, Attached | 176 (100.0%) | 0 (0.0%) |
| 2 Unit Apartments | 0 (0.0%) | 121 (100.0%) |
| 3 or 4 Unit Apartments | 0 (0.0%) | 98 (100.0%) |
| 5 to 9 Unit Apartments | 0 (0.0%) | 102 (100.0%) |
| 10 or more Apartments | 0 (0.0%) | 9 (100.0%) |
| Mobile Home / Other | 103 (100.0%) | 0 (0.0%) |
| Total | 893 (56.2%) | 696 (43.8%) |
Housing Structures by Number of Rooms in Ashburn
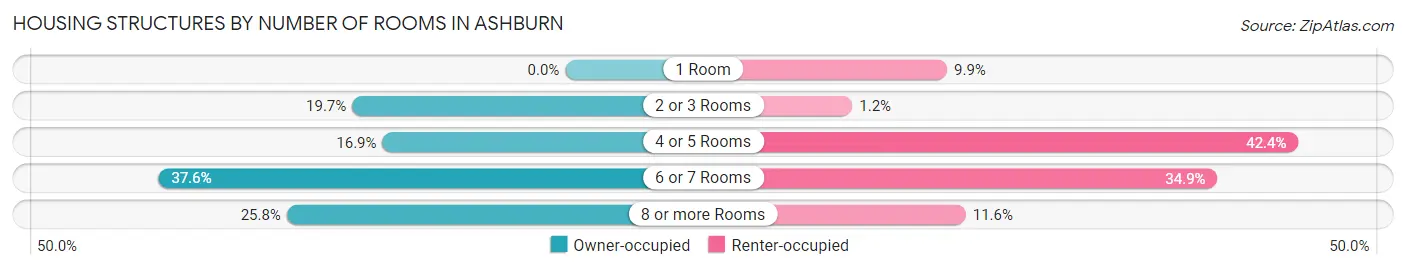
| Number of Rooms | Owner-occupied | Renter-occupied |
| 1 Room | 0 (0.0%) | 69 (9.9%) |
| 2 or 3 Rooms | 176 (19.7%) | 8 (1.1%) |
| 4 or 5 Rooms | 151 (16.9%) | 295 (42.4%) |
| 6 or 7 Rooms | 336 (37.6%) | 243 (34.9%) |
| 8 or more Rooms | 230 (25.8%) | 81 (11.6%) |
| Total | 893 (100.0%) | 696 (100.0%) |
Housing Structure by Heating Type in Ashburn
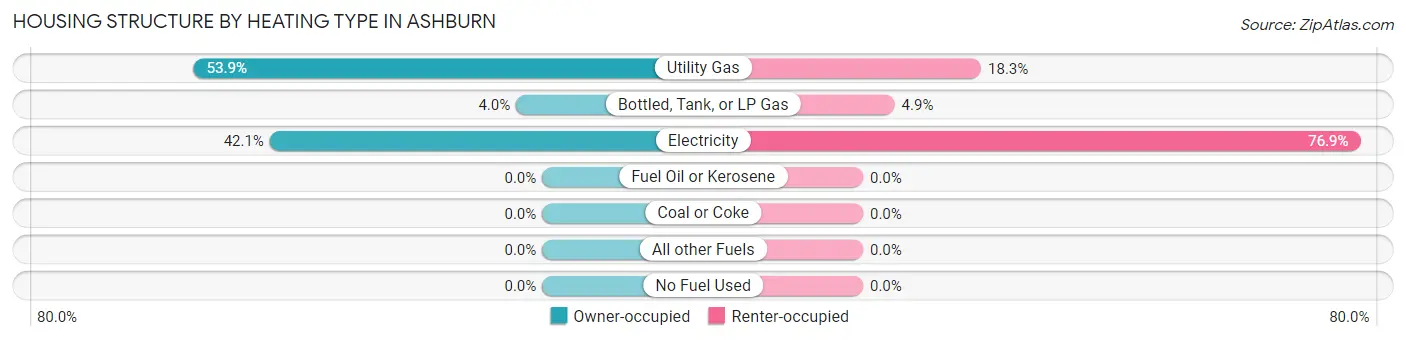
| Heating Type | Owner-occupied | Renter-occupied |
| Utility Gas | 481 (53.9%) | 127 (18.2%) |
| Bottled, Tank, or LP Gas | 36 (4.0%) | 34 (4.9%) |
| Electricity | 376 (42.1%) | 535 (76.9%) |
| Fuel Oil or Kerosene | 0 (0.0%) | 0 (0.0%) |
| Coal or Coke | 0 (0.0%) | 0 (0.0%) |
| All other Fuels | 0 (0.0%) | 0 (0.0%) |
| No Fuel Used | 0 (0.0%) | 0 (0.0%) |
| Total | 893 (100.0%) | 696 (100.0%) |
Household Vehicle Usage in Ashburn
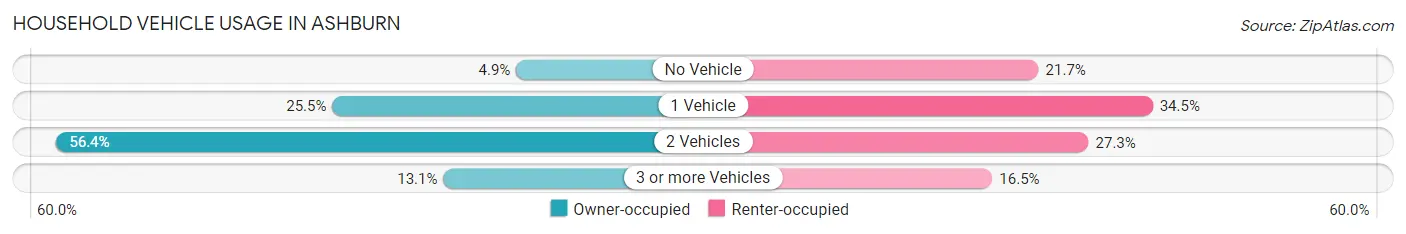
| Vehicles per Household | Owner-occupied | Renter-occupied |
| No Vehicle | 44 (4.9%) | 151 (21.7%) |
| 1 Vehicle | 228 (25.5%) | 240 (34.5%) |
| 2 Vehicles | 504 (56.4%) | 190 (27.3%) |
| 3 or more Vehicles | 117 (13.1%) | 115 (16.5%) |
| Total | 893 (100.0%) | 696 (100.0%) |
Real Estate & Mortgages in Ashburn
Real Estate and Mortgage Overview in Ashburn
| Characteristic | Without Mortgage | With Mortgage |
| Housing Units | 520 | 373 |
| Median Property Value | $83,200 | $89,400 |
| Median Household Income | $37,714 | $53 |
| Monthly Housing Costs | $455 | $13 |
| Real Estate Taxes | $995 | $0 |
Property Value by Mortgage Status in Ashburn
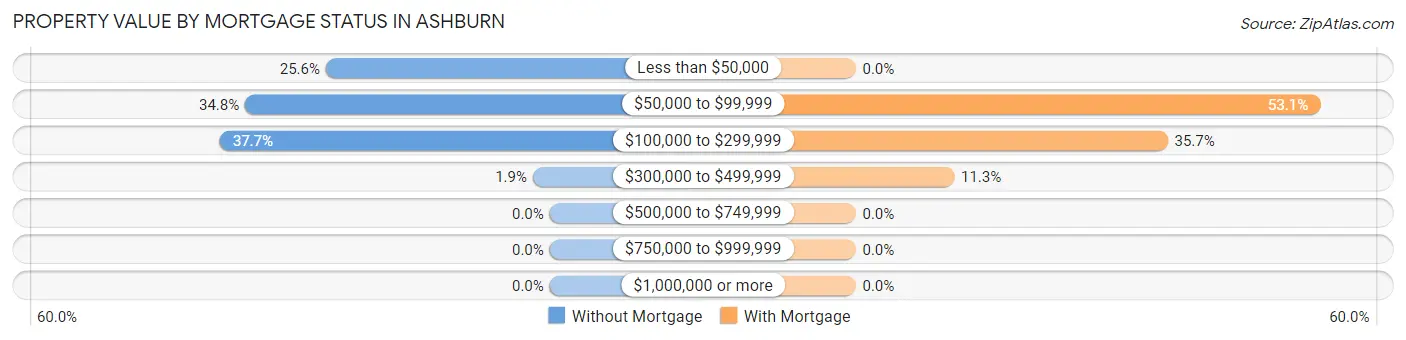
| Property Value | Without Mortgage | With Mortgage |
| Less than $50,000 | 133 (25.6%) | 0 (0.0%) |
| $50,000 to $99,999 | 181 (34.8%) | 198 (53.1%) |
| $100,000 to $299,999 | 196 (37.7%) | 133 (35.7%) |
| $300,000 to $499,999 | 10 (1.9%) | 42 (11.3%) |
| $500,000 to $749,999 | 0 (0.0%) | 0 (0.0%) |
| $750,000 to $999,999 | 0 (0.0%) | 0 (0.0%) |
| $1,000,000 or more | 0 (0.0%) | 0 (0.0%) |
| Total | 520 (100.0%) | 373 (100.0%) |
Household Income by Mortgage Status in Ashburn
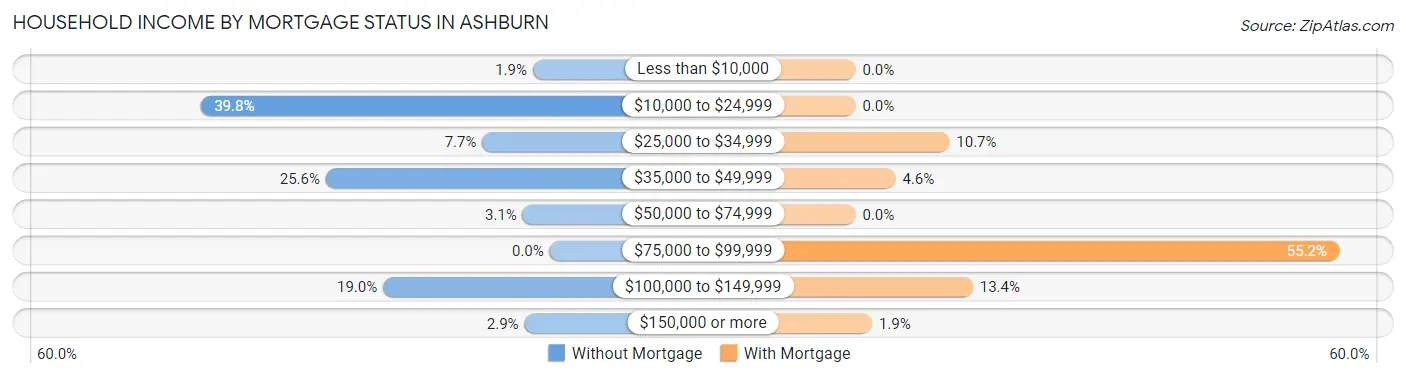
| Household Income | Without Mortgage | With Mortgage |
| Less than $10,000 | 10 (1.9%) | 0 (0.0%) |
| $10,000 to $24,999 | 207 (39.8%) | 0 (0.0%) |
| $25,000 to $34,999 | 40 (7.7%) | 40 (10.7%) |
| $35,000 to $49,999 | 133 (25.6%) | 17 (4.6%) |
| $50,000 to $74,999 | 16 (3.1%) | 0 (0.0%) |
| $75,000 to $99,999 | 0 (0.0%) | 206 (55.2%) |
| $100,000 to $149,999 | 99 (19.0%) | 50 (13.4%) |
| $150,000 or more | 15 (2.9%) | 7 (1.9%) |
| Total | 520 (100.0%) | 373 (100.0%) |
Property Value to Household Income Ratio in Ashburn
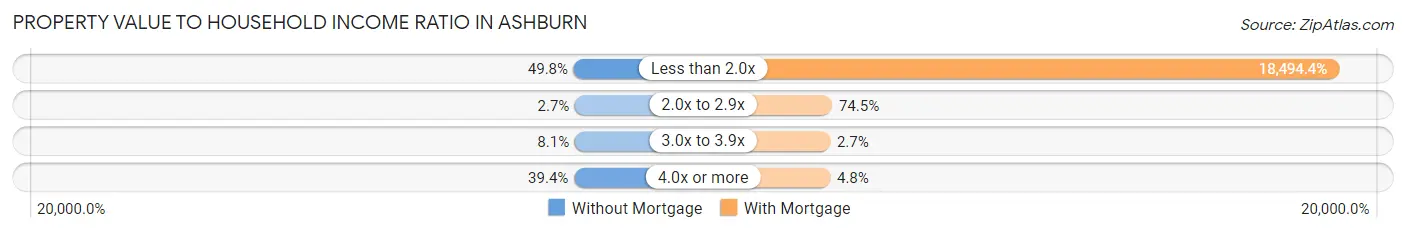
| Value-to-Income Ratio | Without Mortgage | With Mortgage |
| Less than 2.0x | 259 (49.8%) | 68,984 (18,494.4%) |
| 2.0x to 2.9x | 14 (2.7%) | 278 (74.5%) |
| 3.0x to 3.9x | 42 (8.1%) | 10 (2.7%) |
| 4.0x or more | 205 (39.4%) | 18 (4.8%) |
| Total | 520 (100.0%) | 373 (100.0%) |
Real Estate Taxes by Mortgage Status in Ashburn
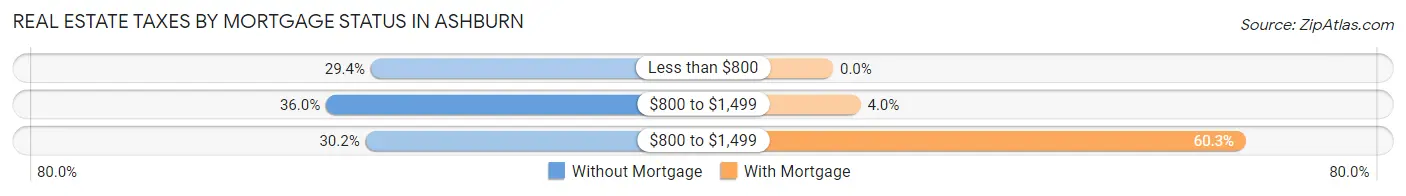
| Property Taxes | Without Mortgage | With Mortgage |
| Less than $800 | 153 (29.4%) | 0 (0.0%) |
| $800 to $1,499 | 187 (36.0%) | 15 (4.0%) |
| $800 to $1,499 | 157 (30.2%) | 225 (60.3%) |
| Total | 520 (100.0%) | 373 (100.0%) |
Health & Disability in Ashburn
Health Insurance Coverage by Age in Ashburn
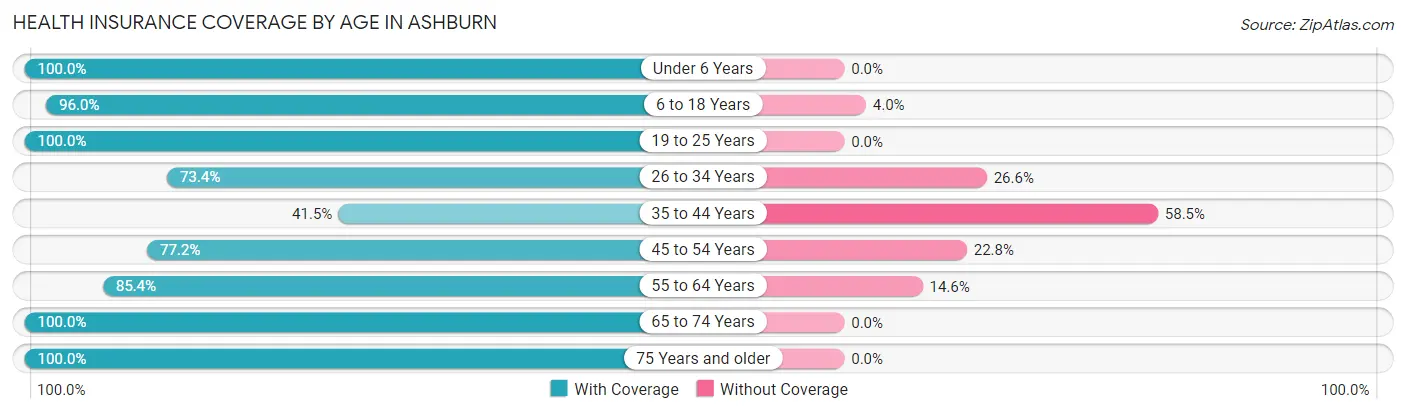
| Age Bracket | With Coverage | Without Coverage |
| Under 6 Years | 377 (100.0%) | 0 (0.0%) |
| 6 to 18 Years | 787 (96.0%) | 33 (4.0%) |
| 19 to 25 Years | 308 (100.0%) | 0 (0.0%) |
| 26 to 34 Years | 329 (73.4%) | 119 (26.6%) |
| 35 to 44 Years | 130 (41.5%) | 183 (58.5%) |
| 45 to 54 Years | 331 (77.2%) | 98 (22.8%) |
| 55 to 64 Years | 562 (85.4%) | 96 (14.6%) |
| 65 to 74 Years | 602 (100.0%) | 0 (0.0%) |
| 75 Years and older | 207 (100.0%) | 0 (0.0%) |
| Total | 3,633 (87.3%) | 529 (12.7%) |
Health Insurance Coverage by Citizenship Status in Ashburn
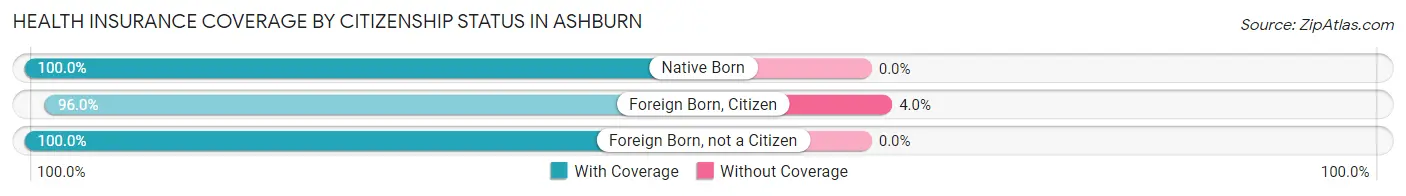
| Citizenship Status | With Coverage | Without Coverage |
| Native Born | 377 (100.0%) | 0 (0.0%) |
| Foreign Born, Citizen | 787 (96.0%) | 33 (4.0%) |
| Foreign Born, not a Citizen | 308 (100.0%) | 0 (0.0%) |
Health Insurance Coverage by Household Income in Ashburn
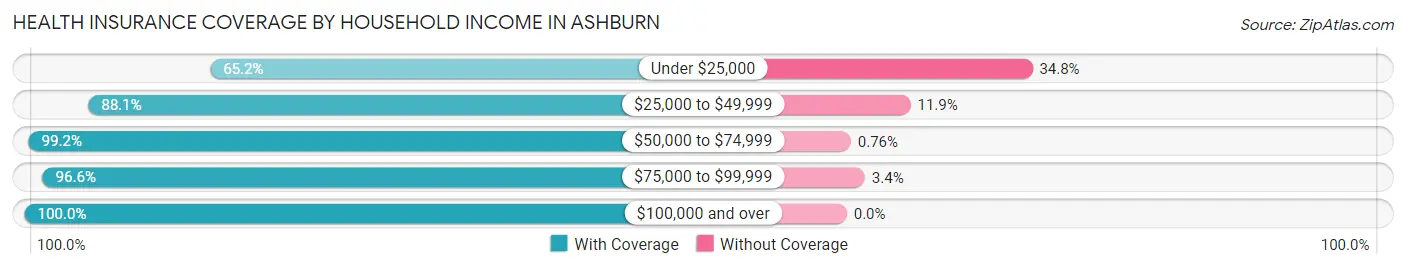
| Household Income | With Coverage | Without Coverage |
| Under $25,000 | 542 (65.2%) | 289 (34.8%) |
| $25,000 to $49,999 | 1,637 (88.1%) | 222 (11.9%) |
| $50,000 to $74,999 | 522 (99.2%) | 4 (0.8%) |
| $75,000 to $99,999 | 399 (96.6%) | 14 (3.4%) |
| $100,000 and over | 533 (100.0%) | 0 (0.0%) |
Public vs Private Health Insurance Coverage by Age in Ashburn
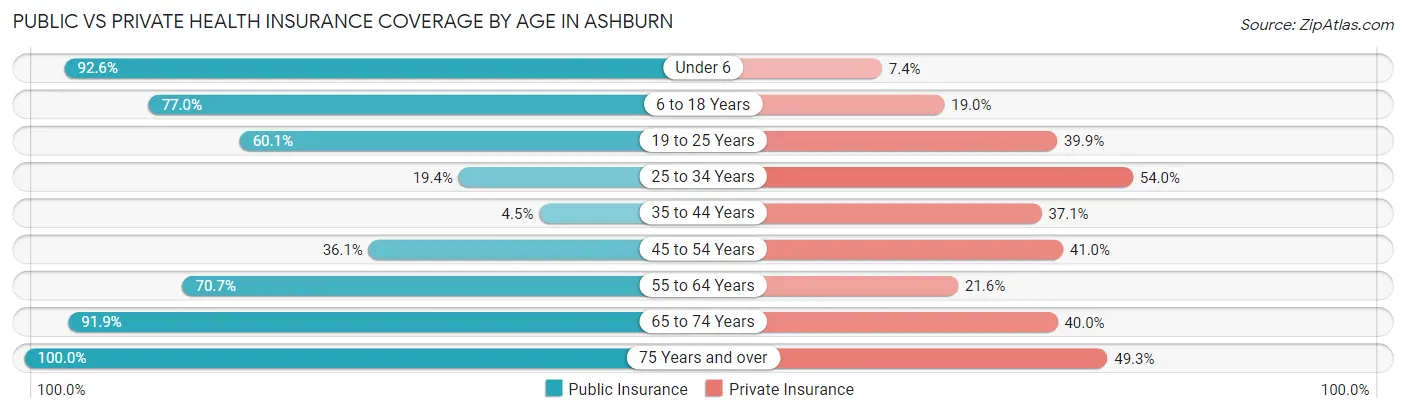
| Age Bracket | Public Insurance | Private Insurance |
| Under 6 | 349 (92.6%) | 28 (7.4%) |
| 6 to 18 Years | 631 (76.9%) | 156 (19.0%) |
| 19 to 25 Years | 185 (60.1%) | 123 (39.9%) |
| 25 to 34 Years | 87 (19.4%) | 242 (54.0%) |
| 35 to 44 Years | 14 (4.5%) | 116 (37.1%) |
| 45 to 54 Years | 155 (36.1%) | 176 (41.0%) |
| 55 to 64 Years | 465 (70.7%) | 142 (21.6%) |
| 65 to 74 Years | 553 (91.9%) | 241 (40.0%) |
| 75 Years and over | 207 (100.0%) | 102 (49.3%) |
| Total | 2,646 (63.6%) | 1,326 (31.9%) |
Disability Status by Sex by Age in Ashburn
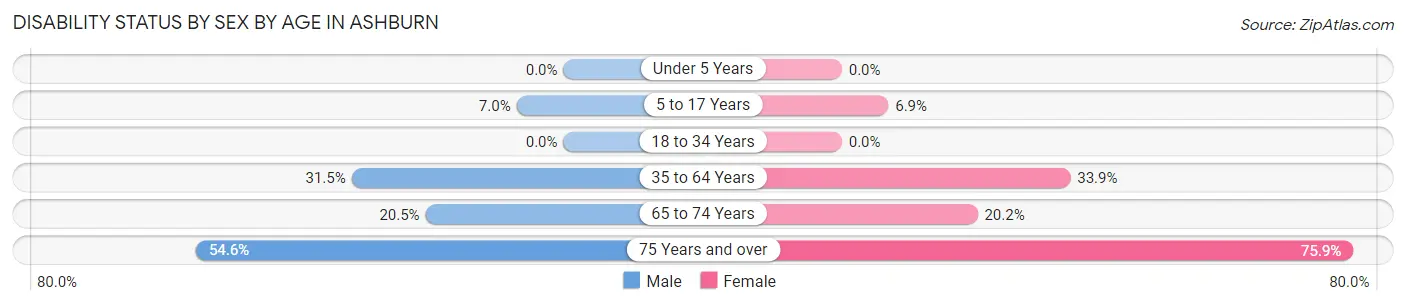
| Age Bracket | Male | Female |
| Under 5 Years | 0 (0.0%) | 0 (0.0%) |
| 5 to 17 Years | 24 (7.0%) | 31 (6.9%) |
| 18 to 34 Years | 0 (0.0%) | 0 (0.0%) |
| 35 to 64 Years | 228 (31.5%) | 229 (33.9%) |
| 65 to 74 Years | 43 (20.5%) | 79 (20.2%) |
| 75 Years and over | 54 (54.5%) | 82 (75.9%) |
Disability Class by Sex by Age in Ashburn
Disability Class: Hearing Difficulty
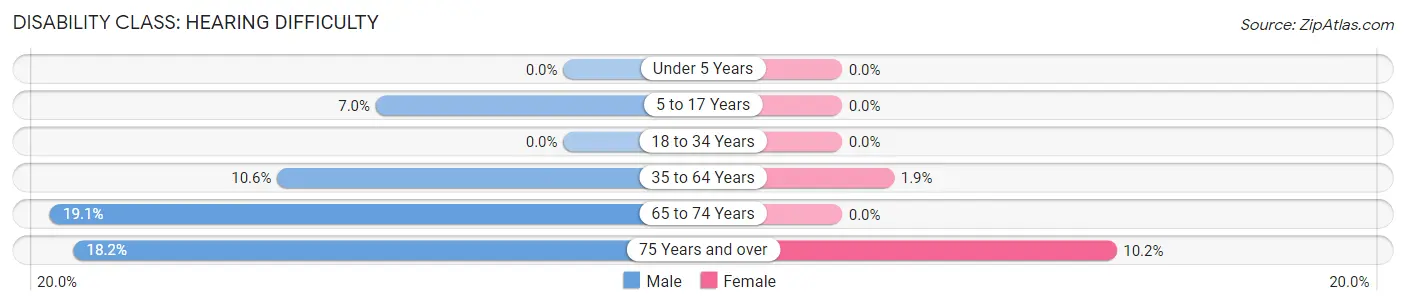
| Age Bracket | Male | Female |
| Under 5 Years | 0 (0.0%) | 0 (0.0%) |
| 5 to 17 Years | 24 (7.0%) | 0 (0.0%) |
| 18 to 34 Years | 0 (0.0%) | 0 (0.0%) |
| 35 to 64 Years | 77 (10.6%) | 13 (1.9%) |
| 65 to 74 Years | 40 (19.1%) | 0 (0.0%) |
| 75 Years and over | 18 (18.2%) | 11 (10.2%) |
Disability Class: Vision Difficulty
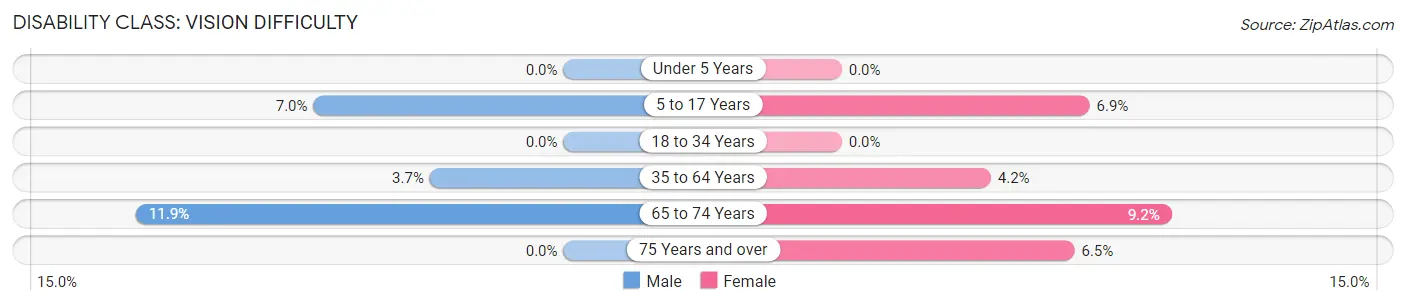
| Age Bracket | Male | Female |
| Under 5 Years | 0 (0.0%) | 0 (0.0%) |
| 5 to 17 Years | 24 (7.0%) | 31 (6.9%) |
| 18 to 34 Years | 0 (0.0%) | 0 (0.0%) |
| 35 to 64 Years | 27 (3.7%) | 28 (4.2%) |
| 65 to 74 Years | 25 (11.9%) | 36 (9.2%) |
| 75 Years and over | 0 (0.0%) | 7 (6.5%) |
Disability Class: Cognitive Difficulty
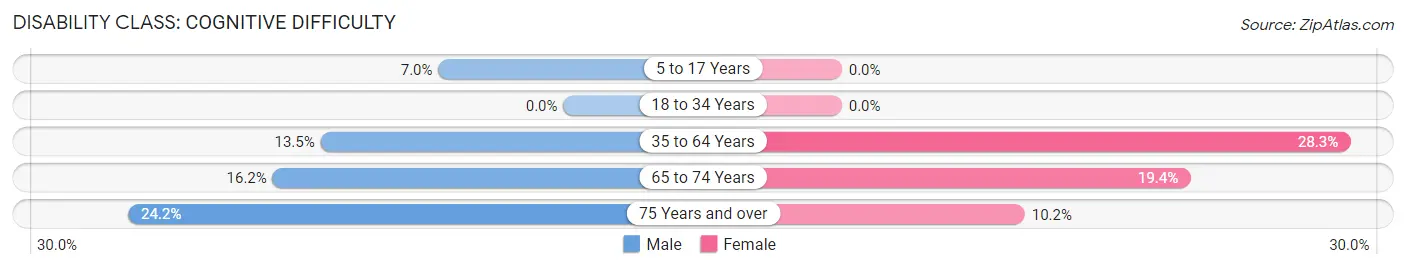
| Age Bracket | Male | Female |
| 5 to 17 Years | 24 (7.0%) | 0 (0.0%) |
| 18 to 34 Years | 0 (0.0%) | 0 (0.0%) |
| 35 to 64 Years | 98 (13.5%) | 191 (28.3%) |
| 65 to 74 Years | 34 (16.2%) | 76 (19.4%) |
| 75 Years and over | 24 (24.2%) | 11 (10.2%) |
Disability Class: Ambulatory Difficulty
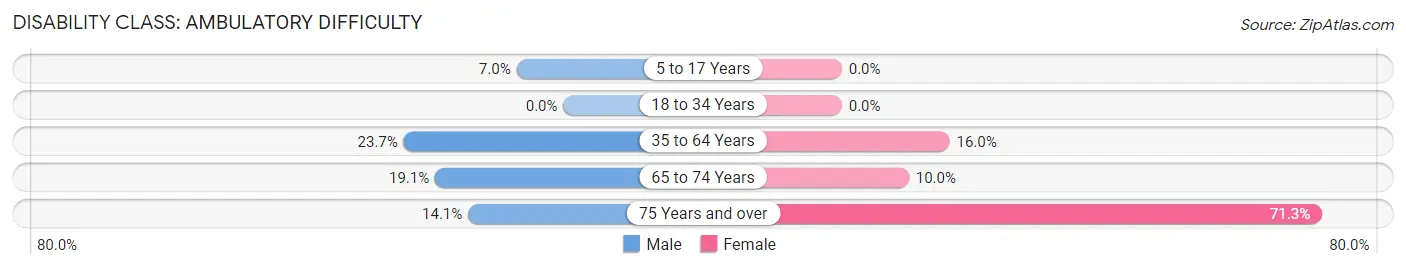
| Age Bracket | Male | Female |
| 5 to 17 Years | 24 (7.0%) | 0 (0.0%) |
| 18 to 34 Years | 0 (0.0%) | 0 (0.0%) |
| 35 to 64 Years | 172 (23.7%) | 108 (16.0%) |
| 65 to 74 Years | 40 (19.1%) | 39 (10.0%) |
| 75 Years and over | 14 (14.1%) | 77 (71.3%) |
Disability Class: Self-Care Difficulty
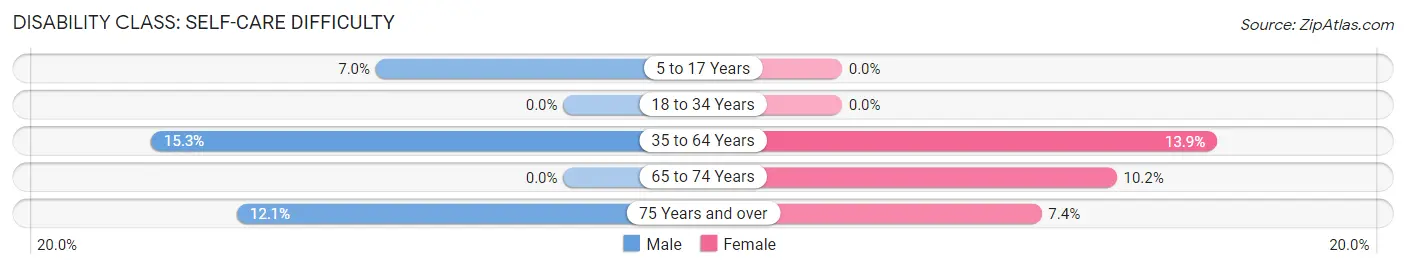
| Age Bracket | Male | Female |
| 5 to 17 Years | 24 (7.0%) | 0 (0.0%) |
| 18 to 34 Years | 0 (0.0%) | 0 (0.0%) |
| 35 to 64 Years | 111 (15.3%) | 94 (13.9%) |
| 65 to 74 Years | 0 (0.0%) | 40 (10.2%) |
| 75 Years and over | 12 (12.1%) | 8 (7.4%) |
Technology Access in Ashburn
Computing Device Access in Ashburn
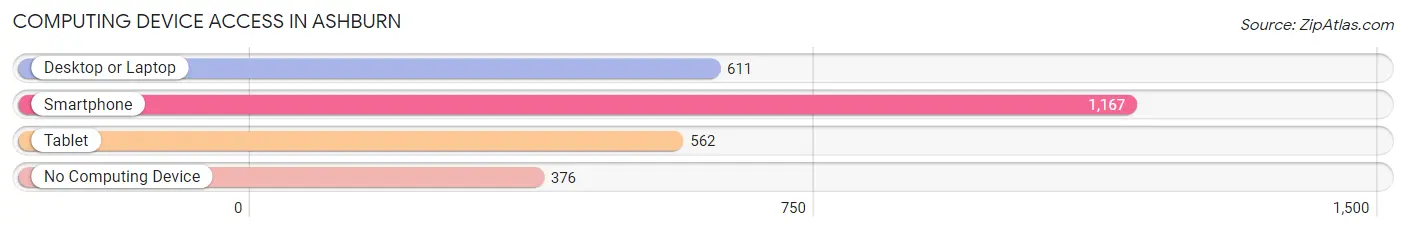
| Device Type | # Households | % Households |
| Desktop or Laptop | 611 | 38.5% |
| Smartphone | 1,167 | 73.4% |
| Tablet | 562 | 35.4% |
| No Computing Device | 376 | 23.7% |
| Total | 1,589 | 100.0% |
Internet Access in Ashburn
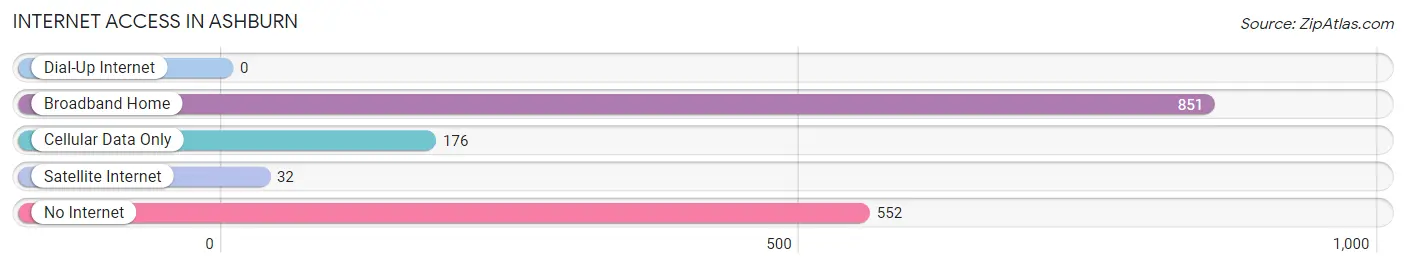
| Internet Type | # Households | % Households |
| Dial-Up Internet | 0 | 0.0% |
| Broadband Home | 851 | 53.6% |
| Cellular Data Only | 176 | 11.1% |
| Satellite Internet | 32 | 2.0% |
| No Internet | 552 | 34.7% |
| Total | 1,589 | 100.0% |
Ashburn Summary
Ashburn, Georgia is a small city located in Turner County, in the southwestern part of the state. It is situated about halfway between Macon and Albany, and is part of the Albany metropolitan area. The city has a population of approximately 4,000 people, and is the county seat of Turner County.
History
The area that is now Ashburn was first settled in the early 1800s by settlers from North Carolina. The town was originally known as "Turner's Crossroads," and was named after the Turner family, who were among the first settlers in the area. In 1854, the town was officially incorporated as Ashburn, and the name was chosen in honor of a local family who had served in the Revolutionary War.
In the late 1800s, Ashburn was a thriving agricultural center, with cotton, corn, and tobacco being the main crops. The town also had a number of small businesses, including a sawmill, a gristmill, and a cotton gin. In the early 1900s, the town began to experience a period of growth, with the construction of a railroad line and the opening of a number of new businesses.
Geography
Ashburn is located in the southwestern part of Georgia, in Turner County. The city is situated about halfway between Macon and Albany, and is part of the Albany metropolitan area. The city is located at the intersection of U.S. Route 41 and Georgia State Route 32. The city is situated on the banks of the Flint River, and is surrounded by rolling hills and farmland.
Economy
The economy of Ashburn is largely based on agriculture and manufacturing. The city is home to a number of agricultural businesses, including a number of farms and nurseries. The city is also home to a number of manufacturing businesses, including a furniture factory, a plastics factory, and a paper mill. In addition, the city is home to a number of retail businesses, including a number of antique stores and specialty shops.
Demographics
As of the 2010 census, the population of Ashburn was 4,000. The racial makeup of the city was 79.3% White, 17.2% African American, 0.3% Native American, 0.7% Asian, 0.1% Pacific Islander, and 2.4% from other races. The median household income in the city was $30,000, and the median family income was $35,000. The per capita income in the city was $15,000. The unemployment rate in the city was 8.2%.
Conclusion
Ashburn, Georgia is a small city located in Turner County, in the southwestern part of the state. It is situated about halfway between Macon and Albany, and is part of the Albany metropolitan area. The city has a population of approximately 4,000 people, and is the county seat of Turner County. The economy of Ashburn is largely based on agriculture and manufacturing, and the city is home to a number of retail businesses. The racial makeup of the city is 79.3% White, 17.2% African American, 0.3% Native American, 0.7% Asian, 0.1% Pacific Islander, and 2.4% from other races. The median household income in the city was $30,000, and the median family income was $35,000. The per capita income in the city was $15,000. The unemployment rate in the city was 8.2%.
Common Questions
What is Per Capita Income in Ashburn?
Per Capita income in Ashburn is $20,175.
What is the Median Family Income in Ashburn?
Median Family Income in Ashburn is $40,238.
What is the Median Household income in Ashburn?
Median Household Income in Ashburn is $35,987.
What is Income or Wage Gap in Ashburn?
Income or Wage Gap in Ashburn is 42.7%.
Women in Ashburn earn 57.3 cents for every dollar earned by a man.
What is Inequality or Gini Index in Ashburn?
Inequality or Gini Index in Ashburn is 0.42.
What is the Total Population of Ashburn?
Total Population of Ashburn is 4,223.
What is the Total Male Population of Ashburn?
Total Male Population of Ashburn is 2,021.
What is the Total Female Population of Ashburn?
Total Female Population of Ashburn is 2,202.
What is the Ratio of Males per 100 Females in Ashburn?
There are 91.78 Males per 100 Females in Ashburn.
What is the Ratio of Females per 100 Males in Ashburn?
There are 108.96 Females per 100 Males in Ashburn.
What is the Median Population Age in Ashburn?
Median Population Age in Ashburn is 39.9 Years.
What is the Average Family Size in Ashburn
Average Family Size in Ashburn is 3.6 People.
What is the Average Household Size in Ashburn
Average Household Size in Ashburn is 2.6 People.
How Large is the Labor Force in Ashburn?
There are 1,610 People in the Labor Forcein in Ashburn.
What is the Percentage of People in the Labor Force in Ashburn?
49.1% of People are in the Labor Force in Ashburn.
What is the Unemployment Rate in Ashburn?
Unemployment Rate in Ashburn is 10.8%.