Midville, GA Map & Demographics
Midville Map
Midville Overview
$19,292
PER CAPITA INCOME
$41,875
AVG HOUSEHOLD INCOME
0.45
INEQUALITY / GINI INDEX
423
TOTAL POPULATION
245
MALE POPULATION
178
FEMALE POPULATION
137.64
MALES / 100 FEMALES
72.65
FEMALES / 100 MALES
34.0
MEDIAN AGE
4.1
AVG FAMILY SIZE
2.5
AVG HOUSEHOLD SIZE
207
LABOR FORCE [ PEOPLE ]
67.6%
PERCENT IN LABOR FORCE
12.1%
UNEMPLOYMENT RATE
Midville Zip Codes
Midville Area Codes
Income in Midville
Income Overview in Midville
| Characteristic | Number | Measure |
| Per Capita Income | 423 | $19,292 |
| Median Family Income | 71 | $0 |
| Mean Family Income | 71 | $53,077 |
| Median Household Income | 167 | $41,875 |
| Mean Household Income | 167 | $42,915 |
| Income Deficit | 71 | $0 |
| Wage / Income Gap (%) | 423 | 0.00% |
| Wage / Income Gap ($) | 423 | 100.00¢ per $1 |
| Gini / Inequality Index | 423 | 0.45 |
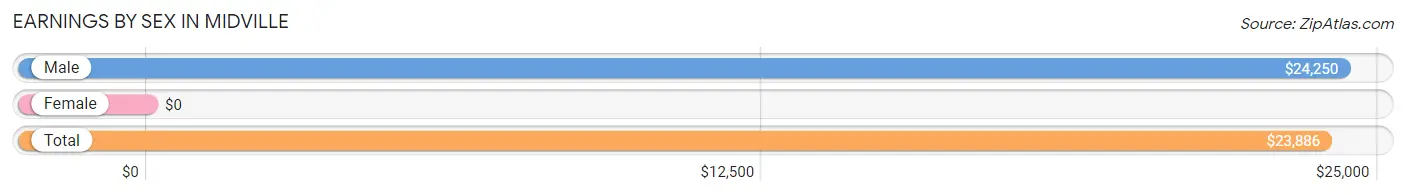
Earnings by Sex in Midville
| Sex | Number | Average Earnings |
| Male | 135 (68.5%) | $24,250 |
| Female | 62 (31.5%) | $0 |
| Total | 197 (100.0%) | $23,886 |
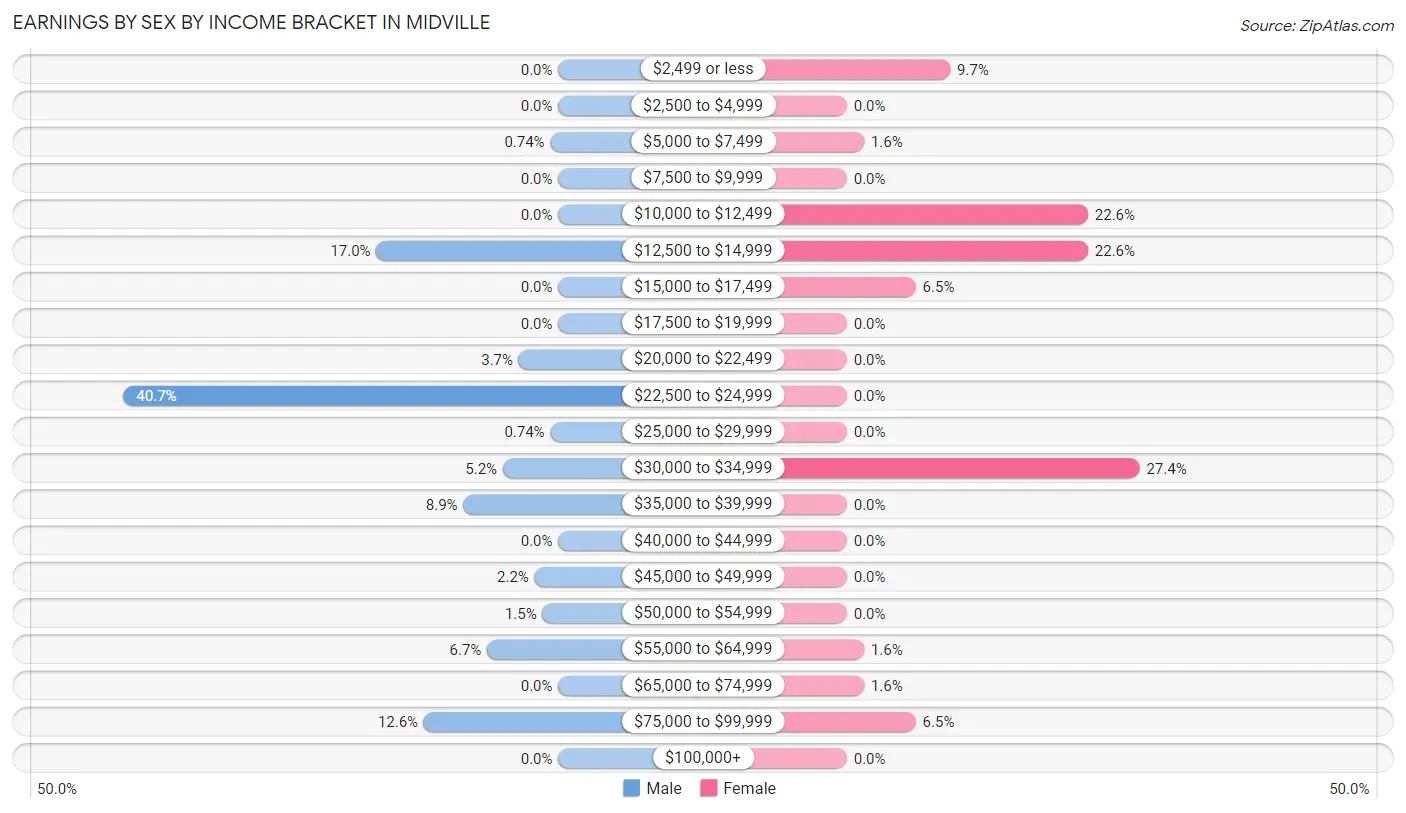
Earnings by Sex by Income Bracket in Midville
The most common earnings brackets in Midville are $22,500 to $24,999 for men (55 | 40.7%) and $30,000 to $34,999 for women (17 | 27.4%).
| Income | Male | Female |
| $2,499 or less | 0 (0.0%) | 6 (9.7%) |
| $2,500 to $4,999 | 0 (0.0%) | 0 (0.0%) |
| $5,000 to $7,499 | 1 (0.7%) | 1 (1.6%) |
| $7,500 to $9,999 | 0 (0.0%) | 0 (0.0%) |
| $10,000 to $12,499 | 0 (0.0%) | 14 (22.6%) |
| $12,500 to $14,999 | 23 (17.0%) | 14 (22.6%) |
| $15,000 to $17,499 | 0 (0.0%) | 4 (6.5%) |
| $17,500 to $19,999 | 0 (0.0%) | 0 (0.0%) |
| $20,000 to $22,499 | 5 (3.7%) | 0 (0.0%) |
| $22,500 to $24,999 | 55 (40.7%) | 0 (0.0%) |
| $25,000 to $29,999 | 1 (0.7%) | 0 (0.0%) |
| $30,000 to $34,999 | 7 (5.2%) | 17 (27.4%) |
| $35,000 to $39,999 | 12 (8.9%) | 0 (0.0%) |
| $40,000 to $44,999 | 0 (0.0%) | 0 (0.0%) |
| $45,000 to $49,999 | 3 (2.2%) | 0 (0.0%) |
| $50,000 to $54,999 | 2 (1.5%) | 0 (0.0%) |
| $55,000 to $64,999 | 9 (6.7%) | 1 (1.6%) |
| $65,000 to $74,999 | 0 (0.0%) | 1 (1.6%) |
| $75,000 to $99,999 | 17 (12.6%) | 4 (6.5%) |
| $100,000+ | 0 (0.0%) | 0 (0.0%) |
| Total | 135 (100.0%) | 62 (100.0%) |
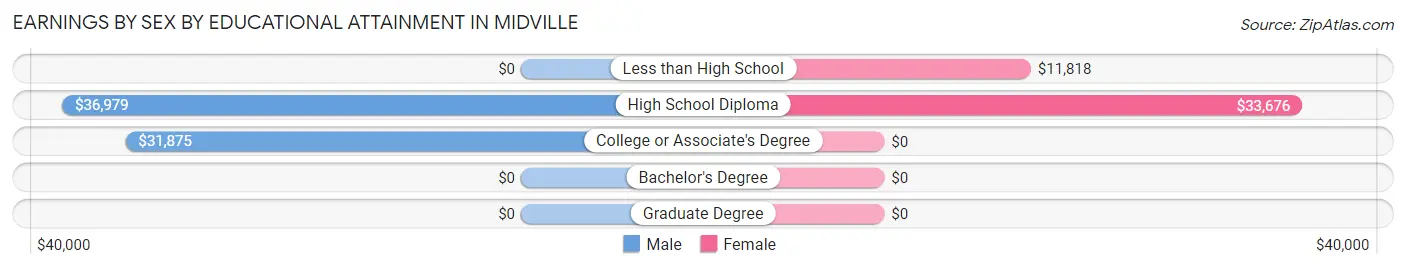
Earnings by Sex by Educational Attainment in Midville
| Educational Attainment | Male Income | Female Income |
| Less than High School | - | - |
| High School Diploma | $36,979 | $33,676 |
| College or Associate's Degree | $31,875 | $0 |
| Bachelor's Degree | - | - |
| Graduate Degree | - | - |
| Total | $31,786 | $0 |
Family Income in Midville
Family Income Brackets in Midville
According to the Midville family income data, there are 21 families falling into the $15,000 to $24,999 income range, which is the most common income bracket and makes up 29.6% of all families.
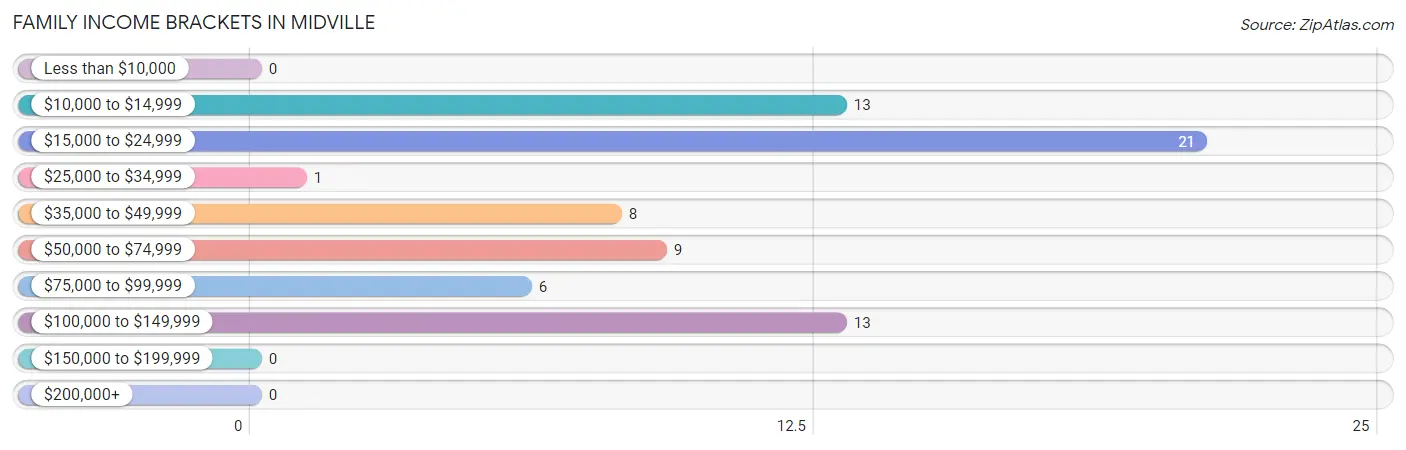
| Income Bracket | # Families | % Families |
| Less than $10,000 | 0 | 0.0% |
| $10,000 to $14,999 | 13 | 18.3% |
| $15,000 to $24,999 | 21 | 29.6% |
| $25,000 to $34,999 | 1 | 1.4% |
| $35,000 to $49,999 | 8 | 11.3% |
| $50,000 to $74,999 | 9 | 12.7% |
| $75,000 to $99,999 | 6 | 8.5% |
| $100,000 to $149,999 | 13 | 18.3% |
| $150,000 to $199,999 | 0 | 0.0% |
| $200,000+ | 0 | 0.0% |
Family Income by Famaliy Size in Midville
| Income Bracket | # Families | Median Income |
| 2-Person Families | 23 (32.4%) | $0 |
| 3-Person Families | 26 (36.6%) | $0 |
| 4-Person Families | 5 (7.0%) | $0 |
| 5-Person Families | 17 (23.9%) | $0 |
| 6-Person Families | 0 (0.0%) | $0 |
| 7+ Person Families | 0 (0.0%) | $0 |
| Total | 71 (100.0%) | $0 |
Family Income by Number of Earners in Midville
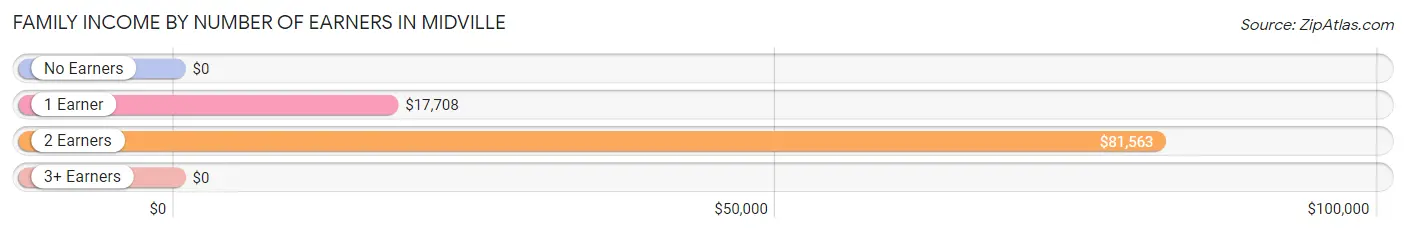
| Number of Earners | # Families | Median Income |
| No Earners | 14 (19.7%) | $0 |
| 1 Earner | 36 (50.7%) | $17,708 |
| 2 Earners | 9 (12.7%) | $81,563 |
| 3+ Earners | 12 (16.9%) | $0 |
| Total | 71 (100.0%) | $0 |
Household Income in Midville
Household Income Brackets in Midville
With 41 households falling in the category, the $50,000 to $74,999 income range is the most frequent in Midville, accounting for 24.5% of all households.
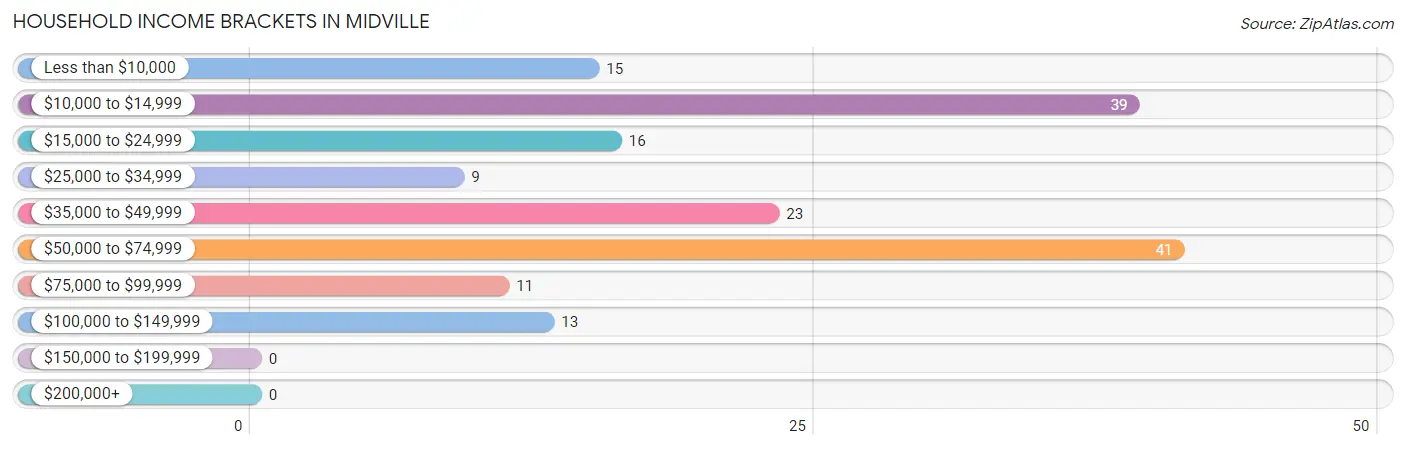
| Income Bracket | # Households | % Households |
| Less than $10,000 | 15 | 9.0% |
| $10,000 to $14,999 | 39 | 23.4% |
| $15,000 to $24,999 | 16 | 9.6% |
| $25,000 to $34,999 | 9 | 5.4% |
| $35,000 to $49,999 | 23 | 13.8% |
| $50,000 to $74,999 | 41 | 24.6% |
| $75,000 to $99,999 | 11 | 6.6% |
| $100,000 to $149,999 | 13 | 7.8% |
| $150,000 to $199,999 | 0 | 0.0% |
| $200,000+ | 0 | 0.0% |
Household Income by Householder Age in Midville
The median household income in Midville is $41,875, with the highest median household income of $50,375 found in the 25 to 44 years age bracket for the primary householder. A total of 49 households (29.3%) fall into this category.
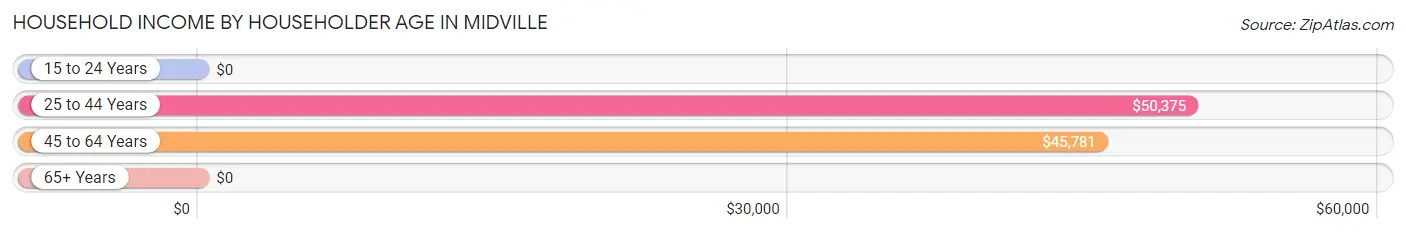
| Income Bracket | # Households | Median Income |
| 15 to 24 Years | 0 (0.0%) | $0 |
| 25 to 44 Years | 49 (29.3%) | $50,375 |
| 45 to 64 Years | 75 (44.9%) | $45,781 |
| 65+ Years | 43 (25.8%) | $0 |
| Total | 167 (100.0%) | $41,875 |
Poverty in Midville
Income Below Poverty by Sex and Age in Midville
With 42.4% poverty level for males and 57.3% for females among the residents of Midville, under 5 year old males and under 5 year old females are the most vulnerable to poverty, with 15 males (100.0%) and 24 females (100.0%) in their respective age groups living below the poverty level.
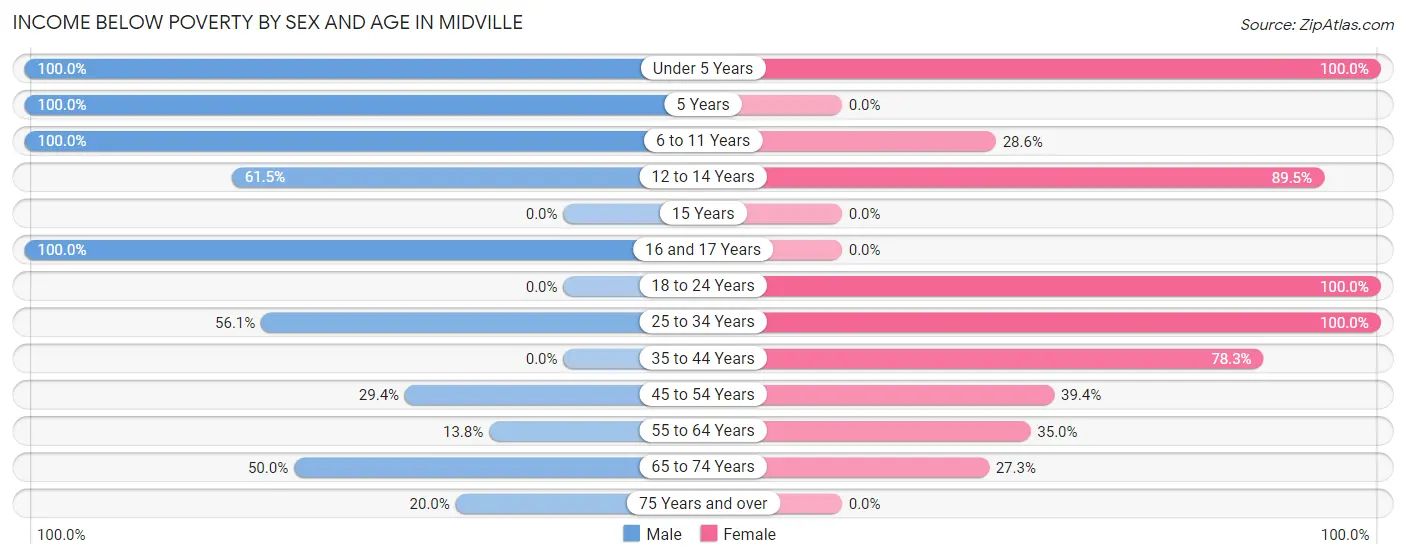
| Age Bracket | Male | Female |
| Under 5 Years | 15 (100.0%) | 24 (100.0%) |
| 5 Years | 15 (100.0%) | 0 (0.0%) |
| 6 to 11 Years | 15 (100.0%) | 2 (28.6%) |
| 12 to 14 Years | 8 (61.5%) | 17 (89.5%) |
| 15 Years | 0 (0.0%) | 0 (0.0%) |
| 16 and 17 Years | 5 (100.0%) | 0 (0.0%) |
| 18 to 24 Years | 0 (0.0%) | 2 (100.0%) |
| 25 to 34 Years | 23 (56.1%) | 16 (100.0%) |
| 35 to 44 Years | 0 (0.0%) | 18 (78.3%) |
| 45 to 54 Years | 5 (29.4%) | 13 (39.4%) |
| 55 to 64 Years | 4 (13.8%) | 7 (35.0%) |
| 65 to 74 Years | 12 (50.0%) | 3 (27.3%) |
| 75 Years and over | 2 (20.0%) | 0 (0.0%) |
| Total | 104 (42.4%) | 102 (57.3%) |
Income Above Poverty by Sex and Age in Midville
According to the poverty statistics in Midville, males aged 18 to 24 years and females aged 15 years are the age groups that are most secure financially, with 100.0% of males and 100.0% of females in these age groups living above the poverty line.
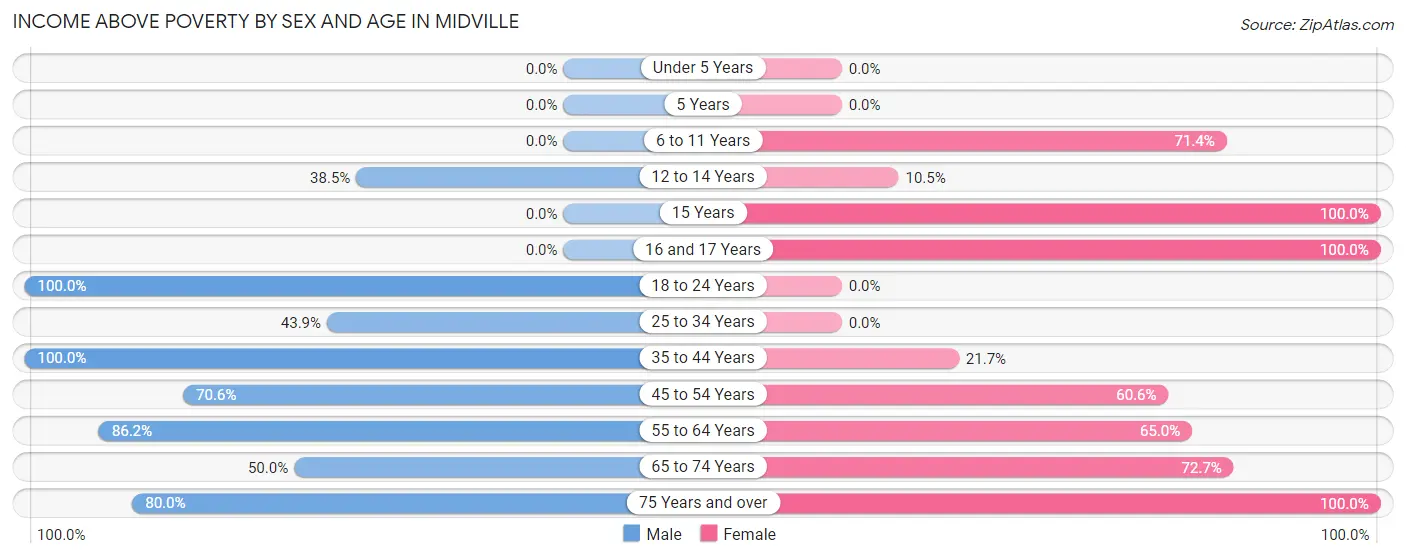
| Age Bracket | Male | Female |
| Under 5 Years | 0 (0.0%) | 0 (0.0%) |
| 5 Years | 0 (0.0%) | 0 (0.0%) |
| 6 to 11 Years | 0 (0.0%) | 5 (71.4%) |
| 12 to 14 Years | 5 (38.5%) | 2 (10.5%) |
| 15 Years | 0 (0.0%) | 9 (100.0%) |
| 16 and 17 Years | 0 (0.0%) | 3 (100.0%) |
| 18 to 24 Years | 45 (100.0%) | 0 (0.0%) |
| 25 to 34 Years | 18 (43.9%) | 0 (0.0%) |
| 35 to 44 Years | 16 (100.0%) | 5 (21.7%) |
| 45 to 54 Years | 12 (70.6%) | 20 (60.6%) |
| 55 to 64 Years | 25 (86.2%) | 13 (65.0%) |
| 65 to 74 Years | 12 (50.0%) | 8 (72.7%) |
| 75 Years and over | 8 (80.0%) | 11 (100.0%) |
| Total | 141 (57.6%) | 76 (42.7%) |
Income Below Poverty Among Married-Couple Families in Midville
The poverty statistics for married-couple families in Midville show that 11.9% or 5 of the total 42 families live below the poverty line. Families with 3 or 4 children have the highest poverty rate of 100.0%, comprising of 5 families. On the other hand, families with no children have the lowest poverty rate of 0.0%, which includes 0 families.
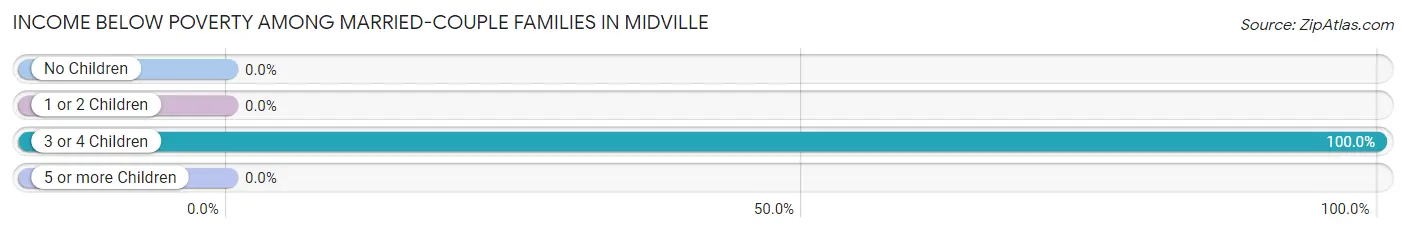
| Children | Above Poverty | Below Poverty |
| No Children | 22 (100.0%) | 0 (0.0%) |
| 1 or 2 Children | 15 (100.0%) | 0 (0.0%) |
| 3 or 4 Children | 0 (0.0%) | 5 (100.0%) |
| 5 or more Children | 0 (0.0%) | 0 (0.0%) |
| Total | 37 (88.1%) | 5 (11.9%) |
Income Below Poverty Among Single-Parent Households in Midville
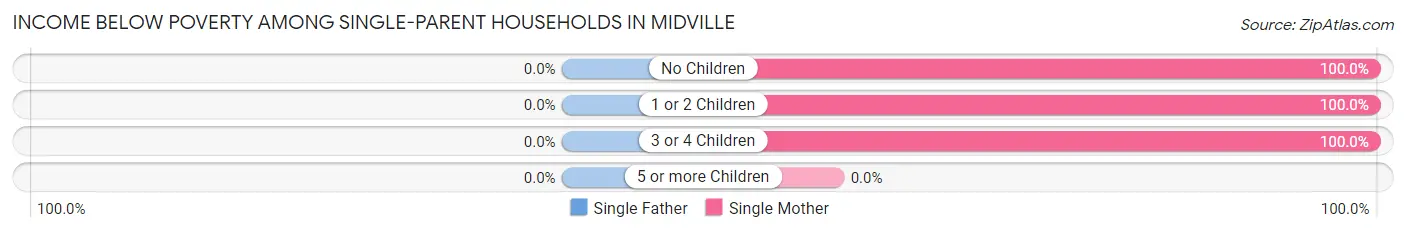
| Children | Single Father | Single Mother |
| No Children | 0 (0.0%) | 2 (100.0%) |
| 1 or 2 Children | 0 (0.0%) | 15 (100.0%) |
| 3 or 4 Children | 0 (0.0%) | 12 (100.0%) |
| 5 or more Children | 0 (0.0%) | 0 (0.0%) |
| Total | 0 (0.0%) | 29 (100.0%) |
Income Below Poverty Among Married-Couple vs Single-Parent Households in Midville
The poverty data for Midville shows that 5 of the married-couple family households (11.9%) and 29 of the single-parent households (100.0%) are living below the poverty level. Within the married-couple family households, those with 3 or 4 children have the highest poverty rate, with 5 households (100.0%) falling below the poverty line. Among the single-parent households, those with no children have the highest poverty rate, with 2 household (100.0%) living below poverty.
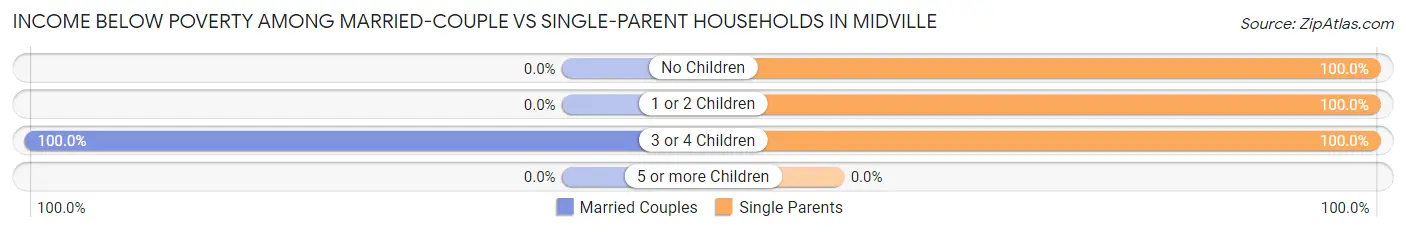
| Children | Married-Couple Families | Single-Parent Households |
| No Children | 0 (0.0%) | 2 (100.0%) |
| 1 or 2 Children | 0 (0.0%) | 15 (100.0%) |
| 3 or 4 Children | 5 (100.0%) | 12 (100.0%) |
| 5 or more Children | 0 (0.0%) | 0 (0.0%) |
| Total | 5 (11.9%) | 29 (100.0%) |
Race in Midville
The most populous races in Midville are Black / African American (304 | 71.9%), White / Caucasian (77 | 18.2%), and Hispanic or Latino (40 | 9.5%).
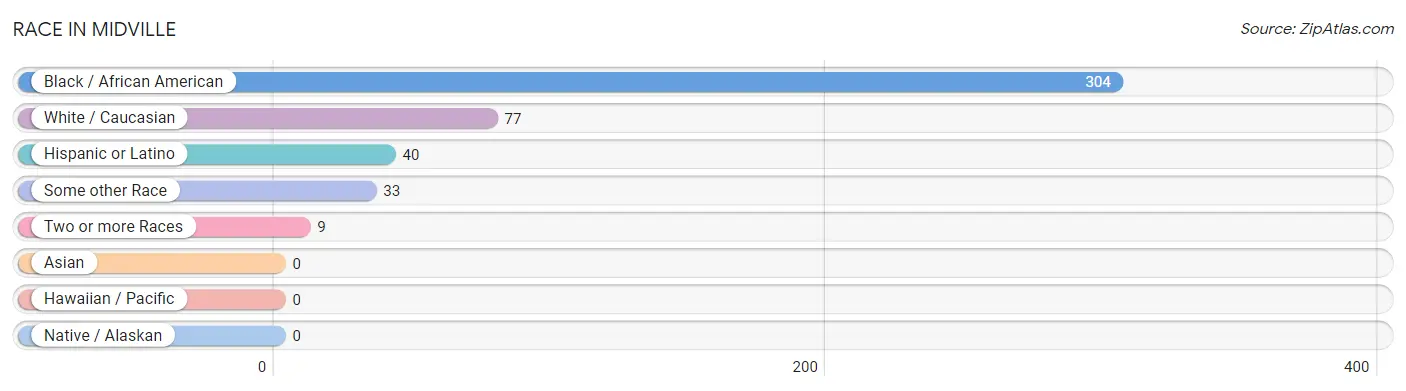
| Race | # Population | % Population |
| Asian | 0 | 0.0% |
| Black / African American | 304 | 71.9% |
| Hawaiian / Pacific | 0 | 0.0% |
| Hispanic or Latino | 40 | 9.5% |
| Native / Alaskan | 0 | 0.0% |
| White / Caucasian | 77 | 18.2% |
| Two or more Races | 9 | 2.1% |
| Some other Race | 33 | 7.8% |
| Total | 423 | 100.0% |
Ancestry in Midville
The most populous ancestries reported in Midville are Mexican (40 | 9.5%), English (13 | 3.1%), British (12 | 2.8%), American (9 | 2.1%), and Irish (6 | 1.4%), together accounting for 18.9% of all Midville residents.
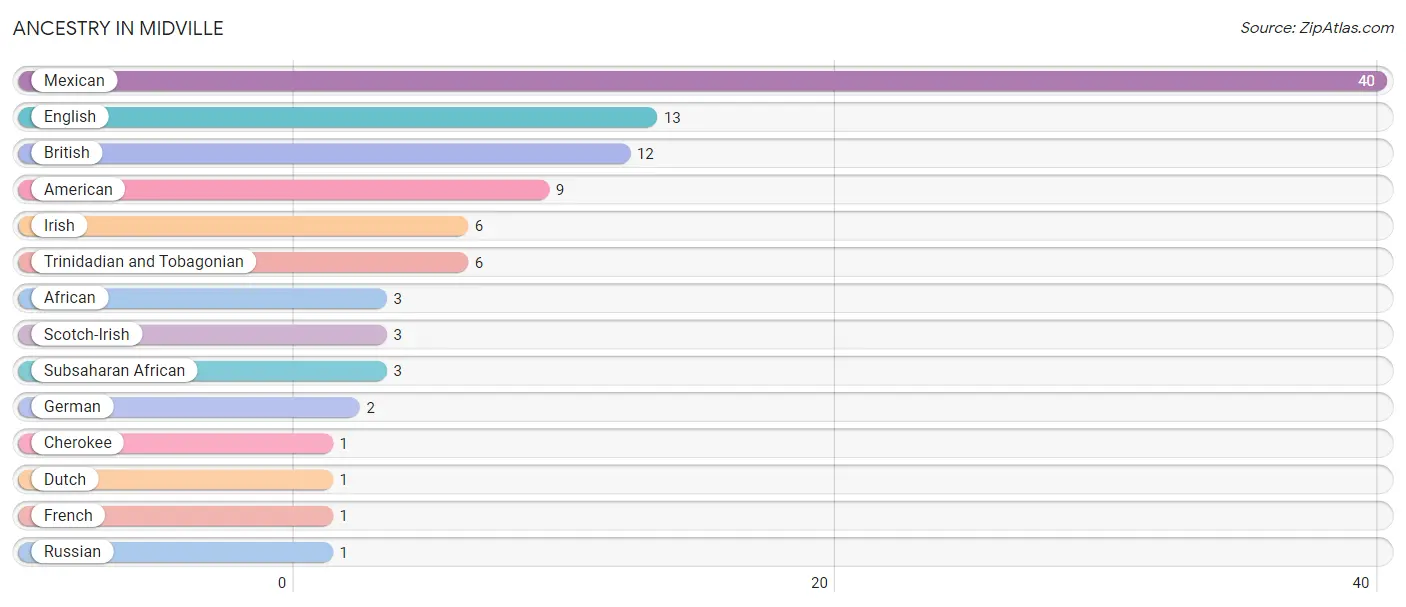
| Ancestry | # Population | % Population |
| African | 3 | 0.7% |
| American | 9 | 2.1% |
| British | 12 | 2.8% |
| Cherokee | 1 | 0.2% |
| Dutch | 1 | 0.2% |
| English | 13 | 3.1% |
| French | 1 | 0.2% |
| German | 2 | 0.5% |
| Irish | 6 | 1.4% |
| Mexican | 40 | 9.5% |
| Russian | 1 | 0.2% |
| Scotch-Irish | 3 | 0.7% |
| Subsaharan African | 3 | 0.7% |
| Trinidadian and Tobagonian | 6 | 1.4% | View All 14 Rows |
Immigrants in Midville
The most numerous immigrant groups reported in Midville came from Central America (34 | 8.0%), Latin America (34 | 8.0%), and Mexico (34 | 8.0%), together accounting for 24.1% of all Midville residents.
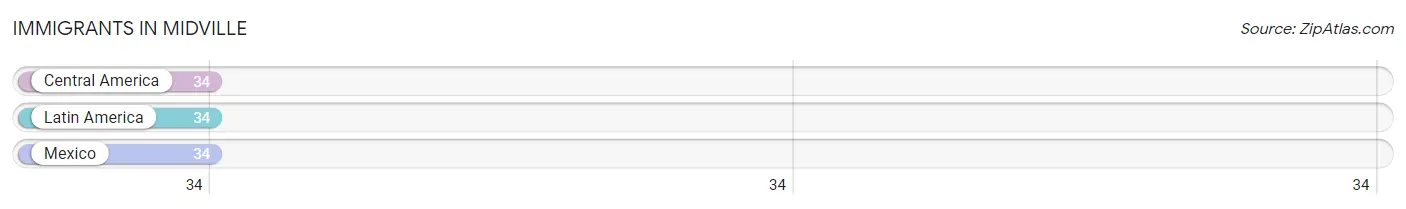
| Immigration Origin | # Population | % Population |
| Central America | 34 | 8.0% |
| Latin America | 34 | 8.0% |
| Mexico | 34 | 8.0% | View All 3 Rows |
Sex and Age in Midville
Sex and Age in Midville
The most populous age groups in Midville are 15 to 19 Years (50 | 20.4%) for men and Under 5 Years (24 | 13.5%) for women.
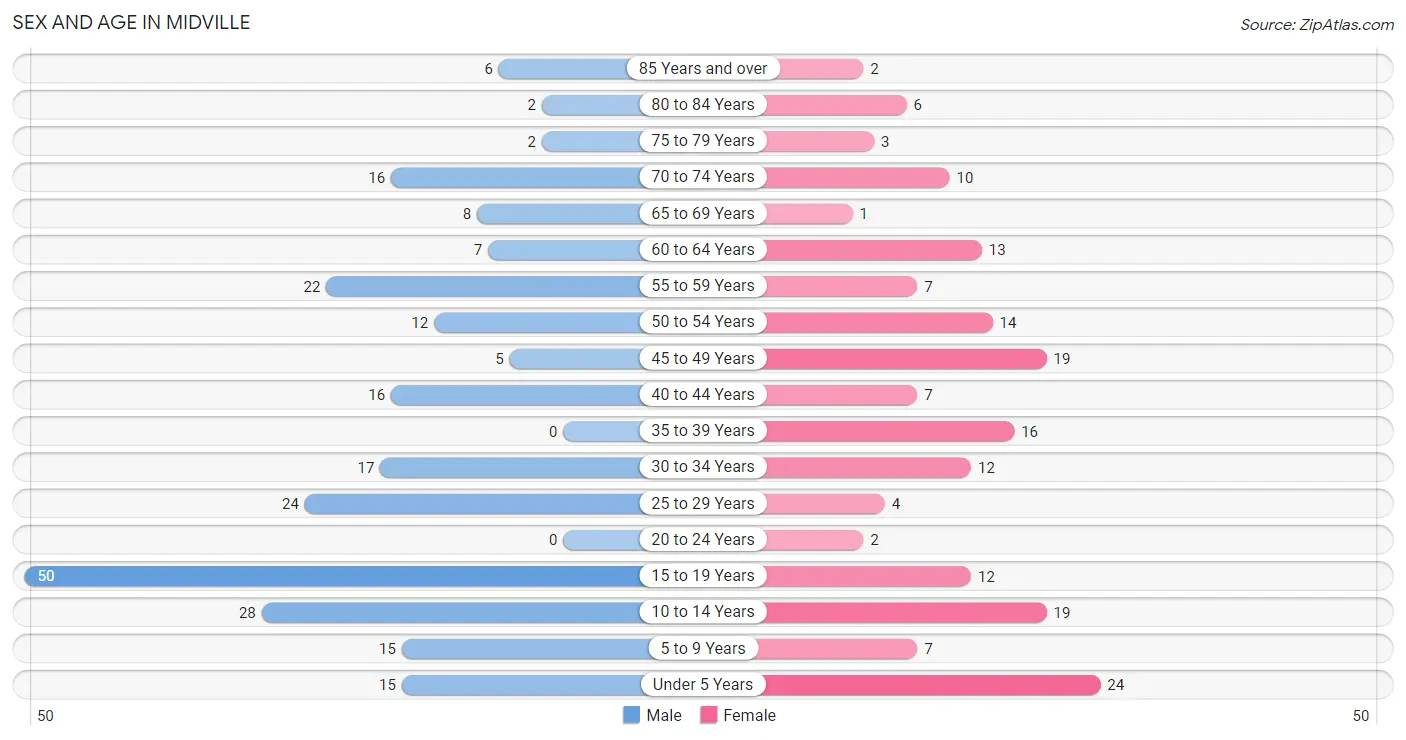
| Age Bracket | Male | Female |
| Under 5 Years | 15 (6.1%) | 24 (13.5%) |
| 5 to 9 Years | 15 (6.1%) | 7 (3.9%) |
| 10 to 14 Years | 28 (11.4%) | 19 (10.7%) |
| 15 to 19 Years | 50 (20.4%) | 12 (6.7%) |
| 20 to 24 Years | 0 (0.0%) | 2 (1.1%) |
| 25 to 29 Years | 24 (9.8%) | 4 (2.2%) |
| 30 to 34 Years | 17 (6.9%) | 12 (6.7%) |
| 35 to 39 Years | 0 (0.0%) | 16 (9.0%) |
| 40 to 44 Years | 16 (6.5%) | 7 (3.9%) |
| 45 to 49 Years | 5 (2.0%) | 19 (10.7%) |
| 50 to 54 Years | 12 (4.9%) | 14 (7.9%) |
| 55 to 59 Years | 22 (9.0%) | 7 (3.9%) |
| 60 to 64 Years | 7 (2.9%) | 13 (7.3%) |
| 65 to 69 Years | 8 (3.3%) | 1 (0.6%) |
| 70 to 74 Years | 16 (6.5%) | 10 (5.6%) |
| 75 to 79 Years | 2 (0.8%) | 3 (1.7%) |
| 80 to 84 Years | 2 (0.8%) | 6 (3.4%) |
| 85 Years and over | 6 (2.5%) | 2 (1.1%) |
| Total | 245 (100.0%) | 178 (100.0%) |
Families and Households in Midville
Median Family Size in Midville
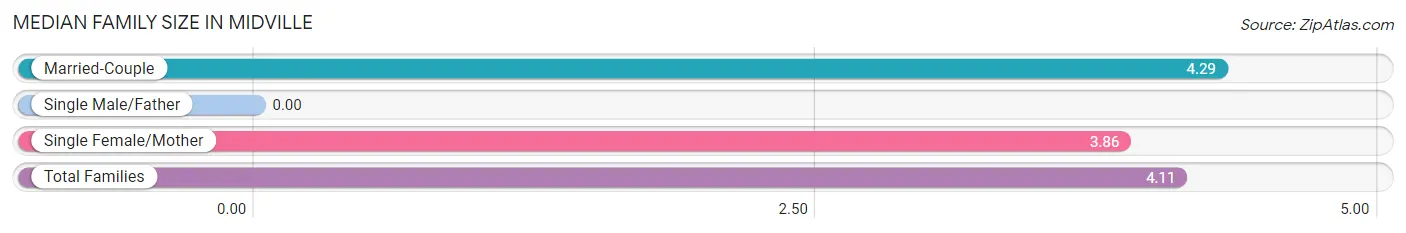
| Family Type | # Families | Family Size |
| Married-Couple | 42 (59.2%) | 4.29 |
| Single Male/Father | 0 (0.0%) | - |
| Single Female/Mother | 29 (40.8%) | 3.86 |
| Total Families | 71 (100.0%) | 4.11 |
Median Household Size in Midville
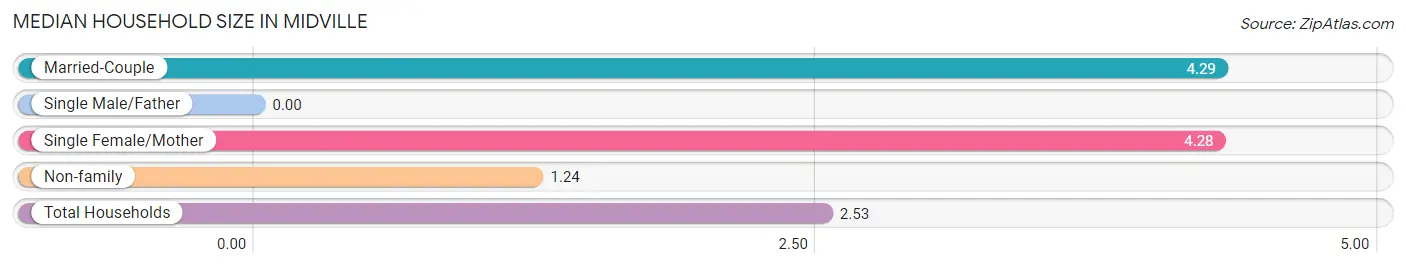
| Household Type | # Households | Household Size |
| Married-Couple | 42 (25.2%) | 4.29 |
| Single Male/Father | 0 (0.0%) | - |
| Single Female/Mother | 29 (17.4%) | 4.28 |
| Non-family | 96 (57.5%) | 1.24 |
| Total Households | 167 (100.0%) | 2.53 |
Household Size by Marriage Status in Midville
Out of a total of 167 households in Midville, 71 (42.5%) are family households, while 96 (57.5%) are nonfamily households. The most numerous type of family households are 3-person households, comprising 26, and the most common type of nonfamily households are 1-person households, comprising 86.
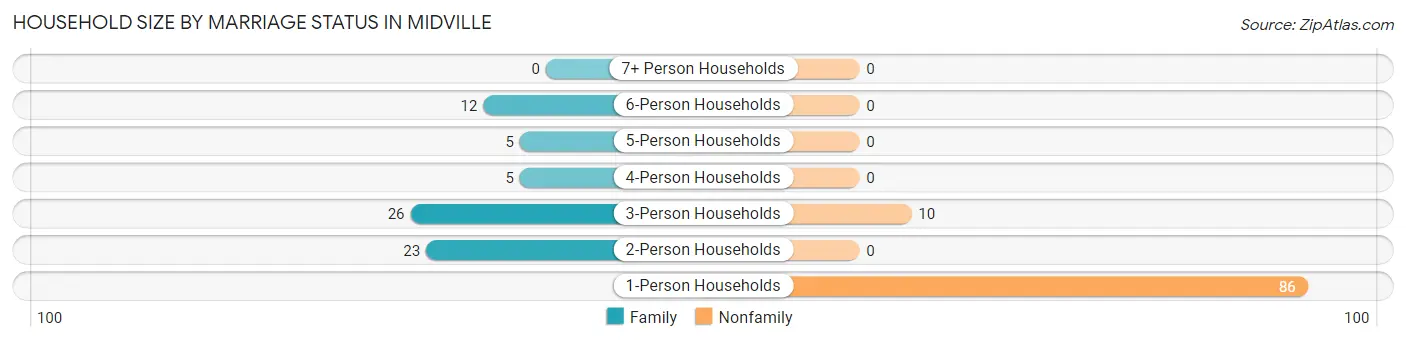
| Household Size | Family Households | Nonfamily Households |
| 1-Person Households | - | 86 (51.5%) |
| 2-Person Households | 23 (13.8%) | 0 (0.0%) |
| 3-Person Households | 26 (15.6%) | 10 (6.0%) |
| 4-Person Households | 5 (3.0%) | 0 (0.0%) |
| 5-Person Households | 5 (3.0%) | 0 (0.0%) |
| 6-Person Households | 12 (7.2%) | 0 (0.0%) |
| 7+ Person Households | 0 (0.0%) | 0 (0.0%) |
| Total | 71 (42.5%) | 96 (57.5%) |
Female Fertility in Midville
Fertility by Age in Midville
| Age Bracket | Women with Births | Births / 1,000 Women |
| 15 to 19 years | 0 (0.0%) | 0.0 |
| 20 to 34 years | 0 (0.0%) | 0.0 |
| 35 to 50 years | 0 (0.0%) | 0.0 |
| Total | 0 (0.0%) | 0.0 |
Fertility by Age by Marriage Status in Midville
| Age Bracket | Married | Unmarried |
| 15 to 19 years | 0 (0.0%) | 0 (0.0%) |
| 20 to 34 years | 0 (0.0%) | 0 (0.0%) |
| 35 to 50 years | 0 (0.0%) | 0 (0.0%) |
| Total | 0 (0.0%) | 0 (0.0%) |
Fertility by Education in Midville
| Educational Attainment | Women with Births | Births / 1,000 Women |
| Less than High School | 0 (0.0%) | 0.0 |
| High School Diploma | 0 (0.0%) | 0.0 |
| College or Associate's Degree | 0 (0.0%) | 0.0 |
| Bachelor's Degree | 0 (0.0%) | 0.0 |
| Graduate Degree | 0 (0.0%) | 0.0 |
| Total | 0 (0.0%) | 0.0 |
Fertility by Education by Marriage Status in Midville
| Educational Attainment | Married | Unmarried |
| Less than High School | 0 (0.0%) | 0 (0.0%) |
| High School Diploma | 0 (0.0%) | 0 (0.0%) |
| College or Associate's Degree | 0 (0.0%) | 0 (0.0%) |
| Bachelor's Degree | 0 (0.0%) | 0 (0.0%) |
| Graduate Degree | 0 (0.0%) | 0 (0.0%) |
| Total | 0 (0.0%) | 0 (0.0%) |
Employment Characteristics in Midville
Employment by Class of Employer in Midville
Among the 182 employed individuals in Midville, private company employees (145 | 79.7%), state government employees (20 | 11.0%), and local government employees (12 | 6.6%) make up the most common classes of employment.
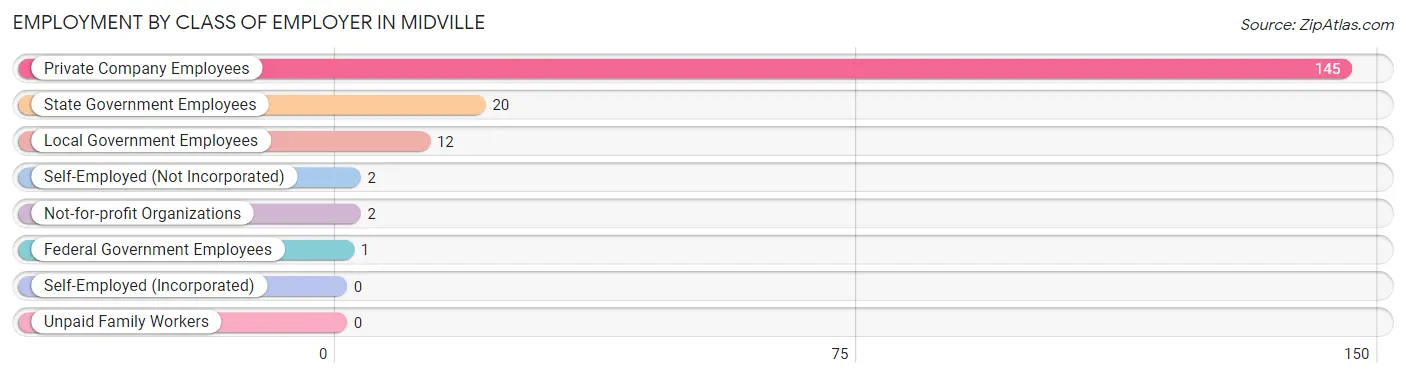
| Employer Class | # Employees | % Employees |
| Private Company Employees | 145 | 79.7% |
| Self-Employed (Incorporated) | 0 | 0.0% |
| Self-Employed (Not Incorporated) | 2 | 1.1% |
| Not-for-profit Organizations | 2 | 1.1% |
| Local Government Employees | 12 | 6.6% |
| State Government Employees | 20 | 11.0% |
| Federal Government Employees | 1 | 0.5% |
| Unpaid Family Workers | 0 | 0.0% |
| Total | 182 | 100.0% |
Employment Status by Age in Midville
According to the labor force statistics for Midville, out of the total population over 16 years of age (306), 67.6% or 207 individuals are in the labor force, with 12.1% or 25 of them unemployed. The age group with the highest labor force participation rate is 20 to 24 years, with 100.0% or 2 individuals in the labor force. Within the labor force, the 20 to 24 years age range has the highest percentage of unemployed individuals, with 100.0% or 2 of them being unemployed.
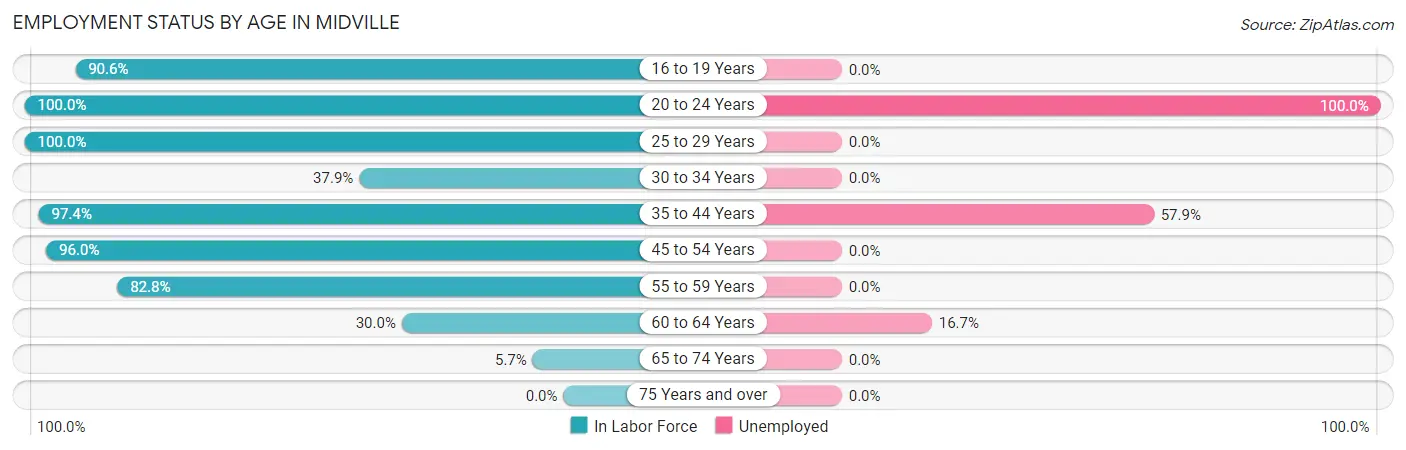
| Age Bracket | In Labor Force | Unemployed |
| 16 to 19 Years | 48 (90.6%) | 0 (0.0%) |
| 20 to 24 Years | 2 (100.0%) | 2 (100.0%) |
| 25 to 29 Years | 28 (100.0%) | 0 (0.0%) |
| 30 to 34 Years | 11 (37.9%) | 0 (0.0%) |
| 35 to 44 Years | 38 (97.4%) | 22 (57.9%) |
| 45 to 54 Years | 48 (96.0%) | 0 (0.0%) |
| 55 to 59 Years | 24 (82.8%) | 0 (0.0%) |
| 60 to 64 Years | 6 (30.0%) | 1 (16.7%) |
| 65 to 74 Years | 2 (5.7%) | 0 (0.0%) |
| 75 Years and over | 0 (0.0%) | 0 (0.0%) |
| Total | 207 (67.6%) | 25 (12.1%) |
Employment Status by Educational Attainment in Midville
According to labor force statistics for Midville, 79.5% of individuals (155) out of the total population between 25 and 64 years of age (195) are in the labor force, with 14.8% or 23 of them being unemployed. The group with the highest labor force participation rate are those with the educational attainment of less than high school, with 100.0% or 63 individuals in the labor force. Within the labor force, individuals with college / associate degree education have the highest percentage of unemployment, with 43.3% or 13 of them being unemployed.
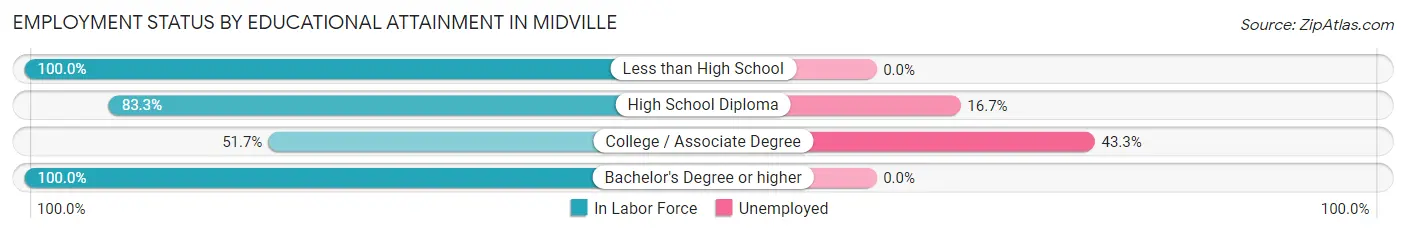
| Educational Attainment | In Labor Force | Unemployed |
| Less than High School | 63 (100.0%) | 0 (0.0%) |
| High School Diploma | 60 (83.3%) | 12 (16.7%) |
| College / Associate Degree | 30 (51.7%) | 25 (43.3%) |
| Bachelor's Degree or higher | 2 (100.0%) | 0 (0.0%) |
| Total | 155 (79.5%) | 29 (14.8%) |
Employment Occupations by Sex in Midville
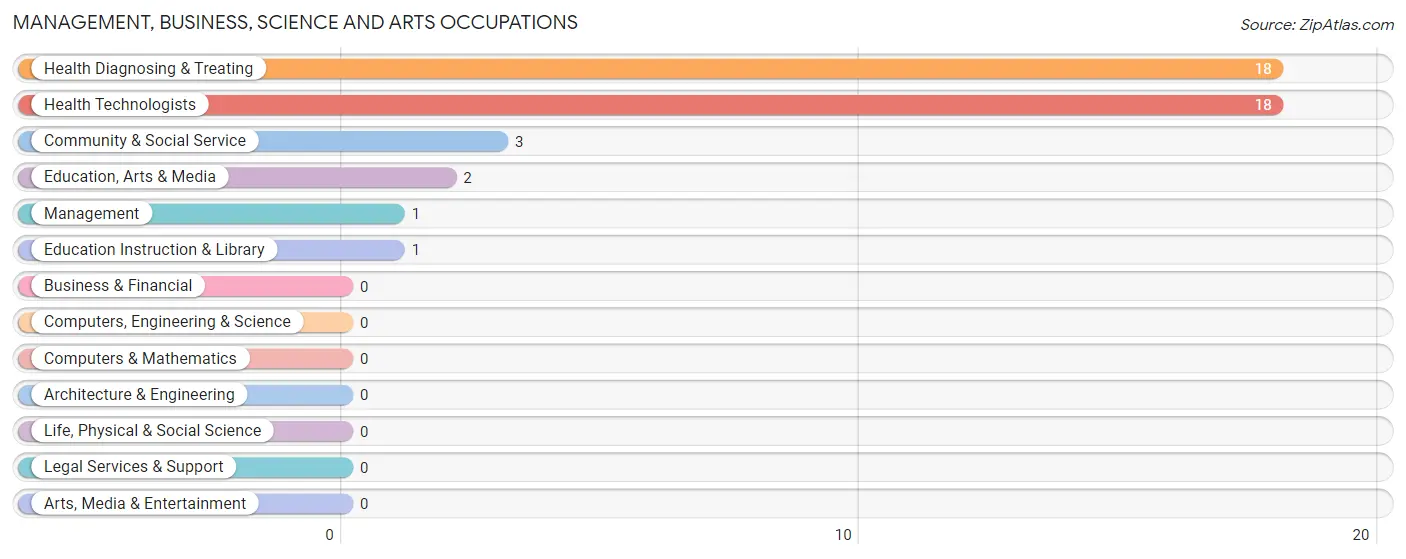
Management, Business, Science and Arts Occupations
The most common Management, Business, Science and Arts occupations in Midville are Health Diagnosing & Treating (18 | 9.9%), Health Technologists (18 | 9.9%), Community & Social Service (3 | 1.7%), Education, Arts & Media (2 | 1.1%), and Management (1 | 0.5%).
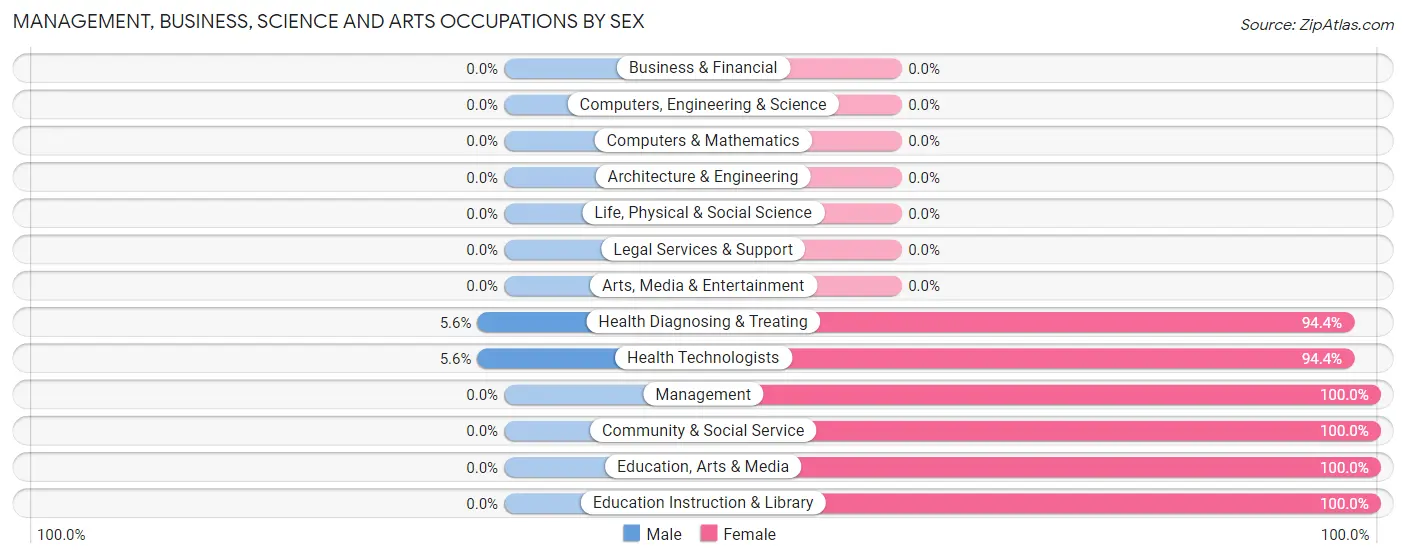
Management, Business, Science and Arts Occupations by Sex
Within the Management, Business, Science and Arts occupations in Midville, the most male-oriented occupations are Health Diagnosing & Treating (5.6%), and Health Technologists (5.6%), while the most female-oriented occupations are Management (100.0%), Community & Social Service (100.0%), and Education, Arts & Media (100.0%).
| Occupation | Male | Female |
| Management | 0 (0.0%) | 1 (100.0%) |
| Business & Financial | 0 (0.0%) | 0 (0.0%) |
| Computers, Engineering & Science | 0 (0.0%) | 0 (0.0%) |
| Computers & Mathematics | 0 (0.0%) | 0 (0.0%) |
| Architecture & Engineering | 0 (0.0%) | 0 (0.0%) |
| Life, Physical & Social Science | 0 (0.0%) | 0 (0.0%) |
| Community & Social Service | 0 (0.0%) | 3 (100.0%) |
| Education, Arts & Media | 0 (0.0%) | 2 (100.0%) |
| Legal Services & Support | 0 (0.0%) | 0 (0.0%) |
| Education Instruction & Library | 0 (0.0%) | 1 (100.0%) |
| Arts, Media & Entertainment | 0 (0.0%) | 0 (0.0%) |
| Health Diagnosing & Treating | 1 (5.6%) | 17 (94.4%) |
| Health Technologists | 1 (5.6%) | 17 (94.4%) |
| Total (Category) | 1 (4.5%) | 21 (95.5%) |
| Total (Overall) | 134 (73.6%) | 48 (26.4%) |
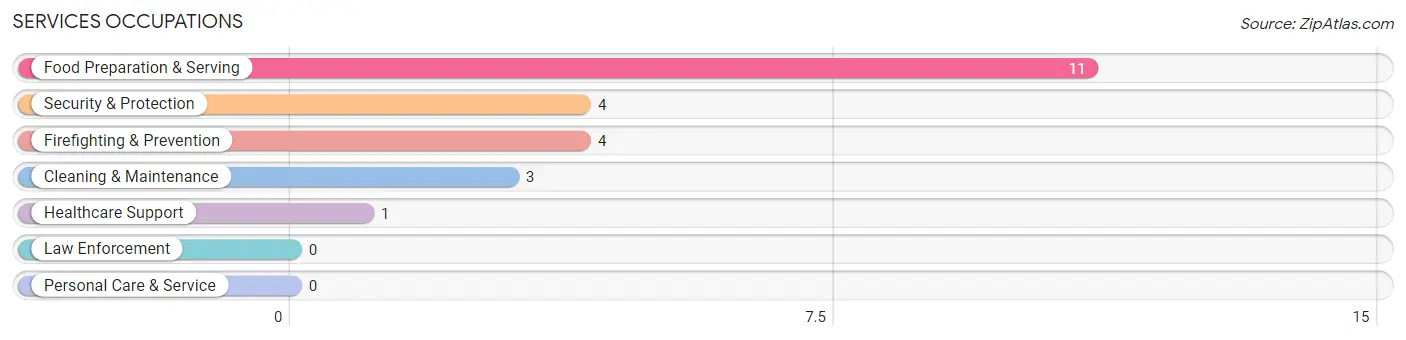
Services Occupations
The most common Services occupations in Midville are Food Preparation & Serving (11 | 6.0%), Security & Protection (4 | 2.2%), Firefighting & Prevention (4 | 2.2%), Cleaning & Maintenance (3 | 1.7%), and Healthcare Support (1 | 0.5%).
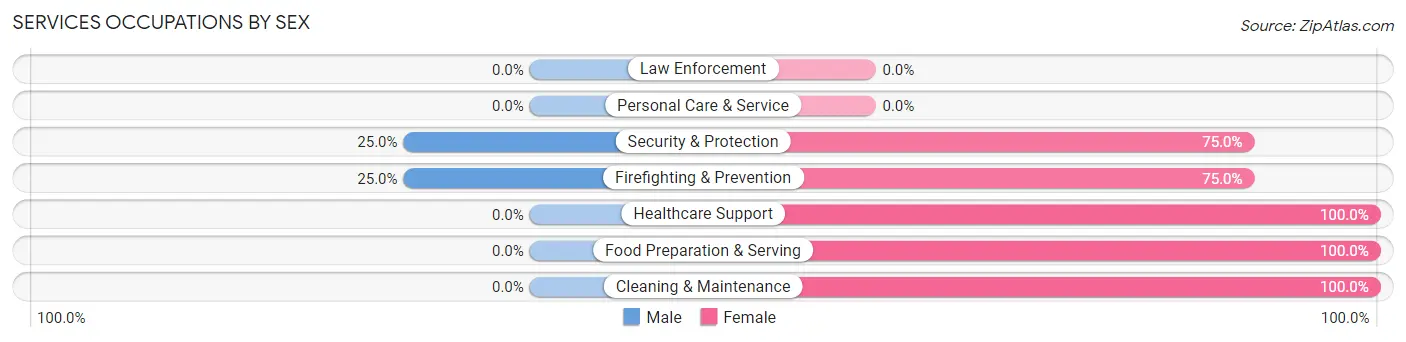
Services Occupations by Sex
Within the Services occupations in Midville, the most male-oriented occupations are Security & Protection (25.0%), and Firefighting & Prevention (25.0%), while the most female-oriented occupations are Healthcare Support (100.0%), Food Preparation & Serving (100.0%), and Cleaning & Maintenance (100.0%).
| Occupation | Male | Female |
| Healthcare Support | 0 (0.0%) | 1 (100.0%) |
| Security & Protection | 1 (25.0%) | 3 (75.0%) |
| Firefighting & Prevention | 1 (25.0%) | 3 (75.0%) |
| Law Enforcement | 0 (0.0%) | 0 (0.0%) |
| Food Preparation & Serving | 0 (0.0%) | 11 (100.0%) |
| Cleaning & Maintenance | 0 (0.0%) | 3 (100.0%) |
| Personal Care & Service | 0 (0.0%) | 0 (0.0%) |
| Total (Category) | 1 (5.3%) | 18 (94.7%) |
| Total (Overall) | 134 (73.6%) | 48 (26.4%) |
Sales and Office Occupations
The most common Sales and Office occupations in Midville are Sales & Related (14 | 7.7%), and Office & Administration (1 | 0.5%).

Sales and Office Occupations by Sex

| Occupation | Male | Female |
| Sales & Related | 14 (100.0%) | 0 (0.0%) |
| Office & Administration | 0 (0.0%) | 1 (100.0%) |
| Total (Category) | 14 (93.3%) | 1 (6.7%) |
| Total (Overall) | 134 (73.6%) | 48 (26.4%) |
Natural Resources, Construction and Maintenance Occupations
The most common Natural Resources, Construction and Maintenance occupations in Midville are Farming, Fishing & Forestry (37 | 20.3%), Installation, Maintenance & Repair (21 | 11.5%), and Construction & Extraction (5 | 2.8%).

Natural Resources, Construction and Maintenance Occupations by Sex

| Occupation | Male | Female |
| Farming, Fishing & Forestry | 33 (89.2%) | 4 (10.8%) |
| Construction & Extraction | 1 (20.0%) | 4 (80.0%) |
| Installation, Maintenance & Repair | 21 (100.0%) | 0 (0.0%) |
| Total (Category) | 55 (87.3%) | 8 (12.7%) |
| Total (Overall) | 134 (73.6%) | 48 (26.4%) |
Production, Transportation and Moving Occupations
The most common Production, Transportation and Moving occupations in Midville are Production (62 | 34.1%), and Material Moving (1 | 0.5%).
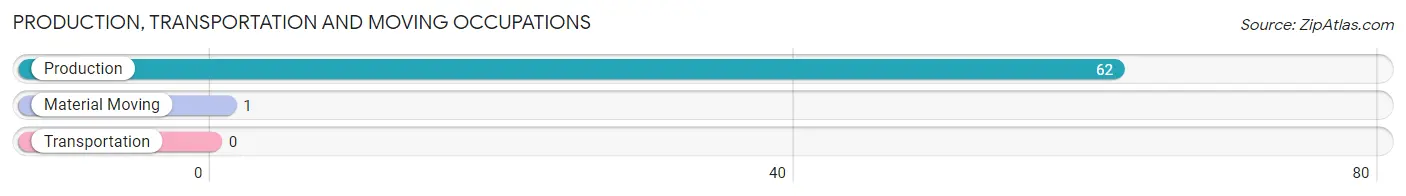
Production, Transportation and Moving Occupations by Sex

| Occupation | Male | Female |
| Production | 62 (100.0%) | 0 (0.0%) |
| Transportation | 0 (0.0%) | 0 (0.0%) |
| Material Moving | 1 (100.0%) | 0 (0.0%) |
| Total (Category) | 63 (100.0%) | 0 (0.0%) |
| Total (Overall) | 134 (73.6%) | 48 (26.4%) |
Employment Industries by Sex in Midville
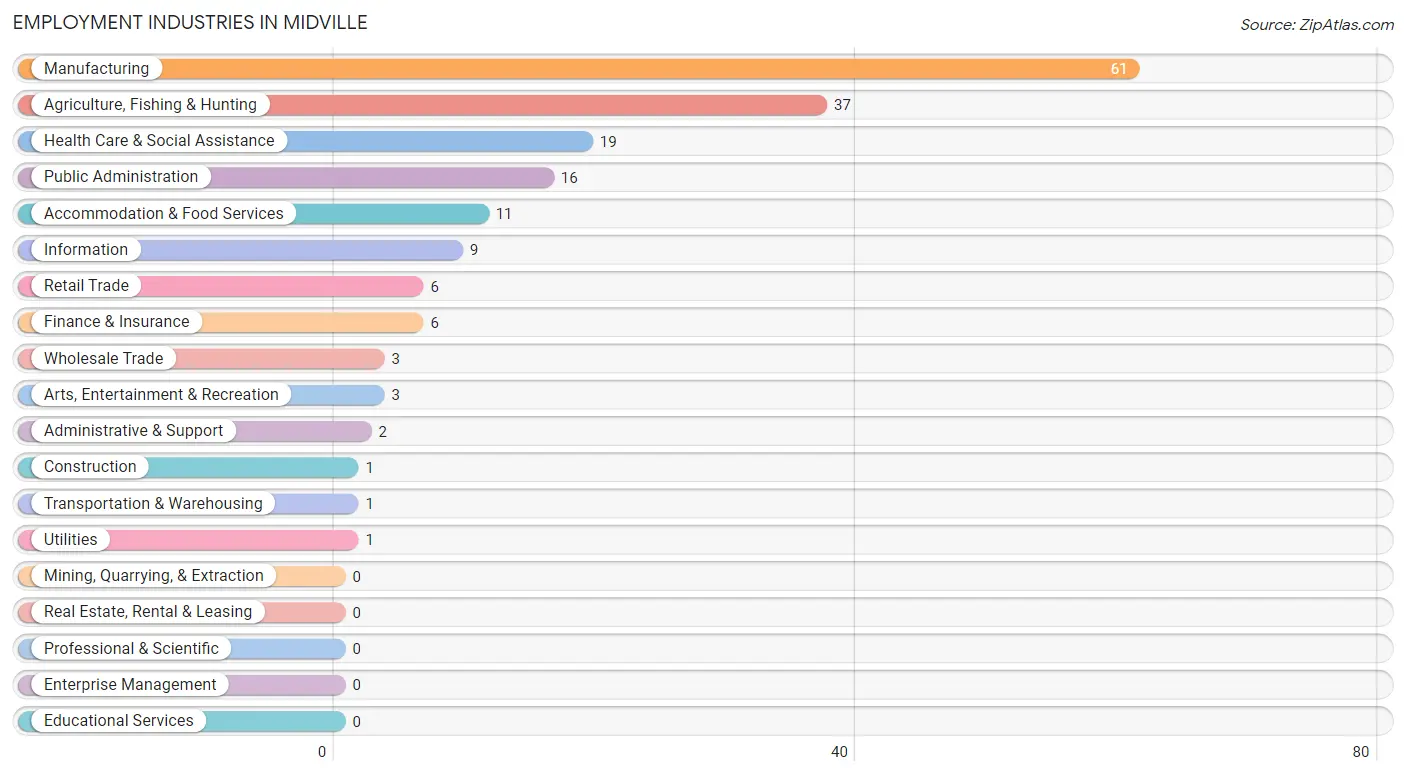
Employment Industries in Midville
The major employment industries in Midville include Manufacturing (61 | 33.5%), Agriculture, Fishing & Hunting (37 | 20.3%), Health Care & Social Assistance (19 | 10.4%), Public Administration (16 | 8.8%), and Accommodation & Food Services (11 | 6.0%).
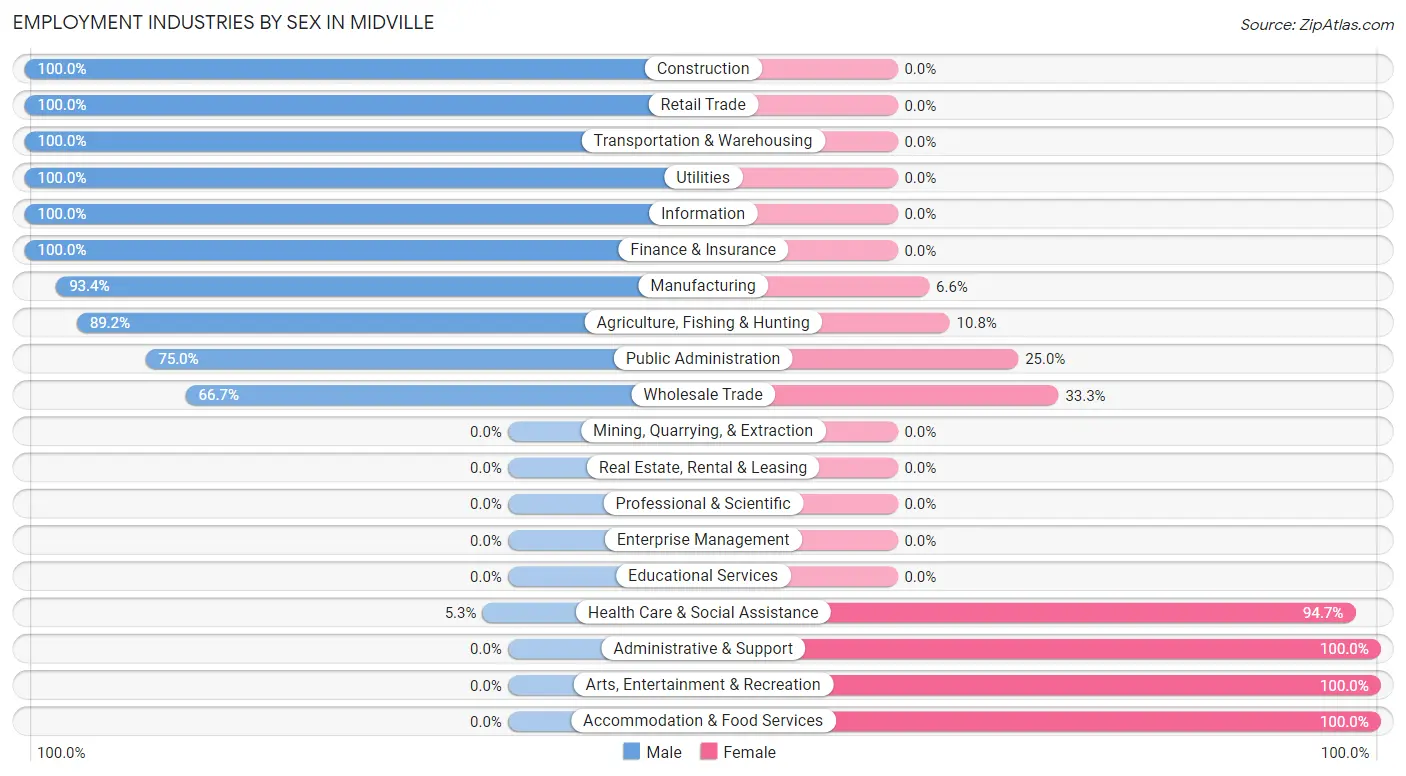
Employment Industries by Sex in Midville
The Midville industries that see more men than women are Construction (100.0%), Retail Trade (100.0%), and Transportation & Warehousing (100.0%), whereas the industries that tend to have a higher number of women are Administrative & Support (100.0%), Arts, Entertainment & Recreation (100.0%), and Accommodation & Food Services (100.0%).
| Industry | Male | Female |
| Agriculture, Fishing & Hunting | 33 (89.2%) | 4 (10.8%) |
| Mining, Quarrying, & Extraction | 0 (0.0%) | 0 (0.0%) |
| Construction | 1 (100.0%) | 0 (0.0%) |
| Manufacturing | 57 (93.4%) | 4 (6.6%) |
| Wholesale Trade | 2 (66.7%) | 1 (33.3%) |
| Retail Trade | 6 (100.0%) | 0 (0.0%) |
| Transportation & Warehousing | 1 (100.0%) | 0 (0.0%) |
| Utilities | 1 (100.0%) | 0 (0.0%) |
| Information | 9 (100.0%) | 0 (0.0%) |
| Finance & Insurance | 6 (100.0%) | 0 (0.0%) |
| Real Estate, Rental & Leasing | 0 (0.0%) | 0 (0.0%) |
| Professional & Scientific | 0 (0.0%) | 0 (0.0%) |
| Enterprise Management | 0 (0.0%) | 0 (0.0%) |
| Administrative & Support | 0 (0.0%) | 2 (100.0%) |
| Educational Services | 0 (0.0%) | 0 (0.0%) |
| Health Care & Social Assistance | 1 (5.3%) | 18 (94.7%) |
| Arts, Entertainment & Recreation | 0 (0.0%) | 3 (100.0%) |
| Accommodation & Food Services | 0 (0.0%) | 11 (100.0%) |
| Public Administration | 12 (75.0%) | 4 (25.0%) |
| Total | 134 (73.6%) | 48 (26.4%) |
Education in Midville
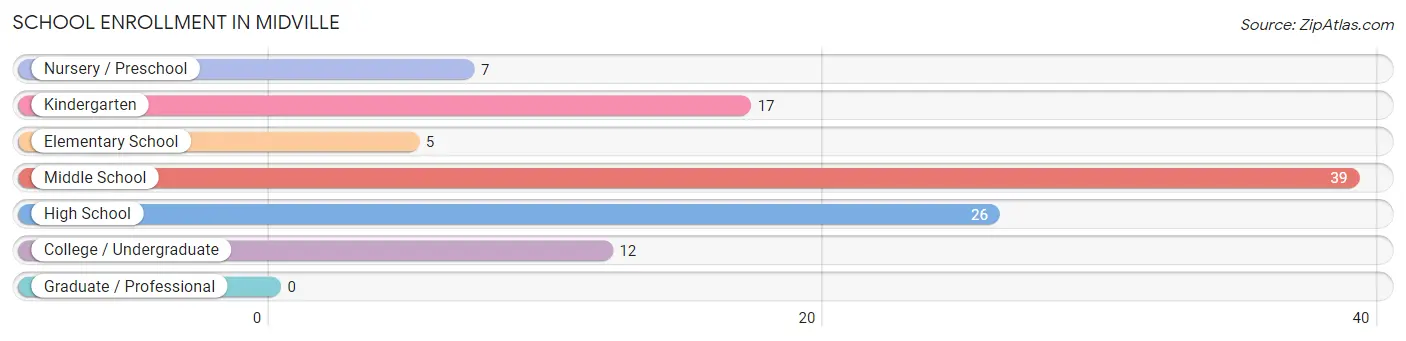
School Enrollment in Midville
The most common levels of schooling among the 106 students in Midville are middle school (39 | 36.8%), high school (26 | 24.5%), and kindergarten (17 | 16.0%).
| School Level | # Students | % Students |
| Nursery / Preschool | 7 | 6.6% |
| Kindergarten | 17 | 16.0% |
| Elementary School | 5 | 4.7% |
| Middle School | 39 | 36.8% |
| High School | 26 | 24.5% |
| College / Undergraduate | 12 | 11.3% |
| Graduate / Professional | 0 | 0.0% |
| Total | 106 | 100.0% |
School Enrollment by Age by Funding Source in Midville
Out of a total of 106 students who are enrolled in schools in Midville, 3 (2.8%) attend a private institution, while the remaining 103 (97.2%) are enrolled in public schools. The age group of 15 to 17 year olds has the highest likelihood of being enrolled in private schools, with 2 (11.8% in the age bracket) enrolled. Conversely, the age group of 3 to 4 year olds has the lowest likelihood of being enrolled in a private school, with 7 (100.0% in the age bracket) attending a public institution.
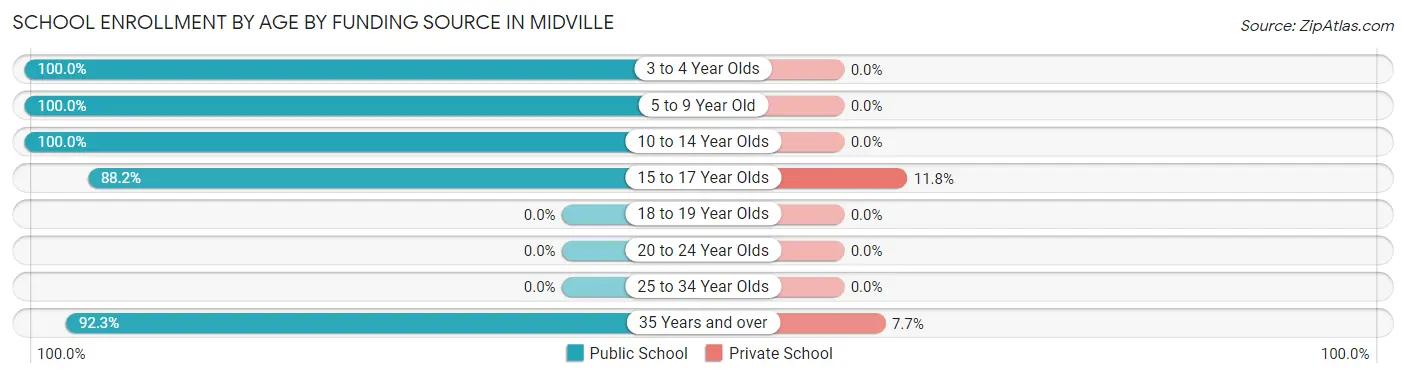
| Age Bracket | Public School | Private School |
| 3 to 4 Year Olds | 7 (100.0%) | 0 (0.0%) |
| 5 to 9 Year Old | 22 (100.0%) | 0 (0.0%) |
| 10 to 14 Year Olds | 47 (100.0%) | 0 (0.0%) |
| 15 to 17 Year Olds | 15 (88.2%) | 2 (11.8%) |
| 18 to 19 Year Olds | 0 (0.0%) | 0 (0.0%) |
| 20 to 24 Year Olds | 0 (0.0%) | 0 (0.0%) |
| 25 to 34 Year Olds | 0 (0.0%) | 0 (0.0%) |
| 35 Years and over | 12 (92.3%) | 1 (7.7%) |
| Total | 103 (97.2%) | 3 (2.8%) |
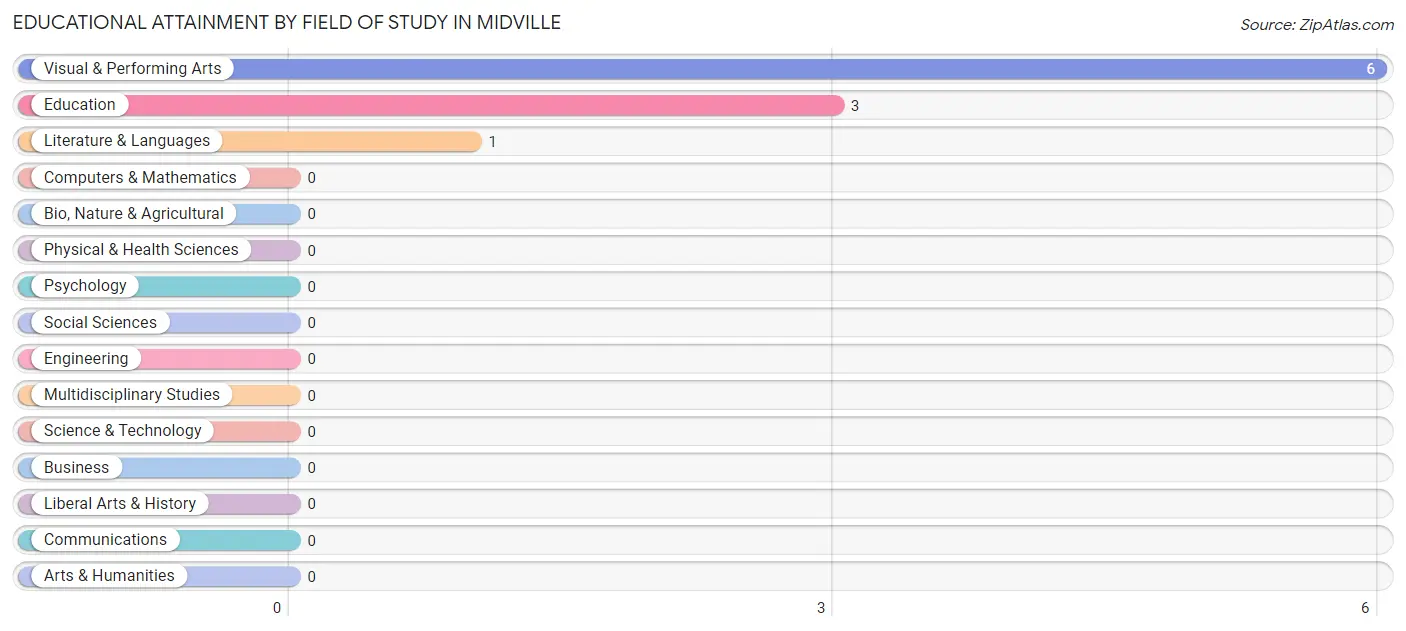
Educational Attainment by Field of Study in Midville
Visual & performing arts (6 | 60.0%), education (3 | 30.0%), and literature & languages (1 | 10.0%) are the most common fields of study among 10 individuals in Midville who have obtained a bachelor's degree or higher.
| Field of Study | # Graduates | % Graduates |
| Computers & Mathematics | 0 | 0.0% |
| Bio, Nature & Agricultural | 0 | 0.0% |
| Physical & Health Sciences | 0 | 0.0% |
| Psychology | 0 | 0.0% |
| Social Sciences | 0 | 0.0% |
| Engineering | 0 | 0.0% |
| Multidisciplinary Studies | 0 | 0.0% |
| Science & Technology | 0 | 0.0% |
| Business | 0 | 0.0% |
| Education | 3 | 30.0% |
| Literature & Languages | 1 | 10.0% |
| Liberal Arts & History | 0 | 0.0% |
| Visual & Performing Arts | 6 | 60.0% |
| Communications | 0 | 0.0% |
| Arts & Humanities | 0 | 0.0% |
| Total | 10 | 100.0% |
Transportation & Commute in Midville
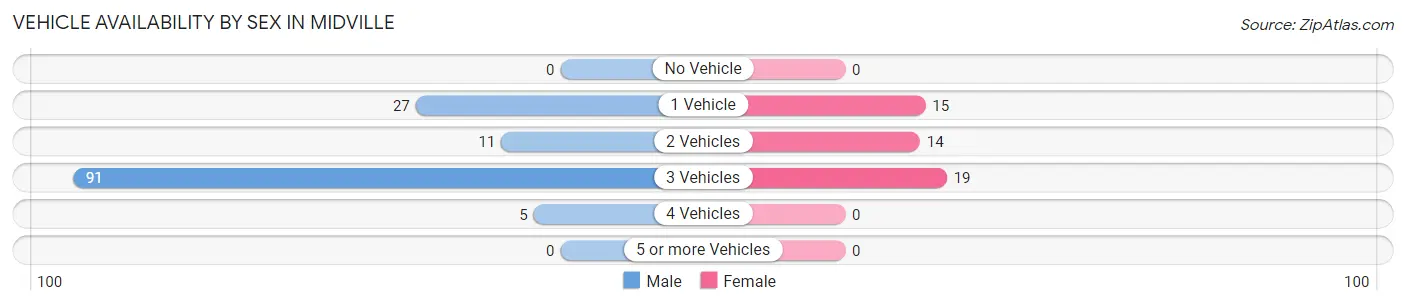
Vehicle Availability by Sex in Midville
The most prevalent vehicle ownership categories in Midville are males with 3 vehicles (91, accounting for 67.9%) and females with 3 vehicles (19, making up 189.6%).
| Vehicles Available | Male | Female |
| No Vehicle | 0 (0.0%) | 0 (0.0%) |
| 1 Vehicle | 27 (20.2%) | 15 (31.2%) |
| 2 Vehicles | 11 (8.2%) | 14 (29.2%) |
| 3 Vehicles | 91 (67.9%) | 19 (39.6%) |
| 4 Vehicles | 5 (3.7%) | 0 (0.0%) |
| 5 or more Vehicles | 0 (0.0%) | 0 (0.0%) |
| Total | 134 (100.0%) | 48 (100.0%) |
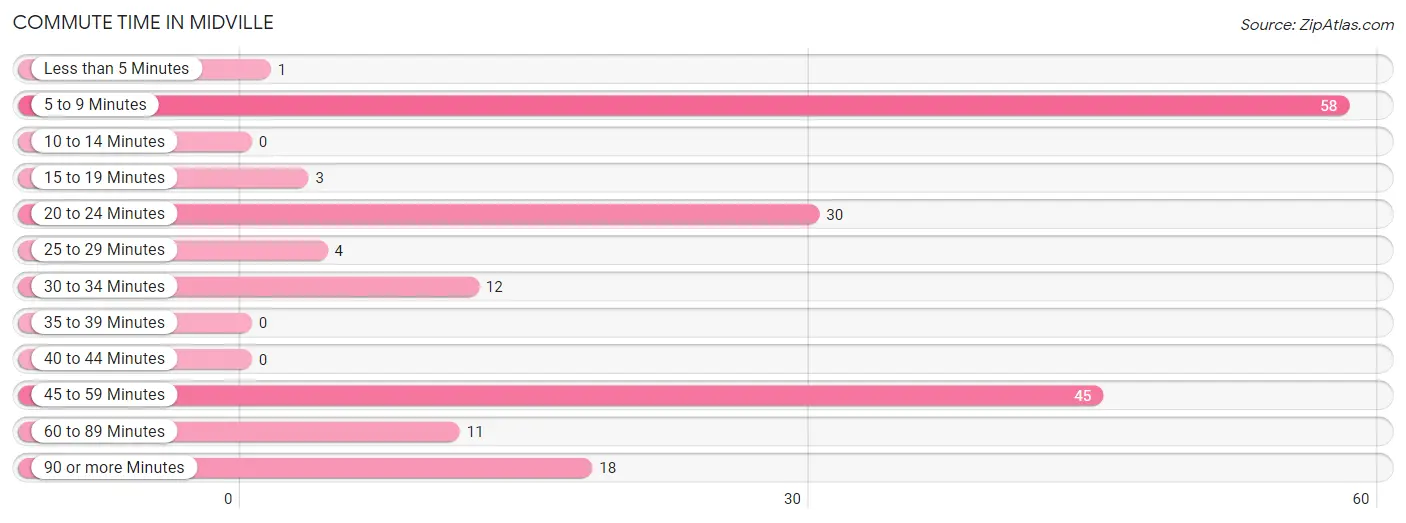
Commute Time in Midville
The most frequently occuring commute durations in Midville are 5 to 9 minutes (58 commuters, 31.9%), 45 to 59 minutes (45 commuters, 24.7%), and 20 to 24 minutes (30 commuters, 16.5%).
| Commute Time | # Commuters | % Commuters |
| Less than 5 Minutes | 1 | 0.5% |
| 5 to 9 Minutes | 58 | 31.9% |
| 10 to 14 Minutes | 0 | 0.0% |
| 15 to 19 Minutes | 3 | 1.7% |
| 20 to 24 Minutes | 30 | 16.5% |
| 25 to 29 Minutes | 4 | 2.2% |
| 30 to 34 Minutes | 12 | 6.6% |
| 35 to 39 Minutes | 0 | 0.0% |
| 40 to 44 Minutes | 0 | 0.0% |
| 45 to 59 Minutes | 45 | 24.7% |
| 60 to 89 Minutes | 11 | 6.0% |
| 90 or more Minutes | 18 | 9.9% |
Commute Time by Sex in Midville
The most common commute times in Midville are 45 to 59 minutes (45 commuters, 33.6%) for males and 20 to 24 minutes (18 commuters, 37.5%) for females.
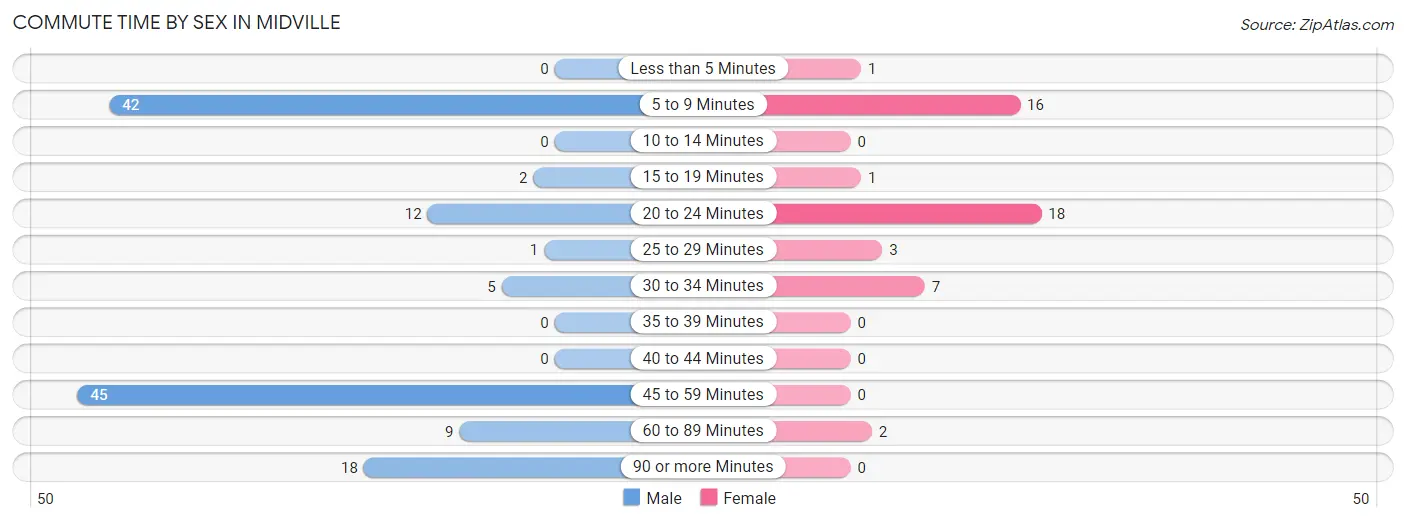
| Commute Time | Male | Female |
| Less than 5 Minutes | 0 (0.0%) | 1 (2.1%) |
| 5 to 9 Minutes | 42 (31.3%) | 16 (33.3%) |
| 10 to 14 Minutes | 0 (0.0%) | 0 (0.0%) |
| 15 to 19 Minutes | 2 (1.5%) | 1 (2.1%) |
| 20 to 24 Minutes | 12 (9.0%) | 18 (37.5%) |
| 25 to 29 Minutes | 1 (0.7%) | 3 (6.2%) |
| 30 to 34 Minutes | 5 (3.7%) | 7 (14.6%) |
| 35 to 39 Minutes | 0 (0.0%) | 0 (0.0%) |
| 40 to 44 Minutes | 0 (0.0%) | 0 (0.0%) |
| 45 to 59 Minutes | 45 (33.6%) | 0 (0.0%) |
| 60 to 89 Minutes | 9 (6.7%) | 2 (4.2%) |
| 90 or more Minutes | 18 (13.4%) | 0 (0.0%) |
Time of Departure to Work by Sex in Midville
The most frequent times of departure to work in Midville are 5:00 AM to 5:29 AM (45, 33.6%) for males and 6:30 AM to 6:59 AM (18, 37.5%) for females.
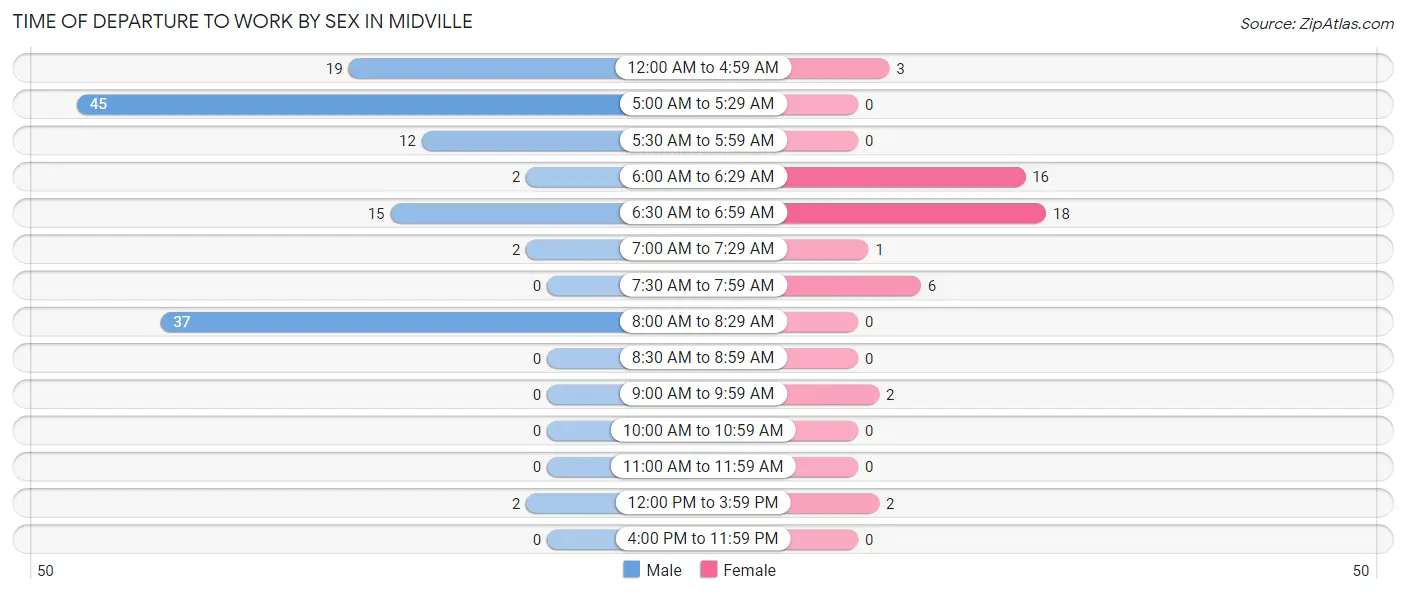
| Time of Departure | Male | Female |
| 12:00 AM to 4:59 AM | 19 (14.2%) | 3 (6.2%) |
| 5:00 AM to 5:29 AM | 45 (33.6%) | 0 (0.0%) |
| 5:30 AM to 5:59 AM | 12 (9.0%) | 0 (0.0%) |
| 6:00 AM to 6:29 AM | 2 (1.5%) | 16 (33.3%) |
| 6:30 AM to 6:59 AM | 15 (11.2%) | 18 (37.5%) |
| 7:00 AM to 7:29 AM | 2 (1.5%) | 1 (2.1%) |
| 7:30 AM to 7:59 AM | 0 (0.0%) | 6 (12.5%) |
| 8:00 AM to 8:29 AM | 37 (27.6%) | 0 (0.0%) |
| 8:30 AM to 8:59 AM | 0 (0.0%) | 0 (0.0%) |
| 9:00 AM to 9:59 AM | 0 (0.0%) | 2 (4.2%) |
| 10:00 AM to 10:59 AM | 0 (0.0%) | 0 (0.0%) |
| 11:00 AM to 11:59 AM | 0 (0.0%) | 0 (0.0%) |
| 12:00 PM to 3:59 PM | 2 (1.5%) | 2 (4.2%) |
| 4:00 PM to 11:59 PM | 0 (0.0%) | 0 (0.0%) |
| Total | 134 (100.0%) | 48 (100.0%) |
Housing Occupancy in Midville
Occupancy by Ownership in Midville
Of the total 167 dwellings in Midville, owner-occupied units account for 110 (65.9%), while renter-occupied units make up 57 (34.1%).
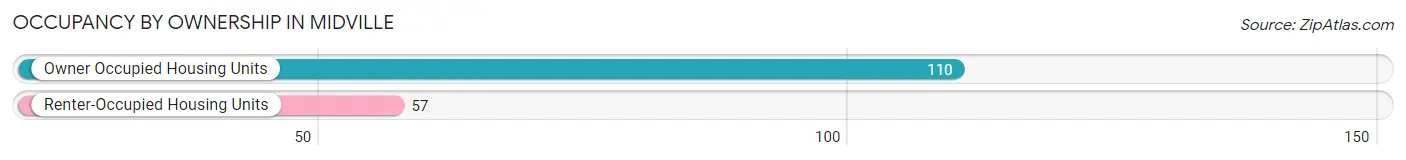
| Occupancy | # Housing Units | % Housing Units |
| Owner Occupied Housing Units | 110 | 65.9% |
| Renter-Occupied Housing Units | 57 | 34.1% |
| Total Occupied Housing Units | 167 | 100.0% |
Occupancy by Household Size in Midville
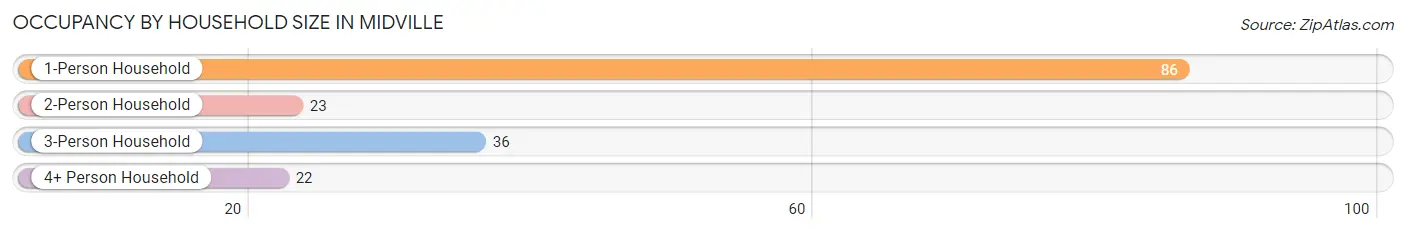
| Household Size | # Housing Units | % Housing Units |
| 1-Person Household | 86 | 51.5% |
| 2-Person Household | 23 | 13.8% |
| 3-Person Household | 36 | 21.6% |
| 4+ Person Household | 22 | 13.2% |
| Total Housing Units | 167 | 100.0% |
Occupancy by Ownership by Household Size in Midville
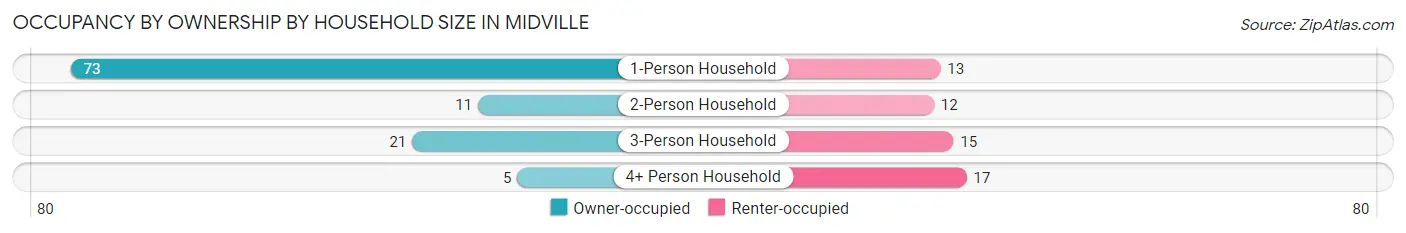
| Household Size | Owner-occupied | Renter-occupied |
| 1-Person Household | 73 (84.9%) | 13 (15.1%) |
| 2-Person Household | 11 (47.8%) | 12 (52.2%) |
| 3-Person Household | 21 (58.3%) | 15 (41.7%) |
| 4+ Person Household | 5 (22.7%) | 17 (77.3%) |
| Total Housing Units | 110 (65.9%) | 57 (34.1%) |
Occupancy by Educational Attainment in Midville
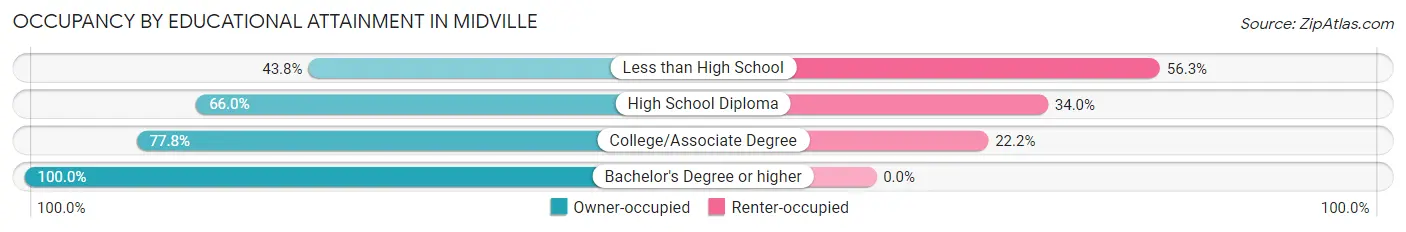
| Household Size | Owner-occupied | Renter-occupied |
| Less than High School | 21 (43.8%) | 27 (56.2%) |
| High School Diploma | 31 (66.0%) | 16 (34.0%) |
| College/Associate Degree | 49 (77.8%) | 14 (22.2%) |
| Bachelor's Degree or higher | 9 (100.0%) | 0 (0.0%) |
Occupancy by Age of Householder in Midville
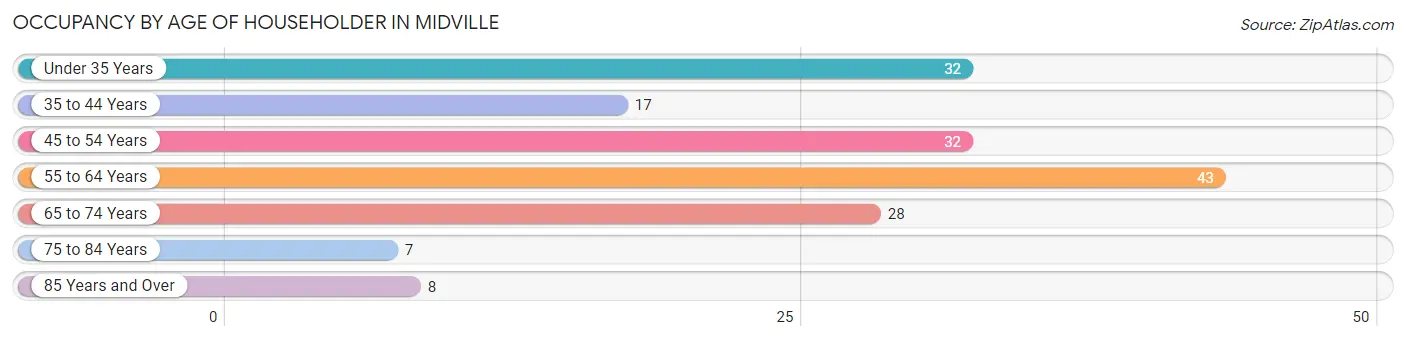
| Age Bracket | # Households | % Households |
| Under 35 Years | 32 | 19.2% |
| 35 to 44 Years | 17 | 10.2% |
| 45 to 54 Years | 32 | 19.2% |
| 55 to 64 Years | 43 | 25.8% |
| 65 to 74 Years | 28 | 16.8% |
| 75 to 84 Years | 7 | 4.2% |
| 85 Years and Over | 8 | 4.8% |
| Total | 167 | 100.0% |
Housing Finances in Midville
Median Income by Occupancy in Midville
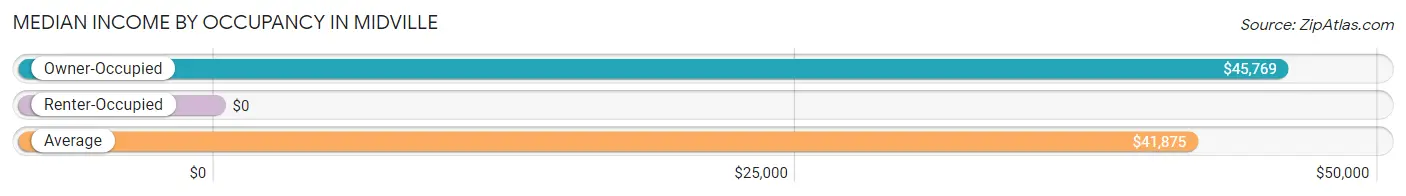
| Occupancy Type | # Households | Median Income |
| Owner-Occupied | 110 (65.9%) | $45,769 |
| Renter-Occupied | 57 (34.1%) | $0 |
| Average | 167 (100.0%) | $41,875 |
Occupancy by Householder Income Bracket in Midville
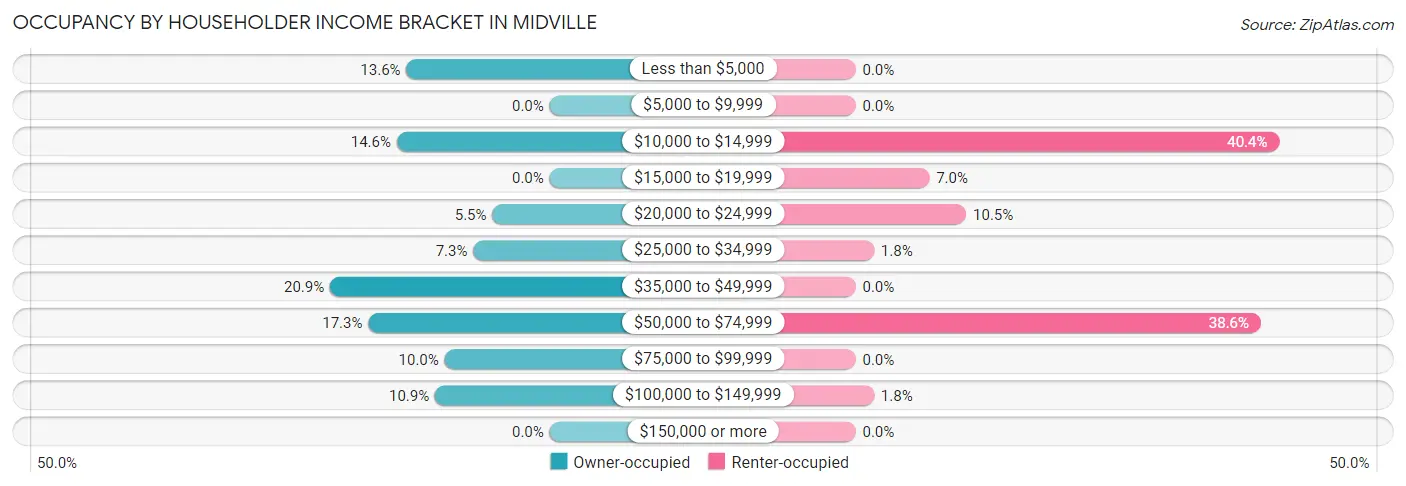
| Income Bracket | Owner-occupied | Renter-occupied |
| Less than $5,000 | 15 (13.6%) | 0 (0.0%) |
| $5,000 to $9,999 | 0 (0.0%) | 0 (0.0%) |
| $10,000 to $14,999 | 16 (14.5%) | 23 (40.4%) |
| $15,000 to $19,999 | 0 (0.0%) | 4 (7.0%) |
| $20,000 to $24,999 | 6 (5.4%) | 6 (10.5%) |
| $25,000 to $34,999 | 8 (7.3%) | 1 (1.8%) |
| $35,000 to $49,999 | 23 (20.9%) | 0 (0.0%) |
| $50,000 to $74,999 | 19 (17.3%) | 22 (38.6%) |
| $75,000 to $99,999 | 11 (10.0%) | 0 (0.0%) |
| $100,000 to $149,999 | 12 (10.9%) | 1 (1.8%) |
| $150,000 or more | 0 (0.0%) | 0 (0.0%) |
| Total | 110 (100.0%) | 57 (100.0%) |
Monthly Housing Cost Tiers in Midville
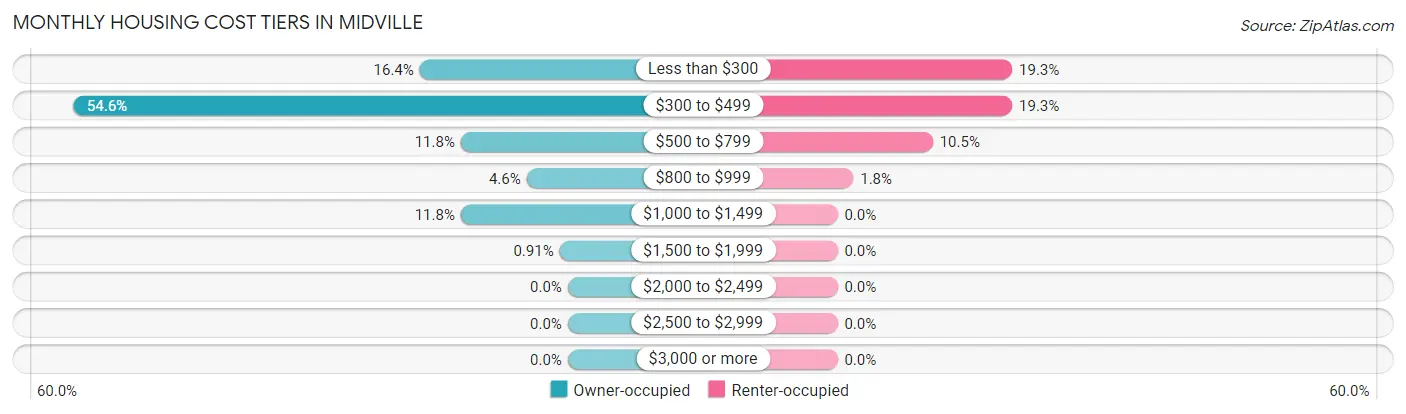
| Monthly Cost | Owner-occupied | Renter-occupied |
| Less than $300 | 18 (16.4%) | 11 (19.3%) |
| $300 to $499 | 60 (54.5%) | 11 (19.3%) |
| $500 to $799 | 13 (11.8%) | 6 (10.5%) |
| $800 to $999 | 5 (4.5%) | 1 (1.8%) |
| $1,000 to $1,499 | 13 (11.8%) | 0 (0.0%) |
| $1,500 to $1,999 | 1 (0.9%) | 0 (0.0%) |
| $2,000 to $2,499 | 0 (0.0%) | 0 (0.0%) |
| $2,500 to $2,999 | 0 (0.0%) | 0 (0.0%) |
| $3,000 or more | 0 (0.0%) | 0 (0.0%) |
| Total | 110 (100.0%) | 57 (100.0%) |
Physical Housing Characteristics in Midville
Housing Structures in Midville
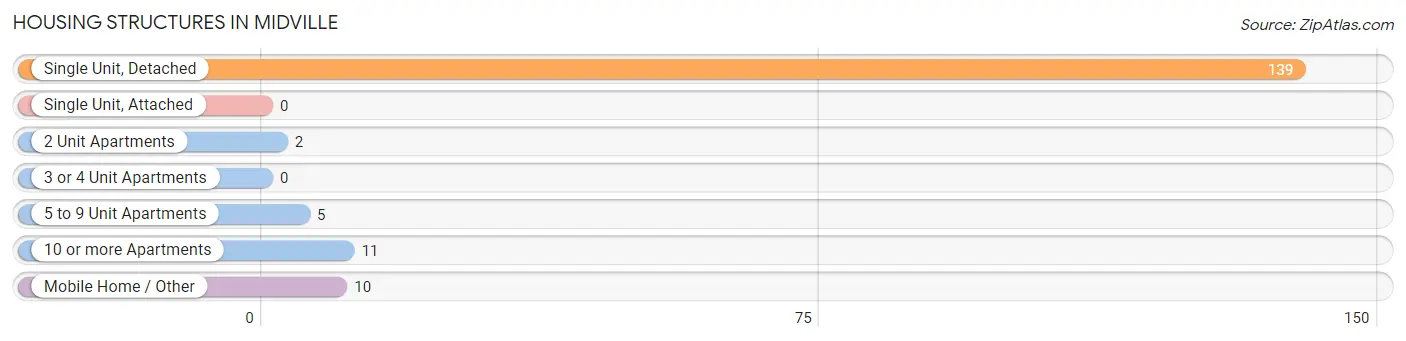
| Structure Type | # Housing Units | % Housing Units |
| Single Unit, Detached | 139 | 83.2% |
| Single Unit, Attached | 0 | 0.0% |
| 2 Unit Apartments | 2 | 1.2% |
| 3 or 4 Unit Apartments | 0 | 0.0% |
| 5 to 9 Unit Apartments | 5 | 3.0% |
| 10 or more Apartments | 11 | 6.6% |
| Mobile Home / Other | 10 | 6.0% |
| Total | 167 | 100.0% |
Housing Structures by Occupancy in Midville
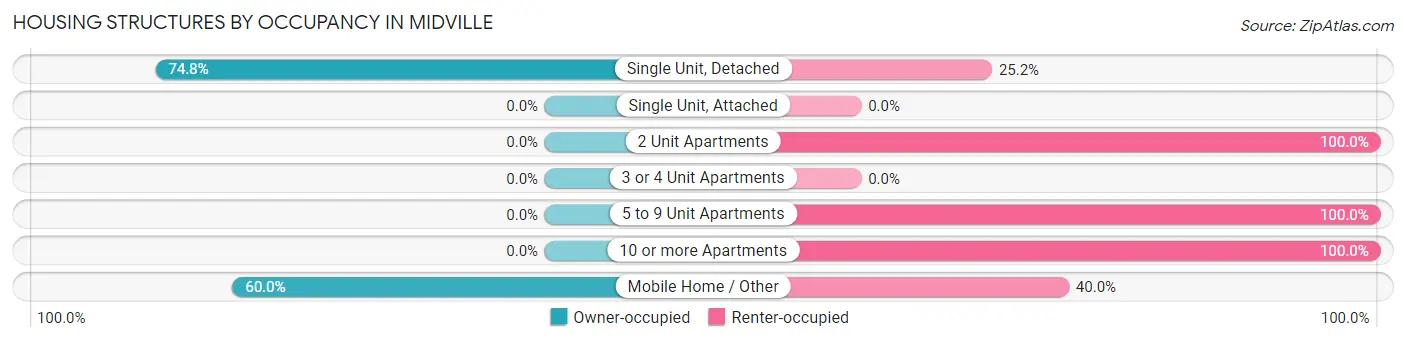
| Structure Type | Owner-occupied | Renter-occupied |
| Single Unit, Detached | 104 (74.8%) | 35 (25.2%) |
| Single Unit, Attached | 0 (0.0%) | 0 (0.0%) |
| 2 Unit Apartments | 0 (0.0%) | 2 (100.0%) |
| 3 or 4 Unit Apartments | 0 (0.0%) | 0 (0.0%) |
| 5 to 9 Unit Apartments | 0 (0.0%) | 5 (100.0%) |
| 10 or more Apartments | 0 (0.0%) | 11 (100.0%) |
| Mobile Home / Other | 6 (60.0%) | 4 (40.0%) |
| Total | 110 (65.9%) | 57 (34.1%) |
Housing Structures by Number of Rooms in Midville
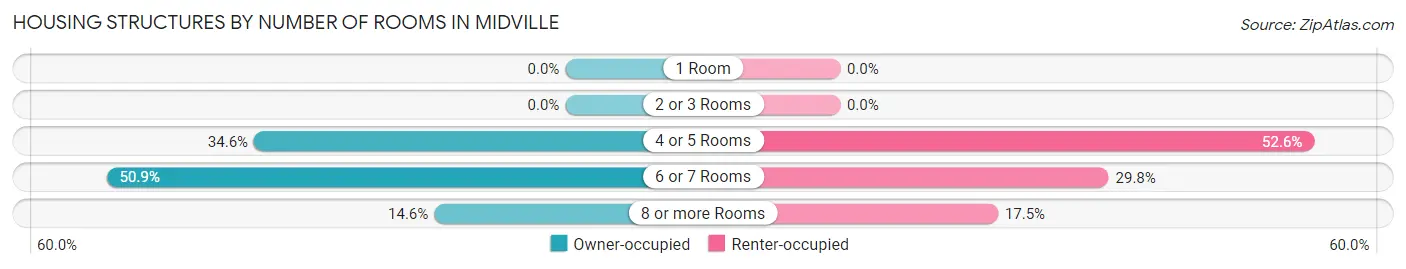
| Number of Rooms | Owner-occupied | Renter-occupied |
| 1 Room | 0 (0.0%) | 0 (0.0%) |
| 2 or 3 Rooms | 0 (0.0%) | 0 (0.0%) |
| 4 or 5 Rooms | 38 (34.5%) | 30 (52.6%) |
| 6 or 7 Rooms | 56 (50.9%) | 17 (29.8%) |
| 8 or more Rooms | 16 (14.5%) | 10 (17.5%) |
| Total | 110 (100.0%) | 57 (100.0%) |
Housing Structure by Heating Type in Midville
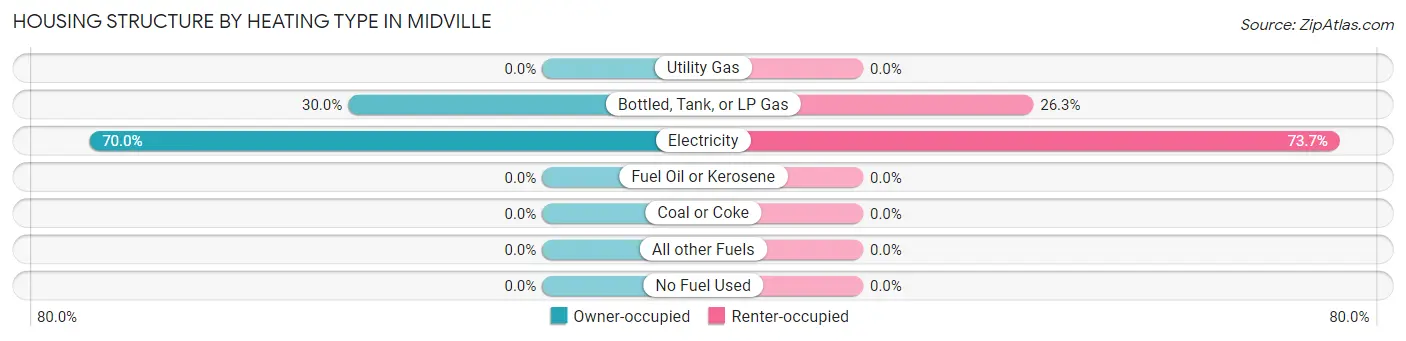
| Heating Type | Owner-occupied | Renter-occupied |
| Utility Gas | 0 (0.0%) | 0 (0.0%) |
| Bottled, Tank, or LP Gas | 33 (30.0%) | 15 (26.3%) |
| Electricity | 77 (70.0%) | 42 (73.7%) |
| Fuel Oil or Kerosene | 0 (0.0%) | 0 (0.0%) |
| Coal or Coke | 0 (0.0%) | 0 (0.0%) |
| All other Fuels | 0 (0.0%) | 0 (0.0%) |
| No Fuel Used | 0 (0.0%) | 0 (0.0%) |
| Total | 110 (100.0%) | 57 (100.0%) |
Household Vehicle Usage in Midville
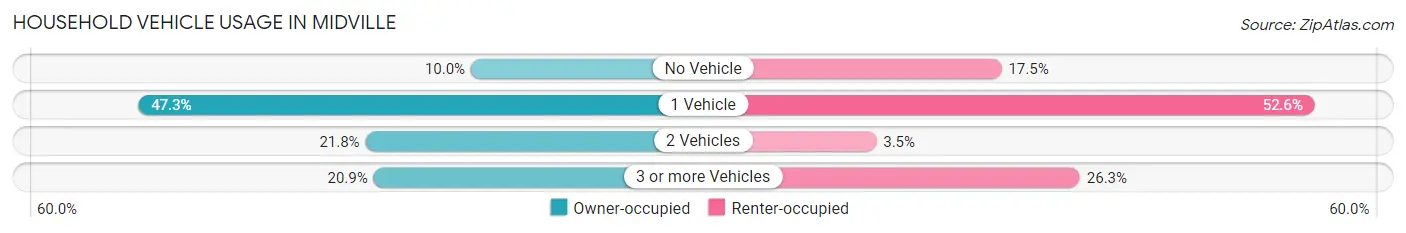
| Vehicles per Household | Owner-occupied | Renter-occupied |
| No Vehicle | 11 (10.0%) | 10 (17.5%) |
| 1 Vehicle | 52 (47.3%) | 30 (52.6%) |
| 2 Vehicles | 24 (21.8%) | 2 (3.5%) |
| 3 or more Vehicles | 23 (20.9%) | 15 (26.3%) |
| Total | 110 (100.0%) | 57 (100.0%) |
Real Estate & Mortgages in Midville
Real Estate and Mortgage Overview in Midville
| Characteristic | Without Mortgage | With Mortgage |
| Housing Units | 79 | 31 |
| Median Property Value | $51,500 | $0 |
| Median Household Income | $46,750 | $0 |
| Monthly Housing Costs | $398 | $0 |
| Real Estate Taxes | $596 | $0 |
Property Value by Mortgage Status in Midville
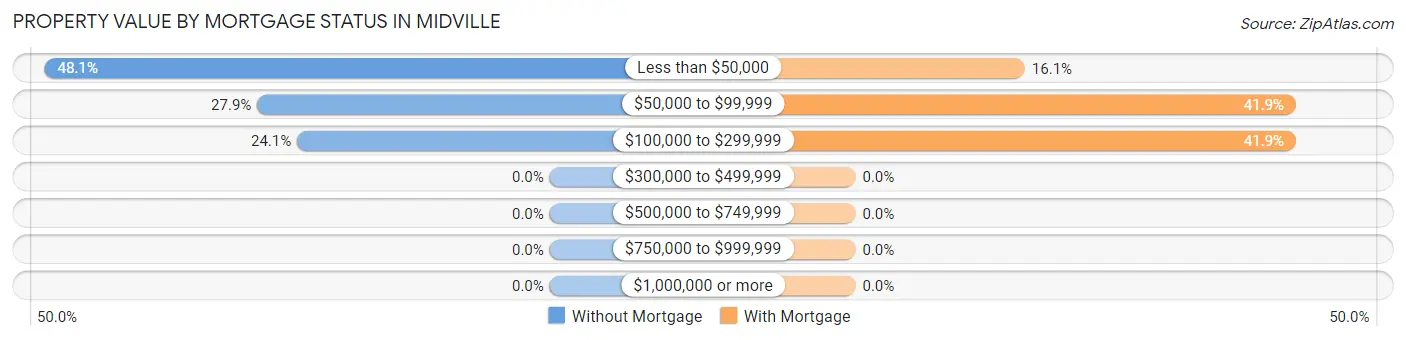
| Property Value | Without Mortgage | With Mortgage |
| Less than $50,000 | 38 (48.1%) | 5 (16.1%) |
| $50,000 to $99,999 | 22 (27.9%) | 13 (41.9%) |
| $100,000 to $299,999 | 19 (24.0%) | 13 (41.9%) |
| $300,000 to $499,999 | 0 (0.0%) | 0 (0.0%) |
| $500,000 to $749,999 | 0 (0.0%) | 0 (0.0%) |
| $750,000 to $999,999 | 0 (0.0%) | 0 (0.0%) |
| $1,000,000 or more | 0 (0.0%) | 0 (0.0%) |
| Total | 79 (100.0%) | 31 (100.0%) |
Household Income by Mortgage Status in Midville
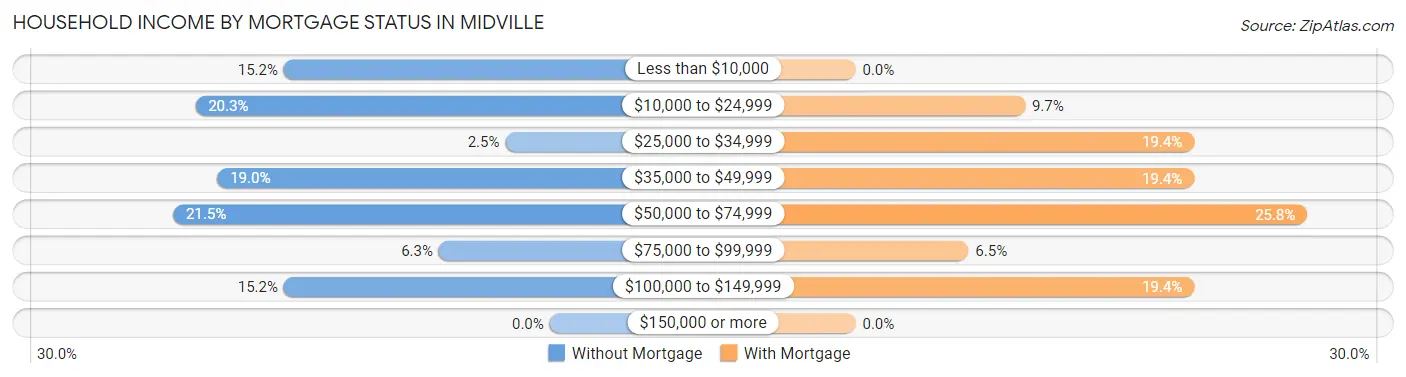
| Household Income | Without Mortgage | With Mortgage |
| Less than $10,000 | 12 (15.2%) | 0 (0.0%) |
| $10,000 to $24,999 | 16 (20.3%) | 3 (9.7%) |
| $25,000 to $34,999 | 2 (2.5%) | 6 (19.4%) |
| $35,000 to $49,999 | 15 (19.0%) | 6 (19.4%) |
| $50,000 to $74,999 | 17 (21.5%) | 8 (25.8%) |
| $75,000 to $99,999 | 5 (6.3%) | 2 (6.5%) |
| $100,000 to $149,999 | 12 (15.2%) | 6 (19.4%) |
| $150,000 or more | 0 (0.0%) | 0 (0.0%) |
| Total | 79 (100.0%) | 31 (100.0%) |
Property Value to Household Income Ratio in Midville
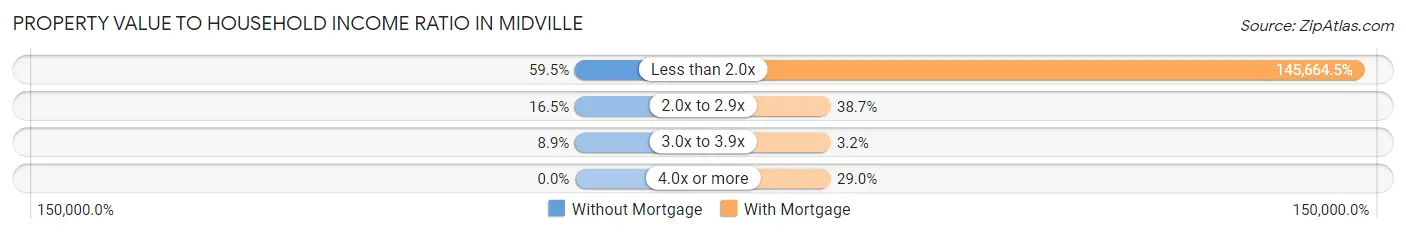
| Value-to-Income Ratio | Without Mortgage | With Mortgage |
| Less than 2.0x | 47 (59.5%) | 45,156 (145,664.5%) |
| 2.0x to 2.9x | 13 (16.5%) | 12 (38.7%) |
| 3.0x to 3.9x | 7 (8.9%) | 1 (3.2%) |
| 4.0x or more | 0 (0.0%) | 9 (29.0%) |
| Total | 79 (100.0%) | 31 (100.0%) |
Real Estate Taxes by Mortgage Status in Midville
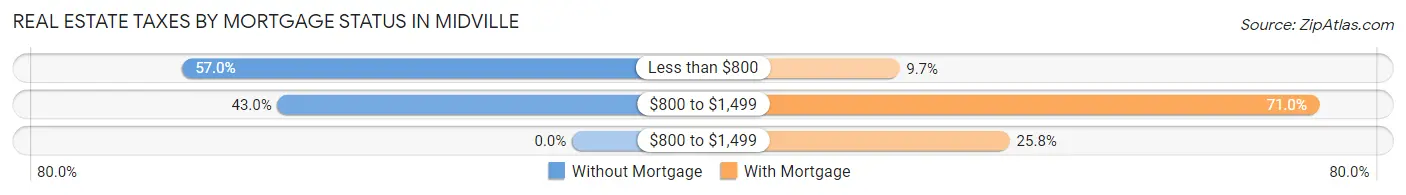
| Property Taxes | Without Mortgage | With Mortgage |
| Less than $800 | 45 (57.0%) | 3 (9.7%) |
| $800 to $1,499 | 34 (43.0%) | 22 (71.0%) |
| $800 to $1,499 | 0 (0.0%) | 8 (25.8%) |
| Total | 79 (100.0%) | 31 (100.0%) |
Health & Disability in Midville
Health Insurance Coverage by Age in Midville
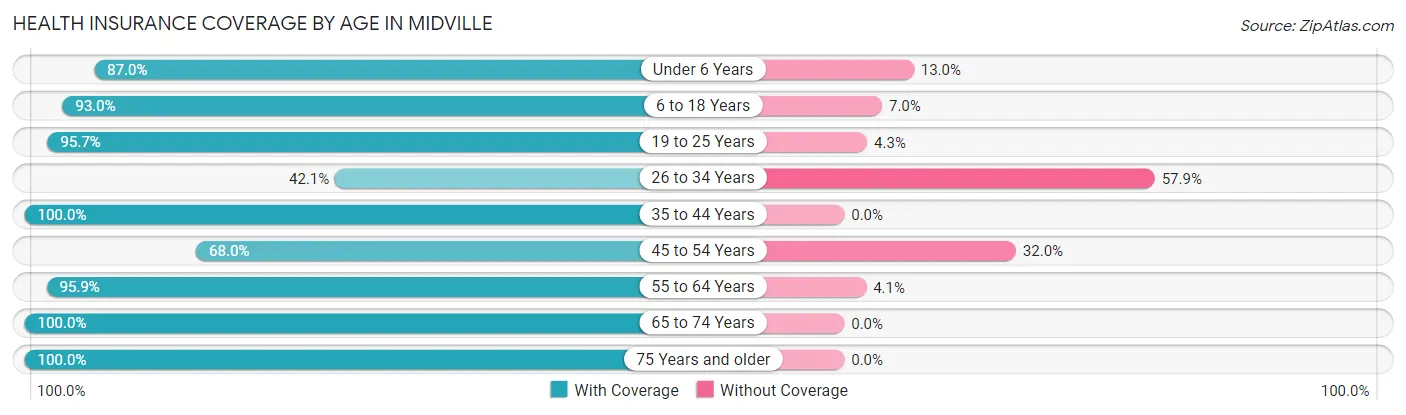
| Age Bracket | With Coverage | Without Coverage |
| Under 6 Years | 47 (87.0%) | 7 (13.0%) |
| 6 to 18 Years | 66 (93.0%) | 5 (7.0%) |
| 19 to 25 Years | 45 (95.7%) | 2 (4.3%) |
| 26 to 34 Years | 24 (42.1%) | 33 (57.9%) |
| 35 to 44 Years | 39 (100.0%) | 0 (0.0%) |
| 45 to 54 Years | 34 (68.0%) | 16 (32.0%) |
| 55 to 64 Years | 47 (95.9%) | 2 (4.1%) |
| 65 to 74 Years | 35 (100.0%) | 0 (0.0%) |
| 75 Years and older | 21 (100.0%) | 0 (0.0%) |
| Total | 358 (84.6%) | 65 (15.4%) |
Health Insurance Coverage by Citizenship Status in Midville
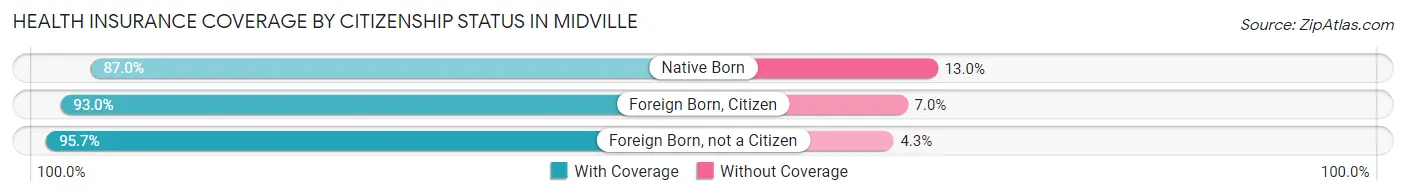
| Citizenship Status | With Coverage | Without Coverage |
| Native Born | 47 (87.0%) | 7 (13.0%) |
| Foreign Born, Citizen | 66 (93.0%) | 5 (7.0%) |
| Foreign Born, not a Citizen | 45 (95.7%) | 2 (4.3%) |
Health Insurance Coverage by Household Income in Midville
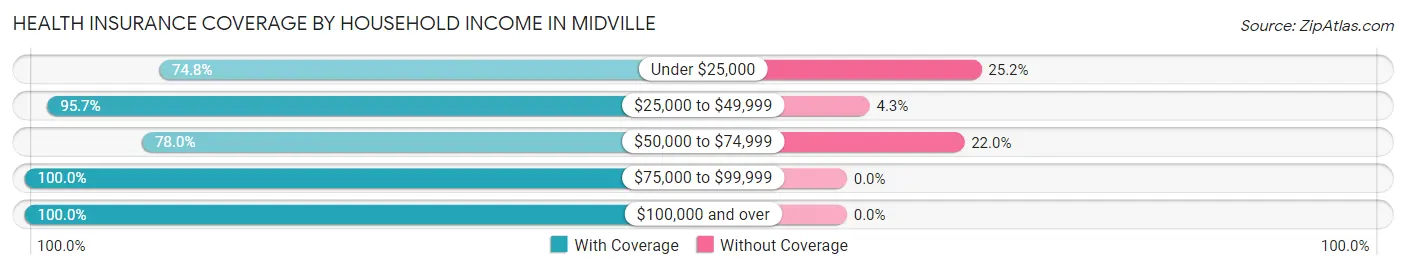
| Household Income | With Coverage | Without Coverage |
| Under $25,000 | 89 (74.8%) | 30 (25.2%) |
| $25,000 to $49,999 | 45 (95.7%) | 2 (4.3%) |
| $50,000 to $74,999 | 117 (78.0%) | 33 (22.0%) |
| $75,000 to $99,999 | 28 (100.0%) | 0 (0.0%) |
| $100,000 and over | 79 (100.0%) | 0 (0.0%) |
Public vs Private Health Insurance Coverage by Age in Midville
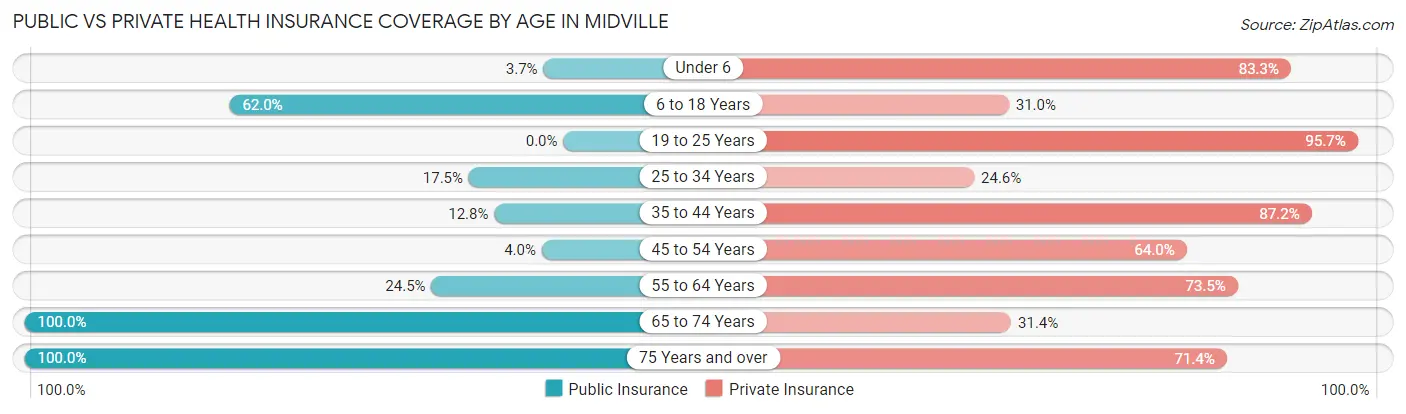
| Age Bracket | Public Insurance | Private Insurance |
| Under 6 | 2 (3.7%) | 45 (83.3%) |
| 6 to 18 Years | 44 (62.0%) | 22 (31.0%) |
| 19 to 25 Years | 0 (0.0%) | 45 (95.7%) |
| 25 to 34 Years | 10 (17.5%) | 14 (24.6%) |
| 35 to 44 Years | 5 (12.8%) | 34 (87.2%) |
| 45 to 54 Years | 2 (4.0%) | 32 (64.0%) |
| 55 to 64 Years | 12 (24.5%) | 36 (73.5%) |
| 65 to 74 Years | 35 (100.0%) | 11 (31.4%) |
| 75 Years and over | 21 (100.0%) | 15 (71.4%) |
| Total | 131 (31.0%) | 254 (60.1%) |
Disability Status by Sex by Age in Midville
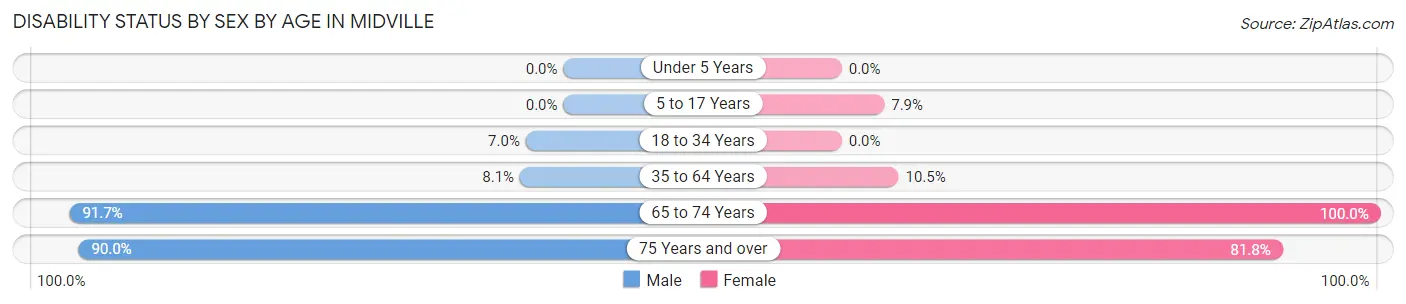
| Age Bracket | Male | Female |
| Under 5 Years | 0 (0.0%) | 0 (0.0%) |
| 5 to 17 Years | 0 (0.0%) | 3 (7.9%) |
| 18 to 34 Years | 6 (7.0%) | 0 (0.0%) |
| 35 to 64 Years | 5 (8.1%) | 8 (10.5%) |
| 65 to 74 Years | 22 (91.7%) | 11 (100.0%) |
| 75 Years and over | 9 (90.0%) | 9 (81.8%) |
Disability Class by Sex by Age in Midville
Disability Class: Hearing Difficulty
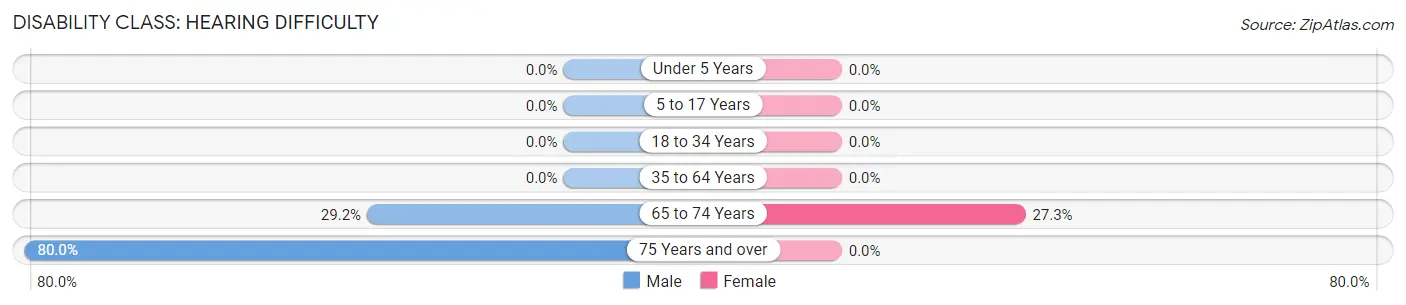
| Age Bracket | Male | Female |
| Under 5 Years | 0 (0.0%) | 0 (0.0%) |
| 5 to 17 Years | 0 (0.0%) | 0 (0.0%) |
| 18 to 34 Years | 0 (0.0%) | 0 (0.0%) |
| 35 to 64 Years | 0 (0.0%) | 0 (0.0%) |
| 65 to 74 Years | 7 (29.2%) | 3 (27.3%) |
| 75 Years and over | 8 (80.0%) | 0 (0.0%) |
Disability Class: Vision Difficulty
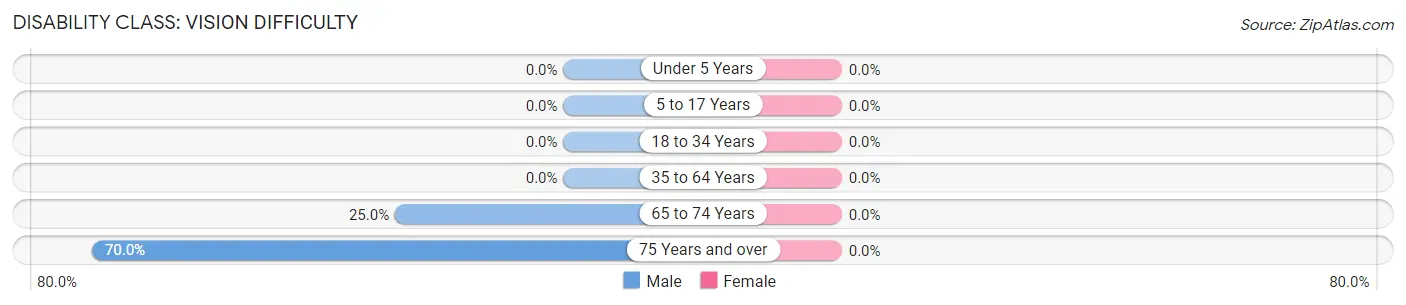
| Age Bracket | Male | Female |
| Under 5 Years | 0 (0.0%) | 0 (0.0%) |
| 5 to 17 Years | 0 (0.0%) | 0 (0.0%) |
| 18 to 34 Years | 0 (0.0%) | 0 (0.0%) |
| 35 to 64 Years | 0 (0.0%) | 0 (0.0%) |
| 65 to 74 Years | 6 (25.0%) | 0 (0.0%) |
| 75 Years and over | 7 (70.0%) | 0 (0.0%) |
Disability Class: Cognitive Difficulty
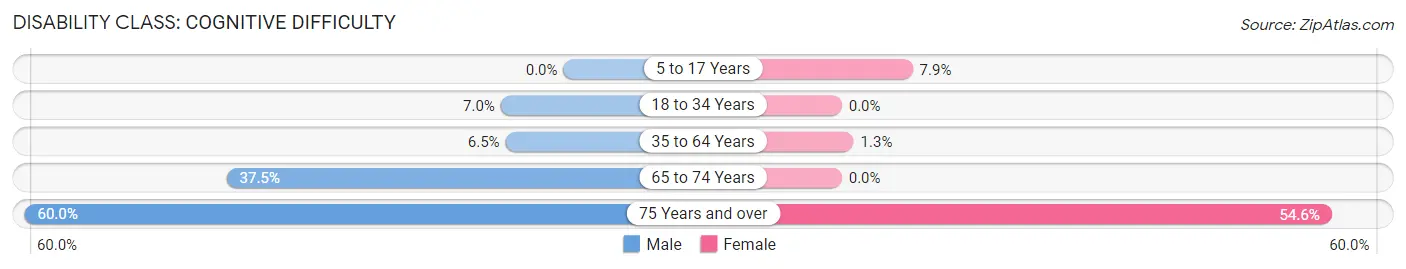
| Age Bracket | Male | Female |
| 5 to 17 Years | 0 (0.0%) | 3 (7.9%) |
| 18 to 34 Years | 6 (7.0%) | 0 (0.0%) |
| 35 to 64 Years | 4 (6.5%) | 1 (1.3%) |
| 65 to 74 Years | 9 (37.5%) | 0 (0.0%) |
| 75 Years and over | 6 (60.0%) | 6 (54.5%) |
Disability Class: Ambulatory Difficulty
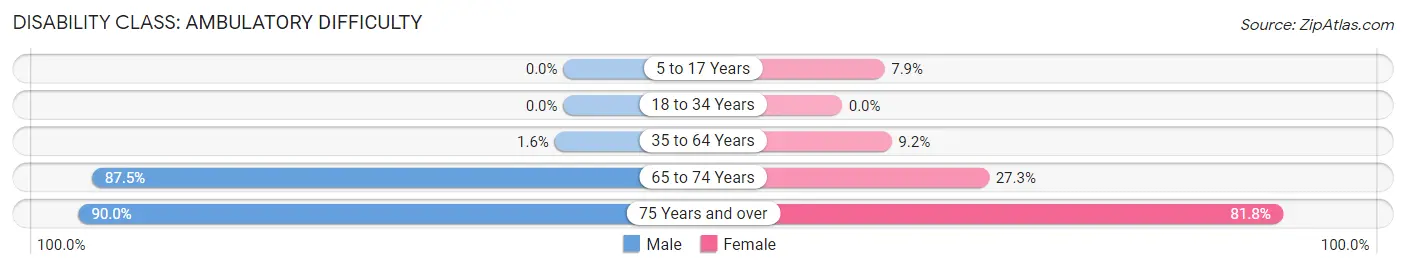
| Age Bracket | Male | Female |
| 5 to 17 Years | 0 (0.0%) | 3 (7.9%) |
| 18 to 34 Years | 0 (0.0%) | 0 (0.0%) |
| 35 to 64 Years | 1 (1.6%) | 7 (9.2%) |
| 65 to 74 Years | 21 (87.5%) | 3 (27.3%) |
| 75 Years and over | 9 (90.0%) | 9 (81.8%) |
Disability Class: Self-Care Difficulty
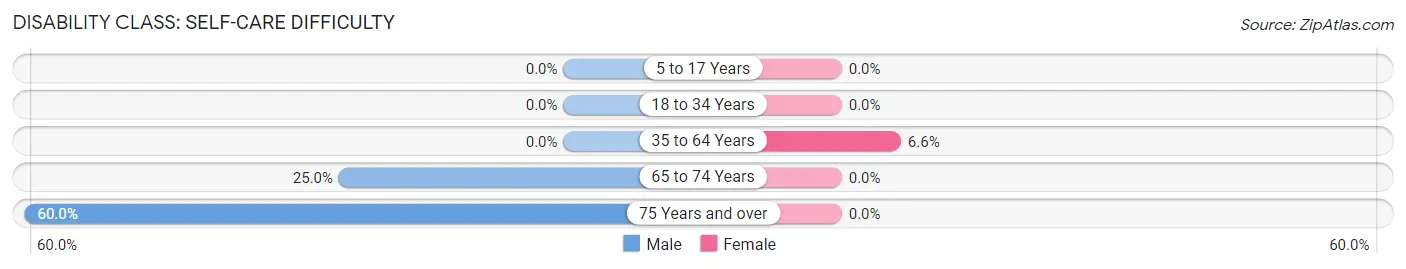
| Age Bracket | Male | Female |
| 5 to 17 Years | 0 (0.0%) | 0 (0.0%) |
| 18 to 34 Years | 0 (0.0%) | 0 (0.0%) |
| 35 to 64 Years | 0 (0.0%) | 5 (6.6%) |
| 65 to 74 Years | 6 (25.0%) | 0 (0.0%) |
| 75 Years and over | 6 (60.0%) | 0 (0.0%) |
Technology Access in Midville
Computing Device Access in Midville
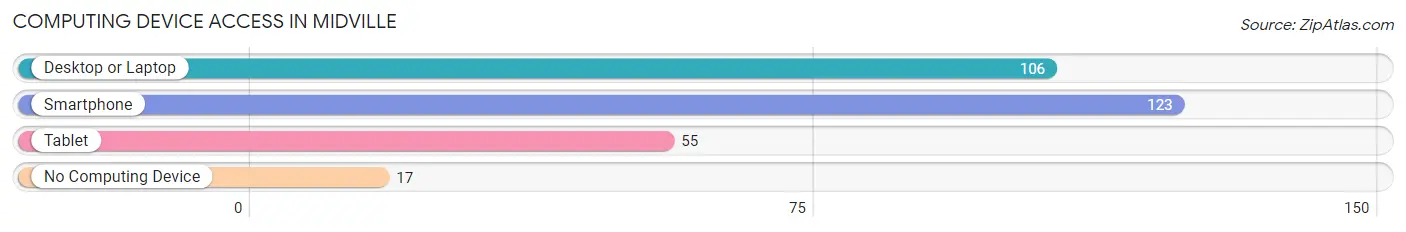
| Device Type | # Households | % Households |
| Desktop or Laptop | 106 | 63.5% |
| Smartphone | 123 | 73.7% |
| Tablet | 55 | 32.9% |
| No Computing Device | 17 | 10.2% |
| Total | 167 | 100.0% |
Internet Access in Midville
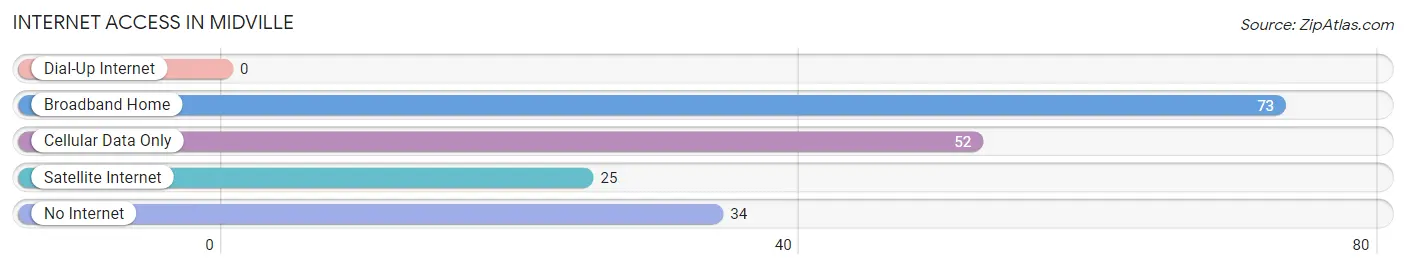
| Internet Type | # Households | % Households |
| Dial-Up Internet | 0 | 0.0% |
| Broadband Home | 73 | 43.7% |
| Cellular Data Only | 52 | 31.1% |
| Satellite Internet | 25 | 15.0% |
| No Internet | 34 | 20.4% |
| Total | 167 | 100.0% |
Midville Summary
Midville, Georgia is a small town located in Burke County, Georgia. It is situated about 20 miles south of Augusta and about 40 miles northwest of Savannah. The town has a population of approximately 1,500 people and is part of the Augusta-Richmond County Metropolitan Statistical Area.
History
Midville was founded in 1820 by a group of settlers from South Carolina. The town was originally called “Midway” because it was located halfway between Augusta and Savannah. The name was later changed to “Midville” in 1835.
The town was an important stop on the Central of Georgia Railroad, which ran from Savannah to Augusta. The railroad brought economic growth to the area and helped to make Midville a thriving community.
In the late 19th century, Midville was a major center for the production of cotton and tobacco. The town also had several sawmills and gristmills.
In the early 20th century, Midville experienced a period of decline. The railroad was abandoned and the local economy suffered. However, the town was able to recover and today it is a thriving community.
Geography
Midville is located in Burke County, Georgia. The town is situated in the Piedmont region of the state, which is characterized by rolling hills and fertile soil. The town is located on the Savannah River, which forms the border between Georgia and South Carolina.
The climate in Midville is humid subtropical, with hot summers and mild winters. The average annual temperature is around 70 degrees Fahrenheit.
Economy
The economy of Midville is largely based on agriculture. The town is home to several farms that produce cotton, tobacco, corn, soybeans, and other crops.
The town also has several small businesses, including restaurants, retail stores, and service providers. The town is also home to a few manufacturing companies, which produce furniture, textiles, and other products.
Demographics
As of the 2010 census, the population of Midville was 1,500. The racial makeup of the town was 79.2% White, 17.3% African American, 0.7% Native American, 0.7% Asian, 0.3% from other races, and 1.9% from two or more races.
The median household income in Midville was $31,250, and the median family income was $37,500. The per capita income was $17,857. About 17.3% of the population was below the poverty line.
Conclusion
Midville, Georgia is a small town located in Burke County, Georgia. It has a population of approximately 1,500 people and is part of the Augusta-Richmond County Metropolitan Statistical Area. The town was founded in 1820 and has a long history of agriculture and industry. The economy of Midville is largely based on agriculture, with several farms producing cotton, tobacco, corn, soybeans, and other crops. The town also has several small businesses, including restaurants, retail stores, and service providers. The racial makeup of the town is 79.2% White, 17.3% African American, 0.7% Native American, 0.7% Asian, 0.3% from other races, and 1.9% from two or more races. The median household income in Midville was $31,250, and the median family income was $37,500. The per capita income was $17,857. About 17.3% of the population was below the poverty line.
Common Questions
What is Per Capita Income in Midville?
Per Capita income in Midville is $19,292.
What is the Median Household income in Midville?
Median Household Income in Midville is $41,875.
What is Inequality or Gini Index in Midville?
Inequality or Gini Index in Midville is 0.45.
What is the Total Population of Midville?
Total Population of Midville is 423.
What is the Total Male Population of Midville?
Total Male Population of Midville is 245.
What is the Total Female Population of Midville?
Total Female Population of Midville is 178.
What is the Ratio of Males per 100 Females in Midville?
There are 137.64 Males per 100 Females in Midville.
What is the Ratio of Females per 100 Males in Midville?
There are 72.65 Females per 100 Males in Midville.
What is the Median Population Age in Midville?
Median Population Age in Midville is 34.0 Years.
What is the Average Family Size in Midville
Average Family Size in Midville is 4.1 People.
What is the Average Household Size in Midville
Average Household Size in Midville is 2.5 People.
How Large is the Labor Force in Midville?
There are 207 People in the Labor Forcein in Midville.
What is the Percentage of People in the Labor Force in Midville?
67.6% of People are in the Labor Force in Midville.
What is the Unemployment Rate in Midville?
Unemployment Rate in Midville is 12.1%.