Fort Gaines, GA Map & Demographics
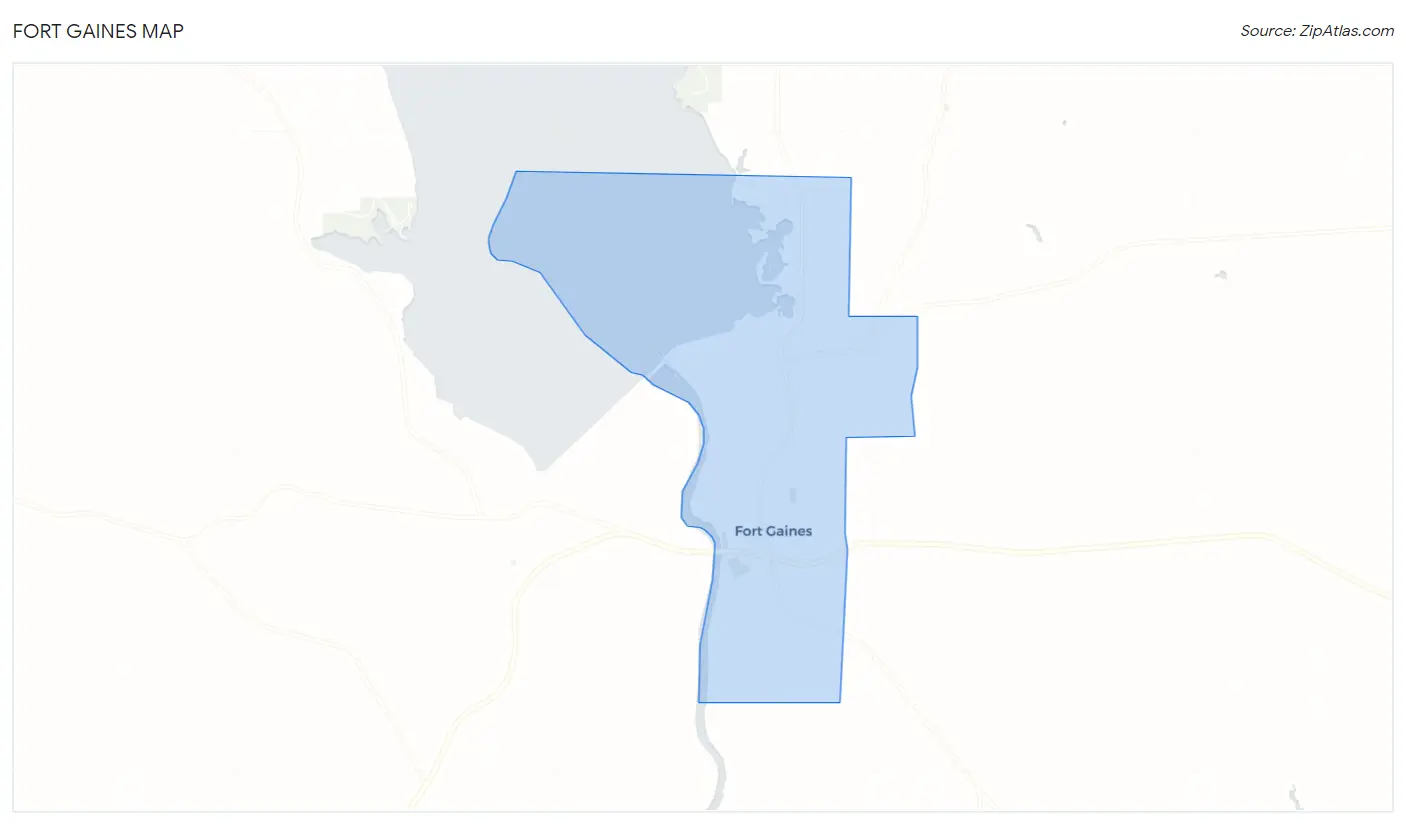
Fort Gaines Map
Fort Gaines Overview
$16,608
PER CAPITA INCOME
$53,000
AVG FAMILY INCOME
$36,161
AVG HOUSEHOLD INCOME
8.1%
WAGE / INCOME GAP [ % ]
91.9¢/ $1
WAGE / INCOME GAP [ $ ]
0.43
INEQUALITY / GINI INDEX
1,035
TOTAL POPULATION
472
MALE POPULATION
563
FEMALE POPULATION
83.84
MALES / 100 FEMALES
119.28
FEMALES / 100 MALES
31.4
MEDIAN AGE
4.1
AVG FAMILY SIZE
2.8
AVG HOUSEHOLD SIZE
381
LABOR FORCE [ PEOPLE ]
54.2%
PERCENT IN LABOR FORCE
9.2%
UNEMPLOYMENT RATE
Fort Gaines Zip Codes
Fort Gaines Area Codes
Income in Fort Gaines
Income Overview in Fort Gaines
Per Capita Income in Fort Gaines is $16,608, while median incomes of families and households are $53,000 and $36,161 respectively.
| Characteristic | Number | Measure |
| Per Capita Income | 1,035 | $16,608 |
| Median Family Income | 204 | $53,000 |
| Mean Family Income | 204 | $54,966 |
| Median Household Income | 347 | $36,161 |
| Mean Household Income | 347 | $43,001 |
| Income Deficit | 204 | $0 |
| Wage / Income Gap (%) | 1,035 | 8.09% |
| Wage / Income Gap ($) | 1,035 | 91.91¢ per $1 |
| Gini / Inequality Index | 1,035 | 0.43 |
Earnings by Sex in Fort Gaines
Average Earnings in Fort Gaines are $34,922, $37,692 for men and $34,643 for women, a difference of 8.1%.
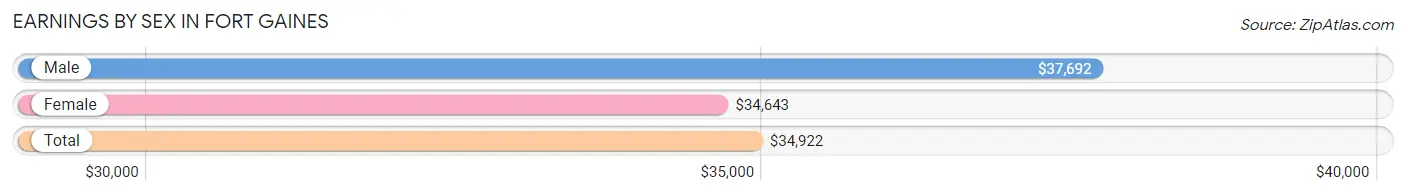
| Sex | Number | Average Earnings |
| Male | 222 (60.0%) | $37,692 |
| Female | 148 (40.0%) | $34,643 |
| Total | 370 (100.0%) | $34,922 |
Earnings by Sex by Income Bracket in Fort Gaines
The most common earnings brackets in Fort Gaines are $45,000 to $49,999 for men (32 | 14.4%) and $35,000 to $39,999 for women (30 | 20.3%).
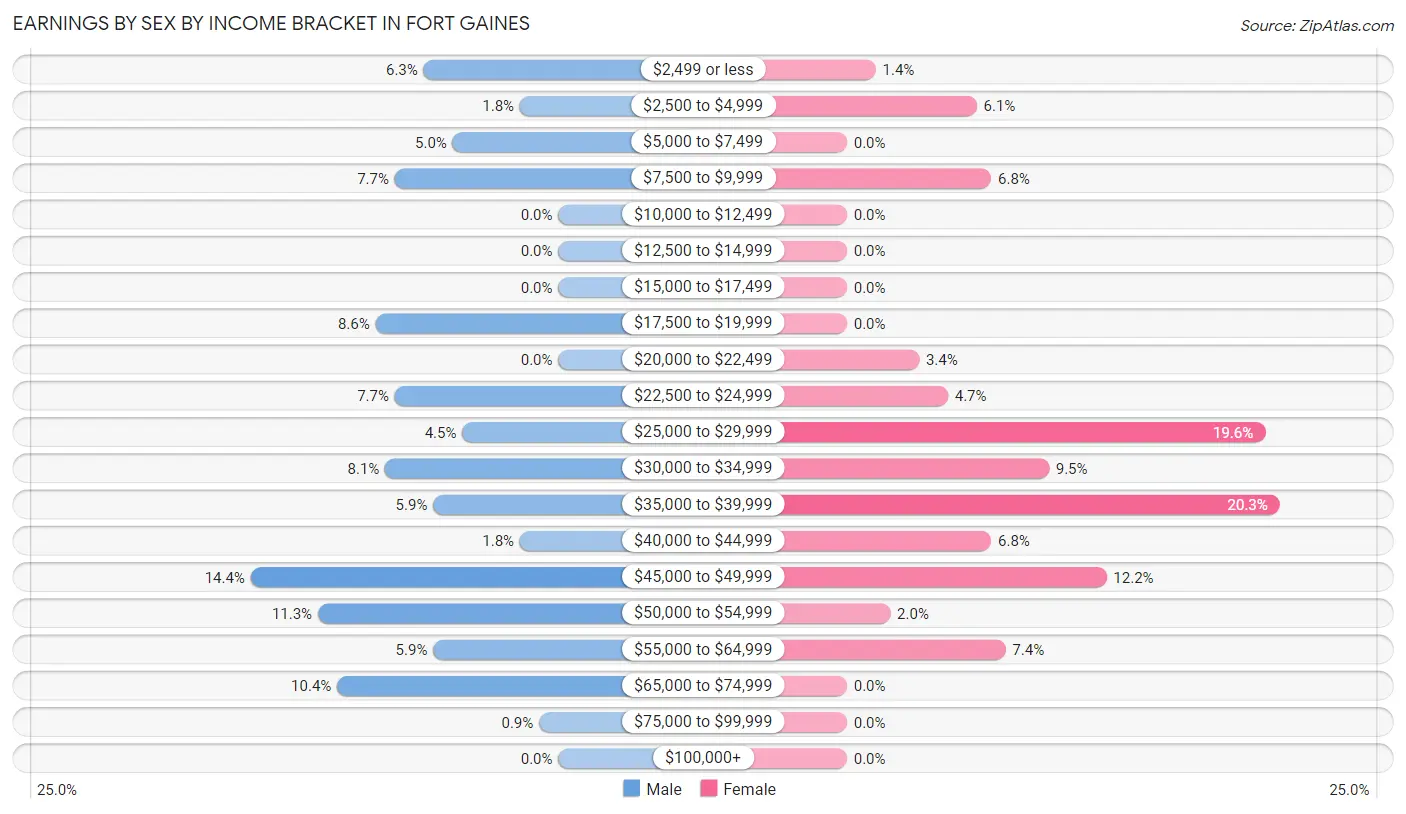
| Income | Male | Female |
| $2,499 or less | 14 (6.3%) | 2 (1.3%) |
| $2,500 to $4,999 | 4 (1.8%) | 9 (6.1%) |
| $5,000 to $7,499 | 11 (5.0%) | 0 (0.0%) |
| $7,500 to $9,999 | 17 (7.7%) | 10 (6.8%) |
| $10,000 to $12,499 | 0 (0.0%) | 0 (0.0%) |
| $12,500 to $14,999 | 0 (0.0%) | 0 (0.0%) |
| $15,000 to $17,499 | 0 (0.0%) | 0 (0.0%) |
| $17,500 to $19,999 | 19 (8.6%) | 0 (0.0%) |
| $20,000 to $22,499 | 0 (0.0%) | 5 (3.4%) |
| $22,500 to $24,999 | 17 (7.7%) | 7 (4.7%) |
| $25,000 to $29,999 | 10 (4.5%) | 29 (19.6%) |
| $30,000 to $34,999 | 18 (8.1%) | 14 (9.5%) |
| $35,000 to $39,999 | 13 (5.9%) | 30 (20.3%) |
| $40,000 to $44,999 | 4 (1.8%) | 10 (6.8%) |
| $45,000 to $49,999 | 32 (14.4%) | 18 (12.2%) |
| $50,000 to $54,999 | 25 (11.3%) | 3 (2.0%) |
| $55,000 to $64,999 | 13 (5.9%) | 11 (7.4%) |
| $65,000 to $74,999 | 23 (10.4%) | 0 (0.0%) |
| $75,000 to $99,999 | 2 (0.9%) | 0 (0.0%) |
| $100,000+ | 0 (0.0%) | 0 (0.0%) |
| Total | 222 (100.0%) | 148 (100.0%) |
Earnings by Sex by Educational Attainment in Fort Gaines
Average earnings in Fort Gaines are $47,852 for men and $35,750 for women, a difference of 25.3%. Men with an educational attainment of high school diploma enjoy the highest average annual earnings of $48,162, while those with high school diploma education earn the least with $48,162. Women with an educational attainment of high school diploma earn the most with the average annual earnings of $47,639, while those with college or associate's degree education have the smallest earnings of $35,543.
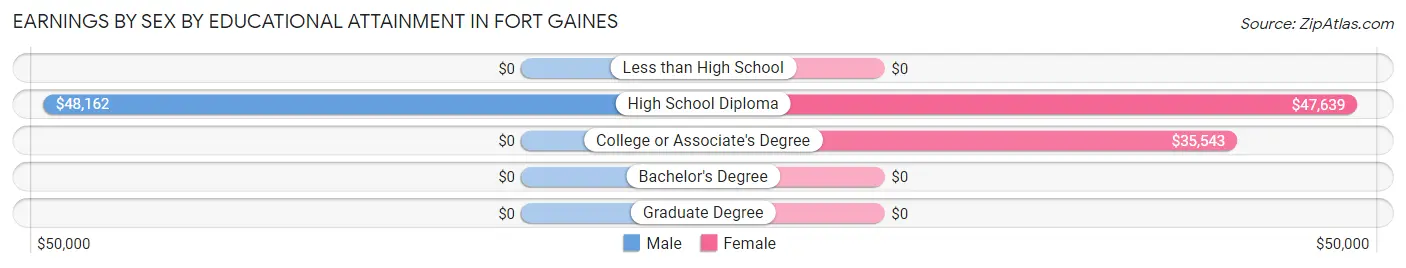
| Educational Attainment | Male Income | Female Income |
| Less than High School | - | - |
| High School Diploma | $48,162 | $47,639 |
| College or Associate's Degree | - | - |
| Bachelor's Degree | - | - |
| Graduate Degree | - | - |
| Total | $47,852 | $35,750 |
Family Income in Fort Gaines
Family Income Brackets in Fort Gaines
According to the Fort Gaines family income data, there are 60 families falling into the $75,000 to $99,999 income range, which is the most common income bracket and makes up 29.4% of all families.
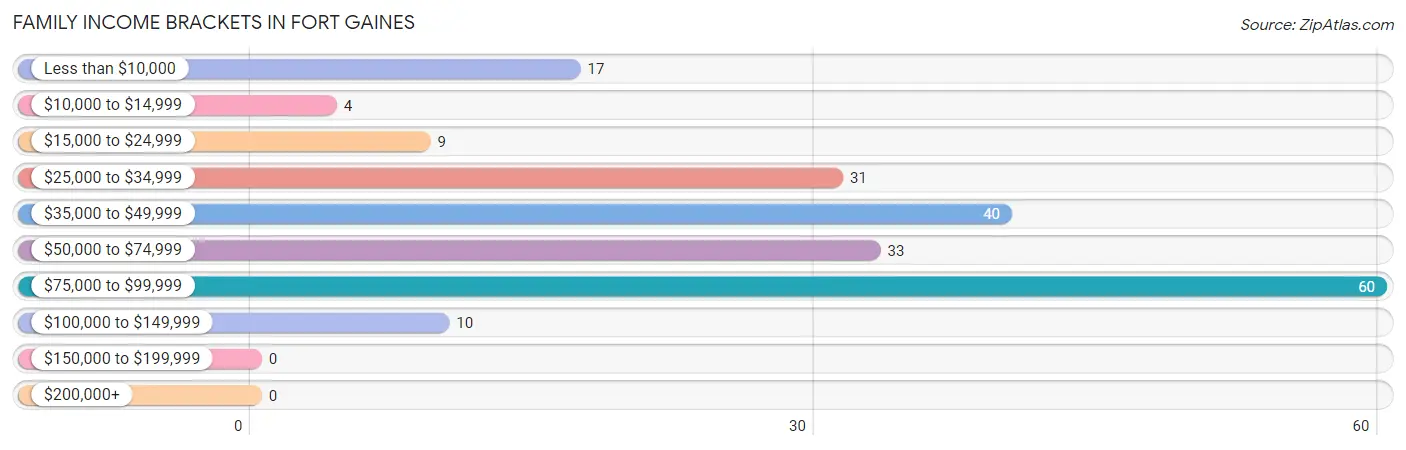
| Income Bracket | # Families | % Families |
| Less than $10,000 | 17 | 8.3% |
| $10,000 to $14,999 | 4 | 2.0% |
| $15,000 to $24,999 | 9 | 4.4% |
| $25,000 to $34,999 | 31 | 15.2% |
| $35,000 to $49,999 | 40 | 19.6% |
| $50,000 to $74,999 | 33 | 16.2% |
| $75,000 to $99,999 | 60 | 29.4% |
| $100,000 to $149,999 | 10 | 4.9% |
| $150,000 to $199,999 | 0 | 0.0% |
| $200,000+ | 0 | 0.0% |
Family Income by Famaliy Size in Fort Gaines
2-person families (95 | 46.6%) account for the highest median family income in Fort Gaines with $57,386 per family, while 2-person families (95 | 46.6%) have the highest median income of $28,693 per family member.
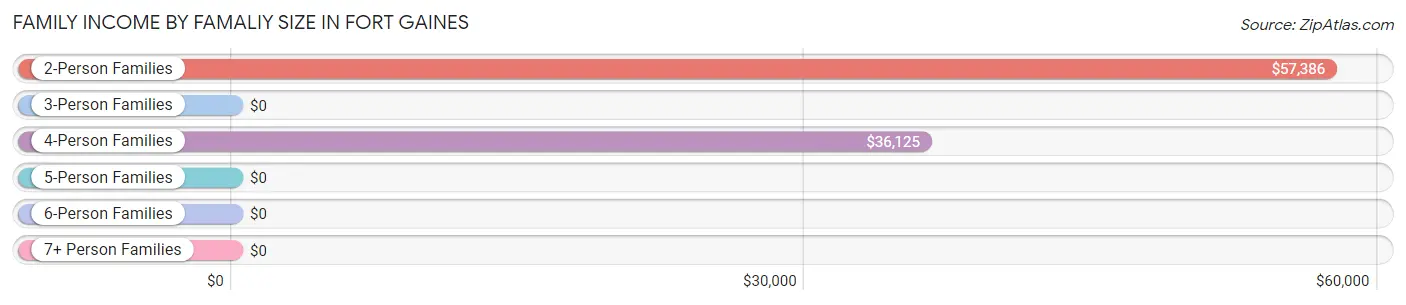
| Income Bracket | # Families | Median Income |
| 2-Person Families | 95 (46.6%) | $57,386 |
| 3-Person Families | 37 (18.1%) | $0 |
| 4-Person Families | 55 (27.0%) | $36,125 |
| 5-Person Families | 5 (2.5%) | $0 |
| 6-Person Families | 7 (3.4%) | $0 |
| 7+ Person Families | 5 (2.5%) | $0 |
| Total | 204 (100.0%) | $53,000 |
Family Income by Number of Earners in Fort Gaines
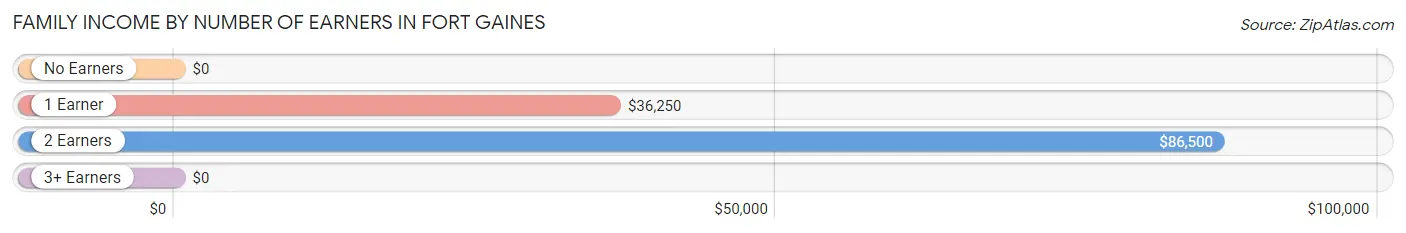
| Number of Earners | # Families | Median Income |
| No Earners | 28 (13.7%) | $0 |
| 1 Earner | 104 (51.0%) | $36,250 |
| 2 Earners | 62 (30.4%) | $86,500 |
| 3+ Earners | 10 (4.9%) | $0 |
| Total | 204 (100.0%) | $53,000 |
Household Income in Fort Gaines
Household Income Brackets in Fort Gaines
With 60 households falling in the category, the $75,000 to $99,999 income range is the most frequent in Fort Gaines, accounting for 17.3% of all households.
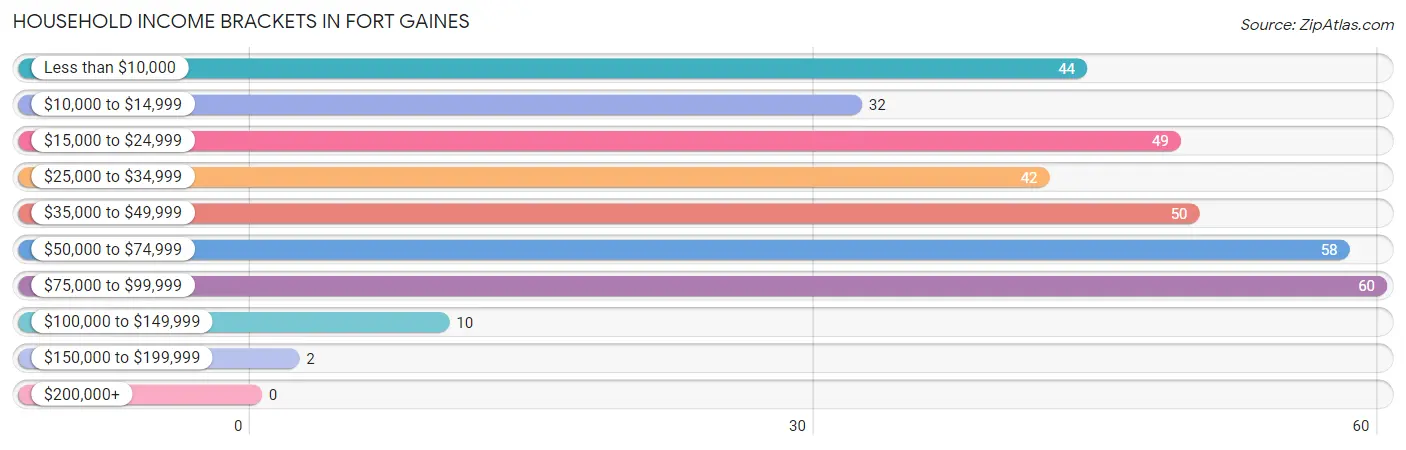
| Income Bracket | # Households | % Households |
| Less than $10,000 | 44 | 12.7% |
| $10,000 to $14,999 | 32 | 9.2% |
| $15,000 to $24,999 | 49 | 14.1% |
| $25,000 to $34,999 | 42 | 12.1% |
| $35,000 to $49,999 | 50 | 14.4% |
| $50,000 to $74,999 | 58 | 16.7% |
| $75,000 to $99,999 | 60 | 17.3% |
| $100,000 to $149,999 | 10 | 2.9% |
| $150,000 to $199,999 | 2 | 0.6% |
| $200,000+ | 0 | 0.0% |
Household Income by Householder Age in Fort Gaines
The median household income in Fort Gaines is $36,161, with the highest median household income of $48,516 found in the 45 to 64 years age bracket for the primary householder. A total of 101 households (29.1%) fall into this category. Meanwhile, the 15 to 24 years age bracket for the primary householder has the lowest median household income of $0, with 4 households (1.1%) in this group.
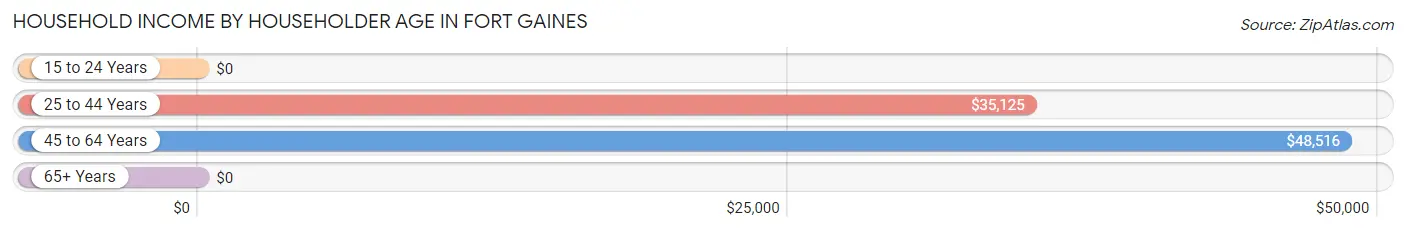
| Income Bracket | # Households | Median Income |
| 15 to 24 Years | 4 (1.1%) | $0 |
| 25 to 44 Years | 145 (41.8%) | $35,125 |
| 45 to 64 Years | 101 (29.1%) | $48,516 |
| 65+ Years | 97 (28.0%) | $0 |
| Total | 347 (100.0%) | $36,161 |
Poverty in Fort Gaines
Income Below Poverty by Sex and Age in Fort Gaines
With 27.6% poverty level for males and 40.7% for females among the residents of Fort Gaines, 6 to 11 year old males and under 5 year old females are the most vulnerable to poverty, with 10 males (66.7%) and 69 females (79.3%) in their respective age groups living below the poverty level.
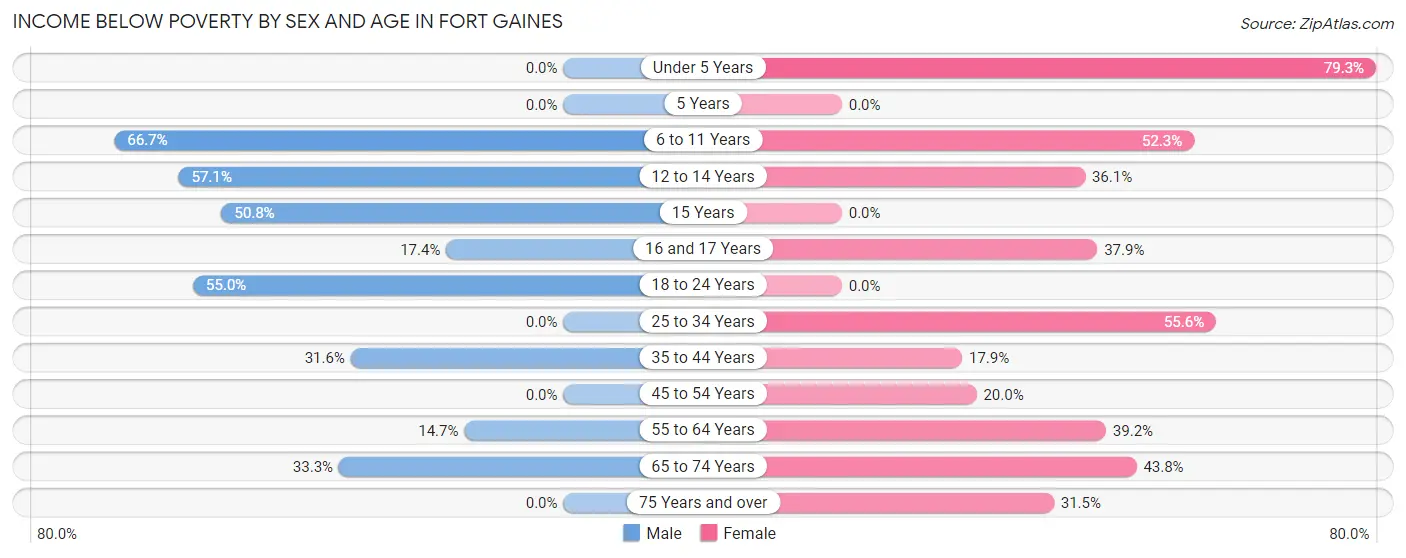
| Age Bracket | Male | Female |
| Under 5 Years | 0 (0.0%) | 69 (79.3%) |
| 5 Years | 0 (0.0%) | 0 (0.0%) |
| 6 to 11 Years | 10 (66.7%) | 34 (52.3%) |
| 12 to 14 Years | 20 (57.1%) | 13 (36.1%) |
| 15 Years | 33 (50.8%) | 0 (0.0%) |
| 16 and 17 Years | 4 (17.4%) | 11 (37.9%) |
| 18 to 24 Years | 22 (55.0%) | 0 (0.0%) |
| 25 to 34 Years | 0 (0.0%) | 30 (55.6%) |
| 35 to 44 Years | 18 (31.6%) | 10 (17.9%) |
| 45 to 54 Years | 0 (0.0%) | 6 (20.0%) |
| 55 to 64 Years | 5 (14.7%) | 20 (39.2%) |
| 65 to 74 Years | 11 (33.3%) | 7 (43.8%) |
| 75 Years and over | 0 (0.0%) | 17 (31.5%) |
| Total | 123 (27.6%) | 217 (40.7%) |
Income Above Poverty by Sex and Age in Fort Gaines
According to the poverty statistics in Fort Gaines, males aged under 5 years and females aged 5 years are the age groups that are most secure financially, with 100.0% of males and 100.0% of females in these age groups living above the poverty line.
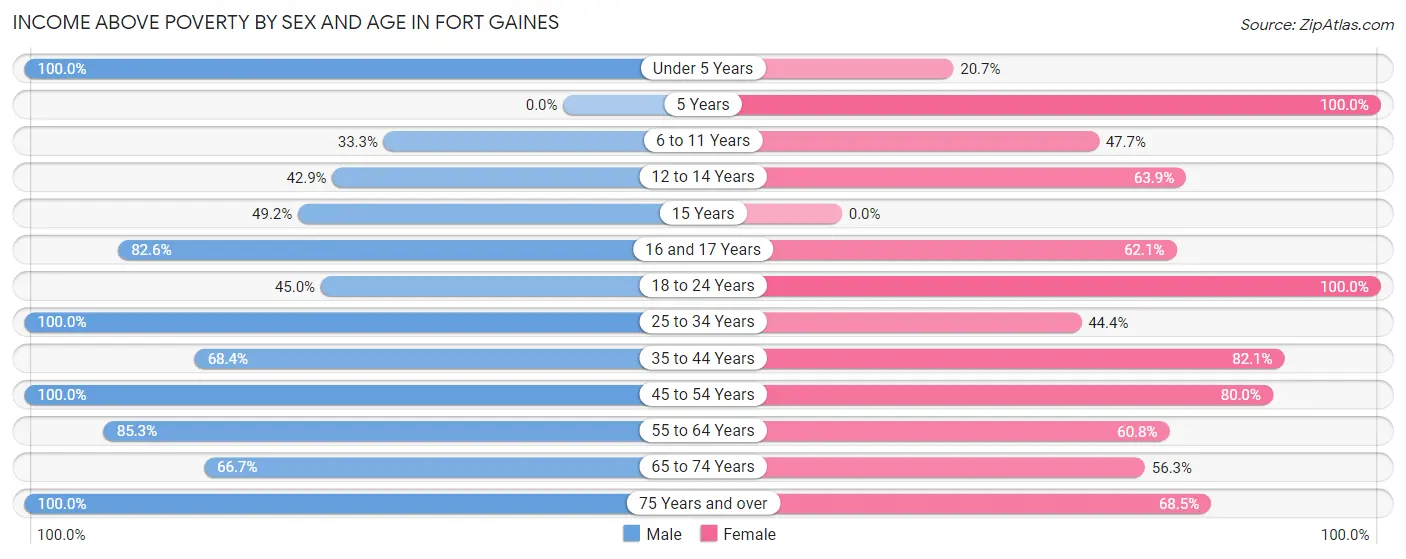
| Age Bracket | Male | Female |
| Under 5 Years | 23 (100.0%) | 18 (20.7%) |
| 5 Years | 0 (0.0%) | 6 (100.0%) |
| 6 to 11 Years | 5 (33.3%) | 31 (47.7%) |
| 12 to 14 Years | 15 (42.9%) | 23 (63.9%) |
| 15 Years | 32 (49.2%) | 0 (0.0%) |
| 16 and 17 Years | 19 (82.6%) | 18 (62.1%) |
| 18 to 24 Years | 18 (45.0%) | 49 (100.0%) |
| 25 to 34 Years | 67 (100.0%) | 24 (44.4%) |
| 35 to 44 Years | 39 (68.4%) | 46 (82.1%) |
| 45 to 54 Years | 35 (100.0%) | 24 (80.0%) |
| 55 to 64 Years | 29 (85.3%) | 31 (60.8%) |
| 65 to 74 Years | 22 (66.7%) | 9 (56.2%) |
| 75 Years and over | 18 (100.0%) | 37 (68.5%) |
| Total | 322 (72.4%) | 316 (59.3%) |
Income Below Poverty Among Married-Couple Families in Fort Gaines
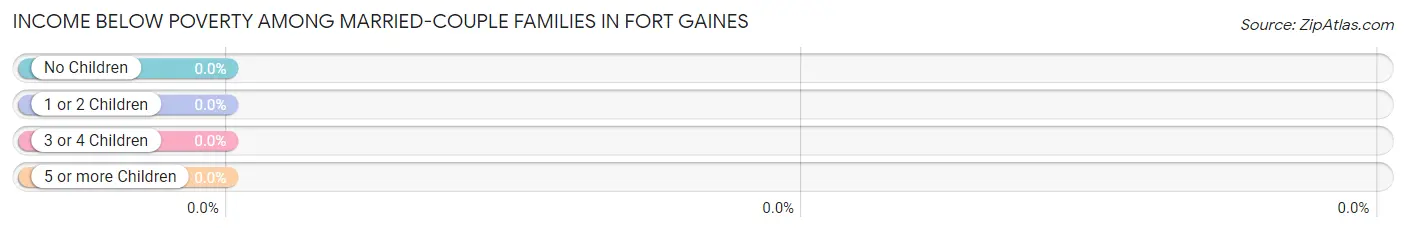
| Children | Above Poverty | Below Poverty |
| No Children | 31 (100.0%) | 0 (0.0%) |
| 1 or 2 Children | 29 (100.0%) | 0 (0.0%) |
| 3 or 4 Children | 10 (100.0%) | 0 (0.0%) |
| 5 or more Children | 0 (0.0%) | 0 (0.0%) |
| Total | 70 (100.0%) | 0 (0.0%) |
Income Below Poverty Among Single-Parent Households in Fort Gaines
According to the poverty data in Fort Gaines, 8.2% or 4 single-father households and 47.1% or 40 single-mother households are living below the poverty line. Among single-father households, those with no children have the highest poverty rate, with 4 households (9.5%) experiencing poverty. Likewise, among single-mother households, those with 5 or more children have the highest poverty rate, with 7 households (100.0%) falling below the poverty line.
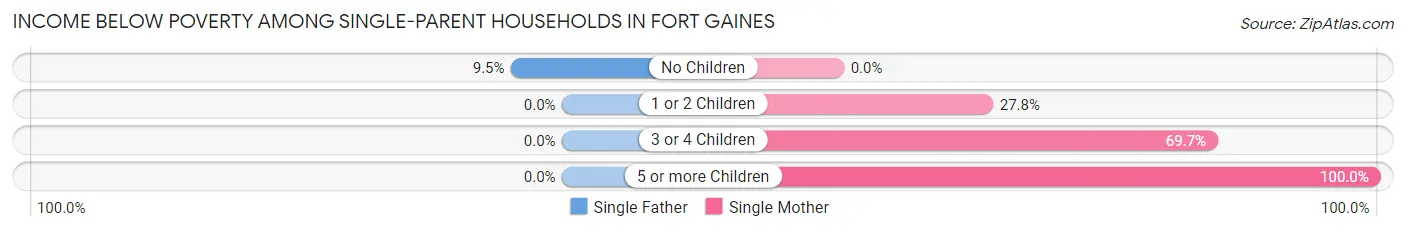
| Children | Single Father | Single Mother |
| No Children | 4 (9.5%) | 0 (0.0%) |
| 1 or 2 Children | 0 (0.0%) | 10 (27.8%) |
| 3 or 4 Children | 0 (0.0%) | 23 (69.7%) |
| 5 or more Children | 0 (0.0%) | 7 (100.0%) |
| Total | 4 (8.2%) | 40 (47.1%) |
Income Below Poverty Among Married-Couple vs Single-Parent Households in Fort Gaines
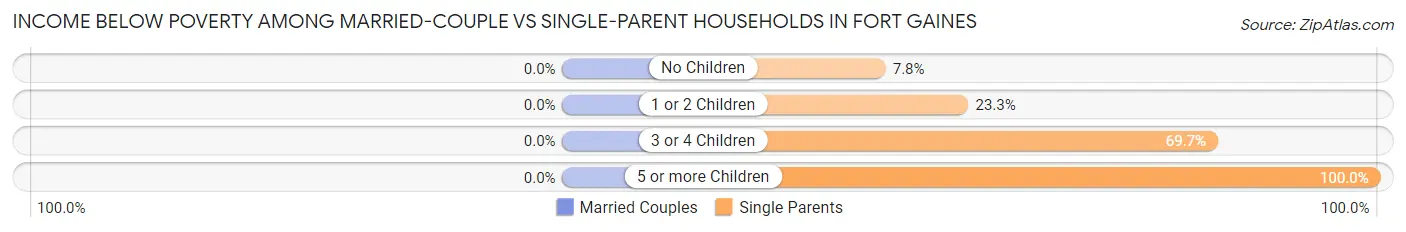
| Children | Married-Couple Families | Single-Parent Households |
| No Children | 0 (0.0%) | 4 (7.8%) |
| 1 or 2 Children | 0 (0.0%) | 10 (23.3%) |
| 3 or 4 Children | 0 (0.0%) | 23 (69.7%) |
| 5 or more Children | 0 (0.0%) | 7 (100.0%) |
| Total | 0 (0.0%) | 44 (32.8%) |
Race in Fort Gaines
The most populous races in Fort Gaines are Black / African American (862 | 83.3%), White / Caucasian (123 | 11.9%), and Asian (44 | 4.3%).
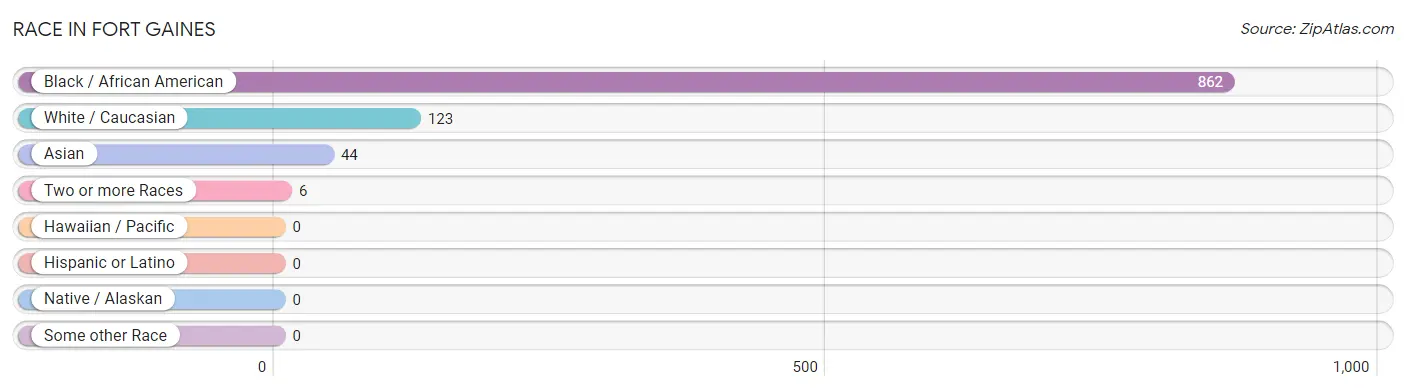
| Race | # Population | % Population |
| Asian | 44 | 4.3% |
| Black / African American | 862 | 83.3% |
| Hawaiian / Pacific | 0 | 0.0% |
| Hispanic or Latino | 0 | 0.0% |
| Native / Alaskan | 0 | 0.0% |
| White / Caucasian | 123 | 11.9% |
| Two or more Races | 6 | 0.6% |
| Some other Race | 0 | 0.0% |
| Total | 1,035 | 100.0% |
Ancestry in Fort Gaines
The most populous ancestries reported in Fort Gaines are American (61 | 5.9%), Thai (44 | 4.3%), English (21 | 2.0%), German (20 | 1.9%), and French (13 | 1.3%), together accounting for 15.4% of all Fort Gaines residents.
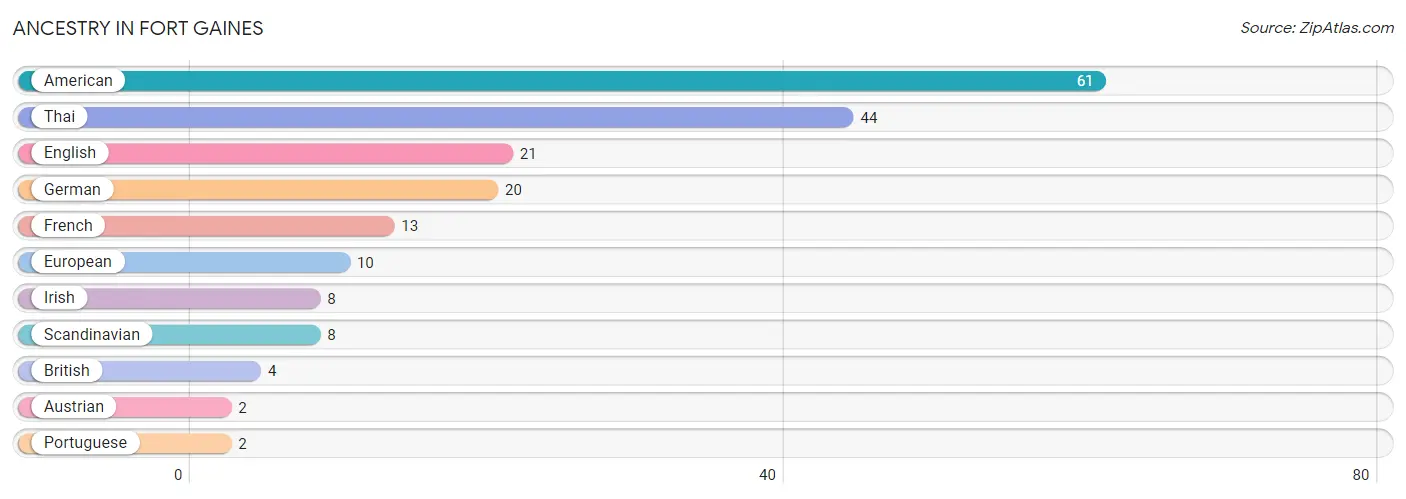
| Ancestry | # Population | % Population |
| American | 61 | 5.9% |
| Austrian | 2 | 0.2% |
| British | 4 | 0.4% |
| English | 21 | 2.0% |
| European | 10 | 1.0% |
| French | 13 | 1.3% |
| German | 20 | 1.9% |
| Irish | 8 | 0.8% |
| Portuguese | 2 | 0.2% |
| Scandinavian | 8 | 0.8% |
| Thai | 44 | 4.3% | View All 11 Rows |
Immigrants in Fort Gaines
The most numerous immigrant groups reported in Fort Gaines came from Asia (26 | 2.5%), India (26 | 2.5%), South Central Asia (26 | 2.5%), Canada (18 | 1.7%), and England (4 | 0.4%), together accounting for 9.7% of all Fort Gaines residents.
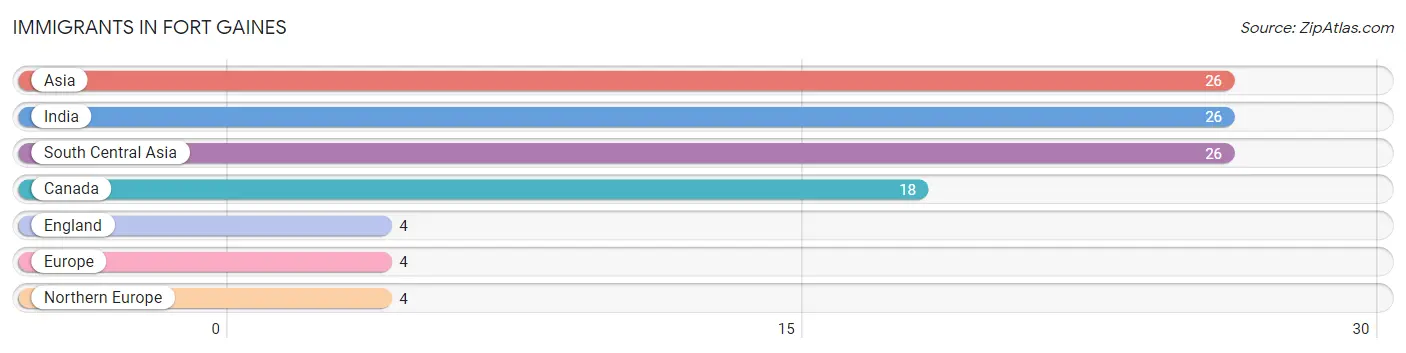
| Immigration Origin | # Population | % Population |
| Asia | 26 | 2.5% |
| Canada | 18 | 1.7% |
| England | 4 | 0.4% |
| Europe | 4 | 0.4% |
| India | 26 | 2.5% |
| Northern Europe | 4 | 0.4% |
| South Central Asia | 26 | 2.5% | View All 7 Rows |
Sex and Age in Fort Gaines
Sex and Age in Fort Gaines
The most populous age groups in Fort Gaines are 15 to 19 Years (110 | 23.3%) for men and Under 5 Years (87 | 15.4%) for women.
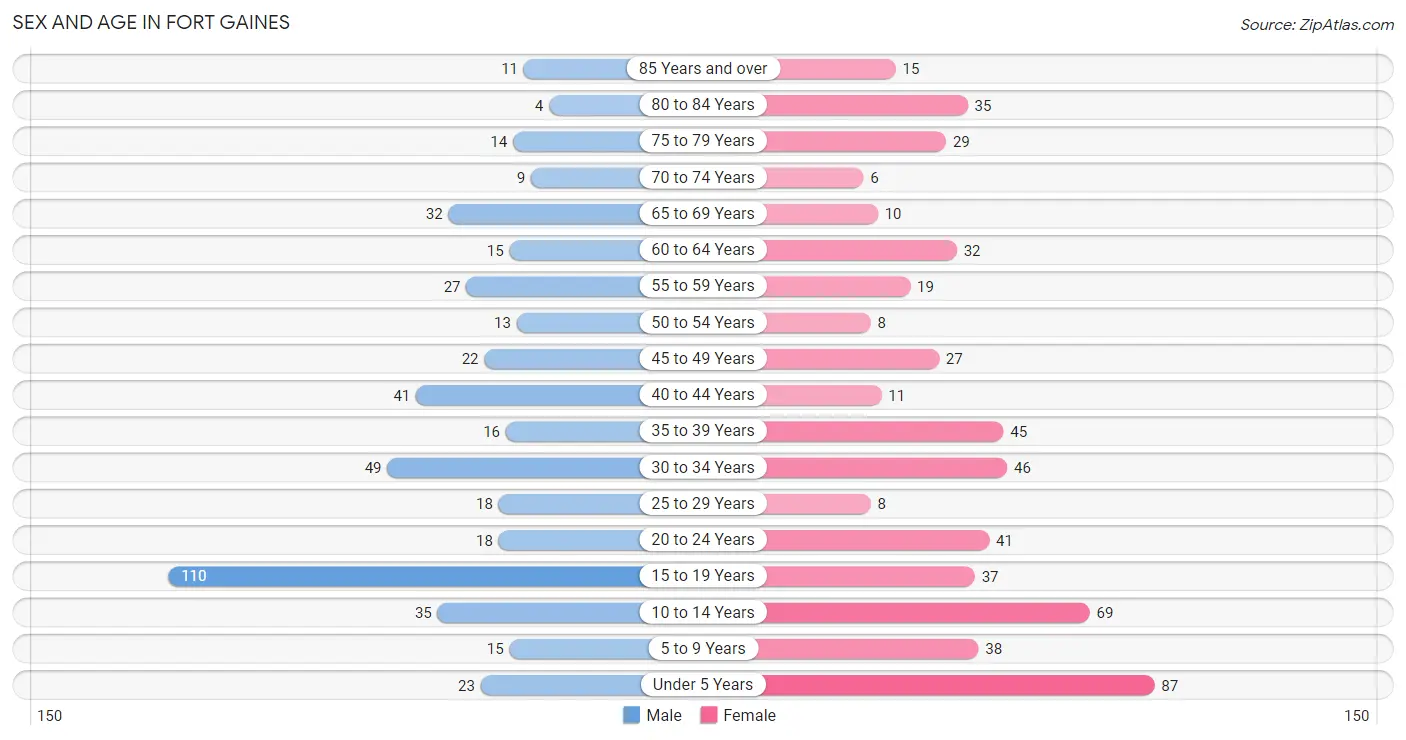
| Age Bracket | Male | Female |
| Under 5 Years | 23 (4.9%) | 87 (15.4%) |
| 5 to 9 Years | 15 (3.2%) | 38 (6.8%) |
| 10 to 14 Years | 35 (7.4%) | 69 (12.3%) |
| 15 to 19 Years | 110 (23.3%) | 37 (6.6%) |
| 20 to 24 Years | 18 (3.8%) | 41 (7.3%) |
| 25 to 29 Years | 18 (3.8%) | 8 (1.4%) |
| 30 to 34 Years | 49 (10.4%) | 46 (8.2%) |
| 35 to 39 Years | 16 (3.4%) | 45 (8.0%) |
| 40 to 44 Years | 41 (8.7%) | 11 (1.9%) |
| 45 to 49 Years | 22 (4.7%) | 27 (4.8%) |
| 50 to 54 Years | 13 (2.8%) | 8 (1.4%) |
| 55 to 59 Years | 27 (5.7%) | 19 (3.4%) |
| 60 to 64 Years | 15 (3.2%) | 32 (5.7%) |
| 65 to 69 Years | 32 (6.8%) | 10 (1.8%) |
| 70 to 74 Years | 9 (1.9%) | 6 (1.1%) |
| 75 to 79 Years | 14 (3.0%) | 29 (5.1%) |
| 80 to 84 Years | 4 (0.9%) | 35 (6.2%) |
| 85 Years and over | 11 (2.3%) | 15 (2.7%) |
| Total | 472 (100.0%) | 563 (100.0%) |
Families and Households in Fort Gaines
Median Family Size in Fort Gaines
The median family size in Fort Gaines is 4.08 persons per family, with single female/mother families (85 | 41.7%) accounting for the largest median family size of 4.88 persons per family. On the other hand, single male/father families (49 | 24.0%) represent the smallest median family size with 2.31 persons per family.
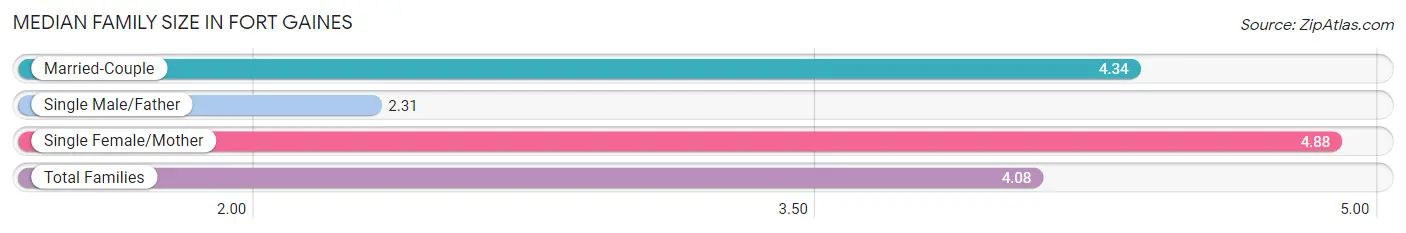
| Family Type | # Families | Family Size |
| Married-Couple | 70 (34.3%) | 4.34 |
| Single Male/Father | 49 (24.0%) | 2.31 |
| Single Female/Mother | 85 (41.7%) | 4.88 |
| Total Families | 204 (100.0%) | 4.08 |
Median Household Size in Fort Gaines
The median household size in Fort Gaines is 2.82 persons per household, with single female/mother households (85 | 24.5%) accounting for the largest median household size of 4.88 persons per household. non-family households (143 | 41.2%) represent the smallest median household size with 1.02 persons per household.
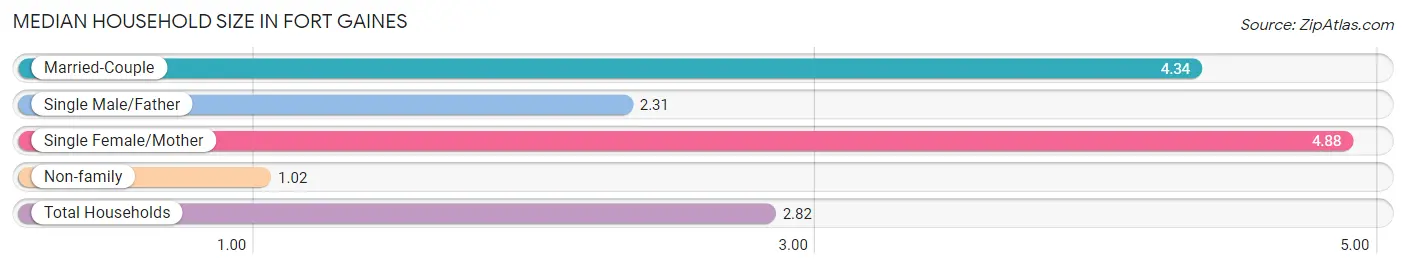
| Household Type | # Households | Household Size |
| Married-Couple | 70 (20.2%) | 4.34 |
| Single Male/Father | 49 (14.1%) | 2.31 |
| Single Female/Mother | 85 (24.5%) | 4.88 |
| Non-family | 143 (41.2%) | 1.02 |
| Total Households | 347 (100.0%) | 2.82 |
Household Size by Marriage Status in Fort Gaines
Out of a total of 347 households in Fort Gaines, 204 (58.8%) are family households, while 143 (41.2%) are nonfamily households. The most numerous type of family households are 2-person households, comprising 95, and the most common type of nonfamily households are 1-person households, comprising 137.
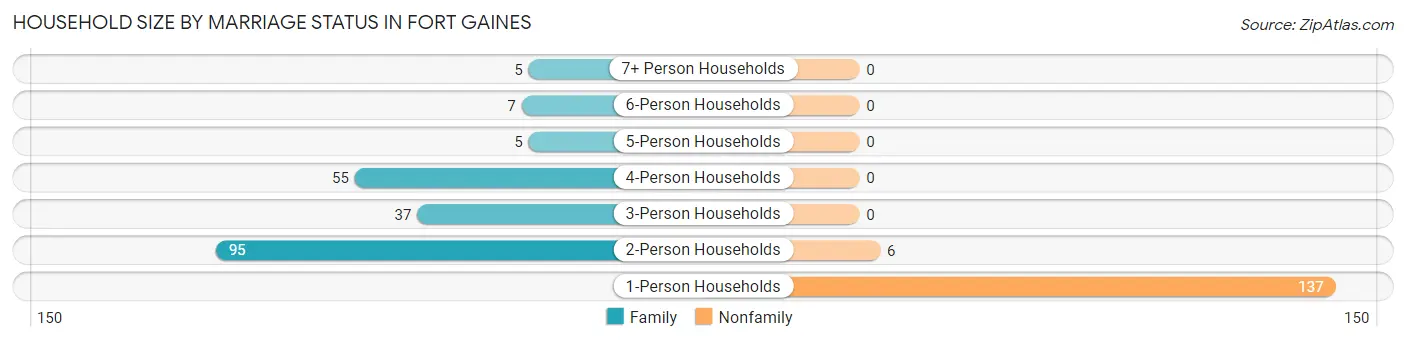
| Household Size | Family Households | Nonfamily Households |
| 1-Person Households | - | 137 (39.5%) |
| 2-Person Households | 95 (27.4%) | 6 (1.7%) |
| 3-Person Households | 37 (10.7%) | 0 (0.0%) |
| 4-Person Households | 55 (15.9%) | 0 (0.0%) |
| 5-Person Households | 5 (1.4%) | 0 (0.0%) |
| 6-Person Households | 7 (2.0%) | 0 (0.0%) |
| 7+ Person Households | 5 (1.4%) | 0 (0.0%) |
| Total | 204 (58.8%) | 143 (41.2%) |
Female Fertility in Fort Gaines
Fertility by Age in Fort Gaines
| Age Bracket | Women with Births | Births / 1,000 Women |
| 15 to 19 years | 0 (0.0%) | 0.0 |
| 20 to 34 years | 0 (0.0%) | 0.0 |
| 35 to 50 years | 0 (0.0%) | 0.0 |
| Total | 0 (0.0%) | 0.0 |
Fertility by Age by Marriage Status in Fort Gaines
| Age Bracket | Married | Unmarried |
| 15 to 19 years | 0 (0.0%) | 0 (0.0%) |
| 20 to 34 years | 0 (0.0%) | 0 (0.0%) |
| 35 to 50 years | 0 (0.0%) | 0 (0.0%) |
| Total | 0 (0.0%) | 0 (0.0%) |
Fertility by Education in Fort Gaines
| Educational Attainment | Women with Births | Births / 1,000 Women |
| Less than High School | 0 (0.0%) | 0.0 |
| High School Diploma | 0 (0.0%) | 0.0 |
| College or Associate's Degree | 0 (0.0%) | 0.0 |
| Bachelor's Degree | 0 (0.0%) | 0.0 |
| Graduate Degree | 0 (0.0%) | 0.0 |
| Total | 0 (0.0%) | 0.0 |
Fertility by Education by Marriage Status in Fort Gaines
| Educational Attainment | Married | Unmarried |
| Less than High School | 0 (0.0%) | 0 (0.0%) |
| High School Diploma | 0 (0.0%) | 0 (0.0%) |
| College or Associate's Degree | 0 (0.0%) | 0 (0.0%) |
| Bachelor's Degree | 0 (0.0%) | 0 (0.0%) |
| Graduate Degree | 0 (0.0%) | 0 (0.0%) |
| Total | 0 (0.0%) | 0 (0.0%) |
Employment Characteristics in Fort Gaines
Employment by Class of Employer in Fort Gaines
Among the 339 employed individuals in Fort Gaines, private company employees (241 | 71.1%), local government employees (57 | 16.8%), and state government employees (24 | 7.1%) make up the most common classes of employment.
| Employer Class | # Employees | % Employees |
| Private Company Employees | 241 | 71.1% |
| Self-Employed (Incorporated) | 0 | 0.0% |
| Self-Employed (Not Incorporated) | 0 | 0.0% |
| Not-for-profit Organizations | 17 | 5.0% |
| Local Government Employees | 57 | 16.8% |
| State Government Employees | 24 | 7.1% |
| Federal Government Employees | 0 | 0.0% |
| Unpaid Family Workers | 0 | 0.0% |
| Total | 339 | 100.0% |
Employment Status by Age in Fort Gaines
According to the labor force statistics for Fort Gaines, out of the total population over 16 years of age (703), 54.2% or 381 individuals are in the labor force, with 9.2% or 35 of them unemployed. The age group with the highest labor force participation rate is 25 to 29 years, with 100.0% or 26 individuals in the labor force. Within the labor force, the 16 to 19 years age range has the highest percentage of unemployed individuals, with 25.9% or 7 of them being unemployed.
| Age Bracket | In Labor Force | Unemployed |
| 16 to 19 Years | 27 (32.9%) | 7 (25.9%) |
| 20 to 24 Years | 26 (44.1%) | 0 (0.0%) |
| 25 to 29 Years | 26 (100.0%) | 0 (0.0%) |
| 30 to 34 Years | 88 (92.6%) | 0 (0.0%) |
| 35 to 44 Years | 113 (100.0%) | 28 (24.8%) |
| 45 to 54 Years | 48 (68.6%) | 0 (0.0%) |
| 55 to 59 Years | 22 (47.8%) | 0 (0.0%) |
| 60 to 64 Years | 4 (8.5%) | 0 (0.0%) |
| 65 to 74 Years | 27 (47.4%) | 0 (0.0%) |
| 75 Years and over | 0 (0.0%) | 0 (0.0%) |
| Total | 381 (54.2%) | 35 (9.2%) |
Employment Status by Educational Attainment in Fort Gaines
According to labor force statistics for Fort Gaines, 75.8% of individuals (301) out of the total population between 25 and 64 years of age (397) are in the labor force, with 9.3% or 28 of them being unemployed. The group with the highest labor force participation rate are those with the educational attainment of high school diploma, with 84.3% or 134 individuals in the labor force. Within the labor force, individuals with less than high school education have the highest percentage of unemployment, with 50.0% or 10 of them being unemployed.
| Educational Attainment | In Labor Force | Unemployed |
| Less than High School | 20 (48.8%) | 20 (50.0%) |
| High School Diploma | 134 (84.3%) | 21 (13.4%) |
| College / Associate Degree | 129 (78.2%) | 0 (0.0%) |
| Bachelor's Degree or higher | 18 (56.3%) | 0 (0.0%) |
| Total | 301 (75.8%) | 37 (9.3%) |
Employment Occupations by Sex in Fort Gaines
Management, Business, Science and Arts Occupations
The most common Management, Business, Science and Arts occupations in Fort Gaines are Community & Social Service (24 | 6.9%), Health Diagnosing & Treating (15 | 4.3%), Management (14 | 4.1%), Education, Arts & Media (13 | 3.8%), and Education Instruction & Library (11 | 3.2%).
Management, Business, Science and Arts Occupations by Sex
Within the Management, Business, Science and Arts occupations in Fort Gaines, the most male-oriented occupations are Education, Arts & Media (100.0%), and Community & Social Service (54.2%), while the most female-oriented occupations are Management (100.0%), Education Instruction & Library (100.0%), and Health Diagnosing & Treating (100.0%).
| Occupation | Male | Female |
| Management | 0 (0.0%) | 14 (100.0%) |
| Business & Financial | 0 (0.0%) | 0 (0.0%) |
| Computers, Engineering & Science | 0 (0.0%) | 0 (0.0%) |
| Computers & Mathematics | 0 (0.0%) | 0 (0.0%) |
| Architecture & Engineering | 0 (0.0%) | 0 (0.0%) |
| Life, Physical & Social Science | 0 (0.0%) | 0 (0.0%) |
| Community & Social Service | 13 (54.2%) | 11 (45.8%) |
| Education, Arts & Media | 13 (100.0%) | 0 (0.0%) |
| Legal Services & Support | 0 (0.0%) | 0 (0.0%) |
| Education Instruction & Library | 0 (0.0%) | 11 (100.0%) |
| Arts, Media & Entertainment | 0 (0.0%) | 0 (0.0%) |
| Health Diagnosing & Treating | 0 (0.0%) | 15 (100.0%) |
| Health Technologists | 0 (0.0%) | 6 (100.0%) |
| Total (Category) | 13 (24.5%) | 40 (75.5%) |
| Total (Overall) | 198 (57.2%) | 148 (42.8%) |
Services Occupations
The most common Services occupations in Fort Gaines are Security & Protection (44 | 12.7%), Law Enforcement (44 | 12.7%), Healthcare Support (22 | 6.4%), Cleaning & Maintenance (13 | 3.8%), and Food Preparation & Serving (9 | 2.6%).
Services Occupations by Sex
Within the Services occupations in Fort Gaines, the most male-oriented occupations are Security & Protection (50.0%), Law Enforcement (50.0%), and Food Preparation & Serving (44.4%), while the most female-oriented occupations are Healthcare Support (100.0%), Cleaning & Maintenance (61.5%), and Food Preparation & Serving (55.6%).
| Occupation | Male | Female |
| Healthcare Support | 0 (0.0%) | 22 (100.0%) |
| Security & Protection | 22 (50.0%) | 22 (50.0%) |
| Firefighting & Prevention | 0 (0.0%) | 0 (0.0%) |
| Law Enforcement | 22 (50.0%) | 22 (50.0%) |
| Food Preparation & Serving | 4 (44.4%) | 5 (55.6%) |
| Cleaning & Maintenance | 5 (38.5%) | 8 (61.5%) |
| Personal Care & Service | 0 (0.0%) | 0 (0.0%) |
| Total (Category) | 31 (35.2%) | 57 (64.8%) |
| Total (Overall) | 198 (57.2%) | 148 (42.8%) |
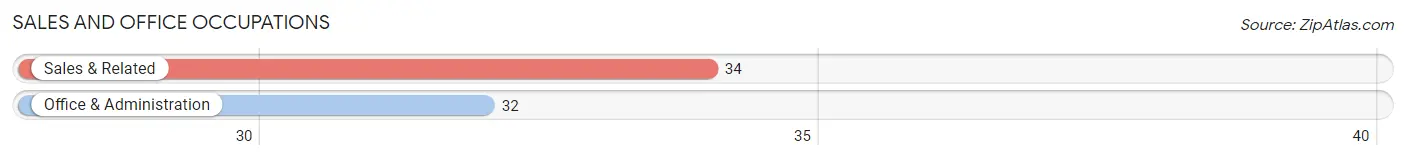
Sales and Office Occupations
The most common Sales and Office occupations in Fort Gaines are Sales & Related (34 | 9.8%), and Office & Administration (32 | 9.2%).
Sales and Office Occupations by Sex
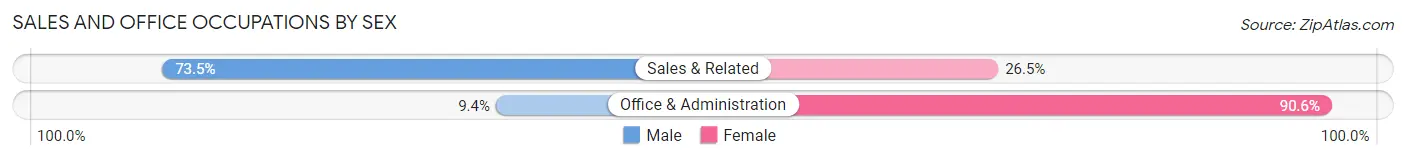
| Occupation | Male | Female |
| Sales & Related | 25 (73.5%) | 9 (26.5%) |
| Office & Administration | 3 (9.4%) | 29 (90.6%) |
| Total (Category) | 28 (42.4%) | 38 (57.6%) |
| Total (Overall) | 198 (57.2%) | 148 (42.8%) |
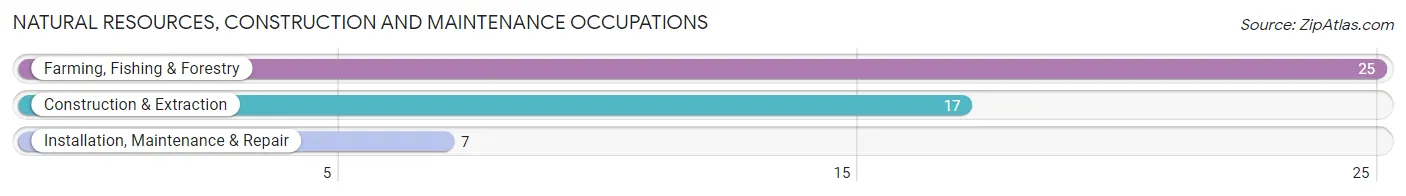
Natural Resources, Construction and Maintenance Occupations
The most common Natural Resources, Construction and Maintenance occupations in Fort Gaines are Farming, Fishing & Forestry (25 | 7.2%), Construction & Extraction (17 | 4.9%), and Installation, Maintenance & Repair (7 | 2.0%).
Natural Resources, Construction and Maintenance Occupations by Sex
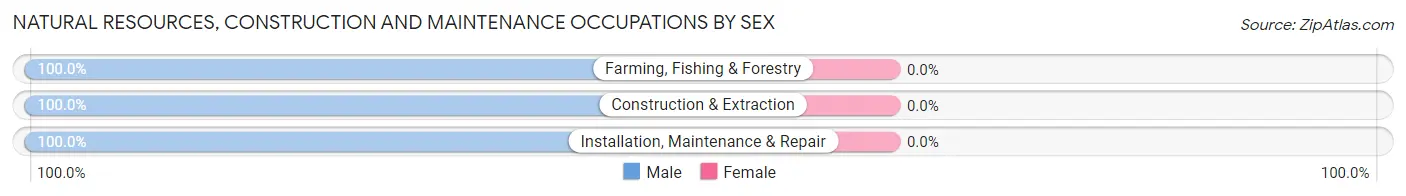
| Occupation | Male | Female |
| Farming, Fishing & Forestry | 25 (100.0%) | 0 (0.0%) |
| Construction & Extraction | 17 (100.0%) | 0 (0.0%) |
| Installation, Maintenance & Repair | 7 (100.0%) | 0 (0.0%) |
| Total (Category) | 49 (100.0%) | 0 (0.0%) |
| Total (Overall) | 198 (57.2%) | 148 (42.8%) |
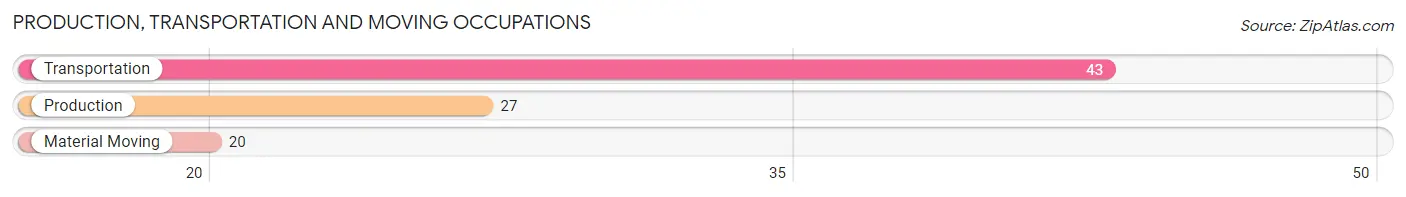
Production, Transportation and Moving Occupations
The most common Production, Transportation and Moving occupations in Fort Gaines are Transportation (43 | 12.4%), Production (27 | 7.8%), and Material Moving (20 | 5.8%).
Production, Transportation and Moving Occupations by Sex
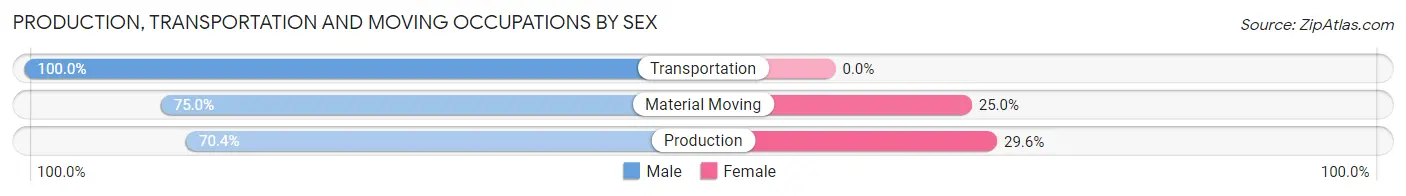
| Occupation | Male | Female |
| Production | 19 (70.4%) | 8 (29.6%) |
| Transportation | 43 (100.0%) | 0 (0.0%) |
| Material Moving | 15 (75.0%) | 5 (25.0%) |
| Total (Category) | 77 (85.6%) | 13 (14.4%) |
| Total (Overall) | 198 (57.2%) | 148 (42.8%) |
Employment Industries by Sex in Fort Gaines
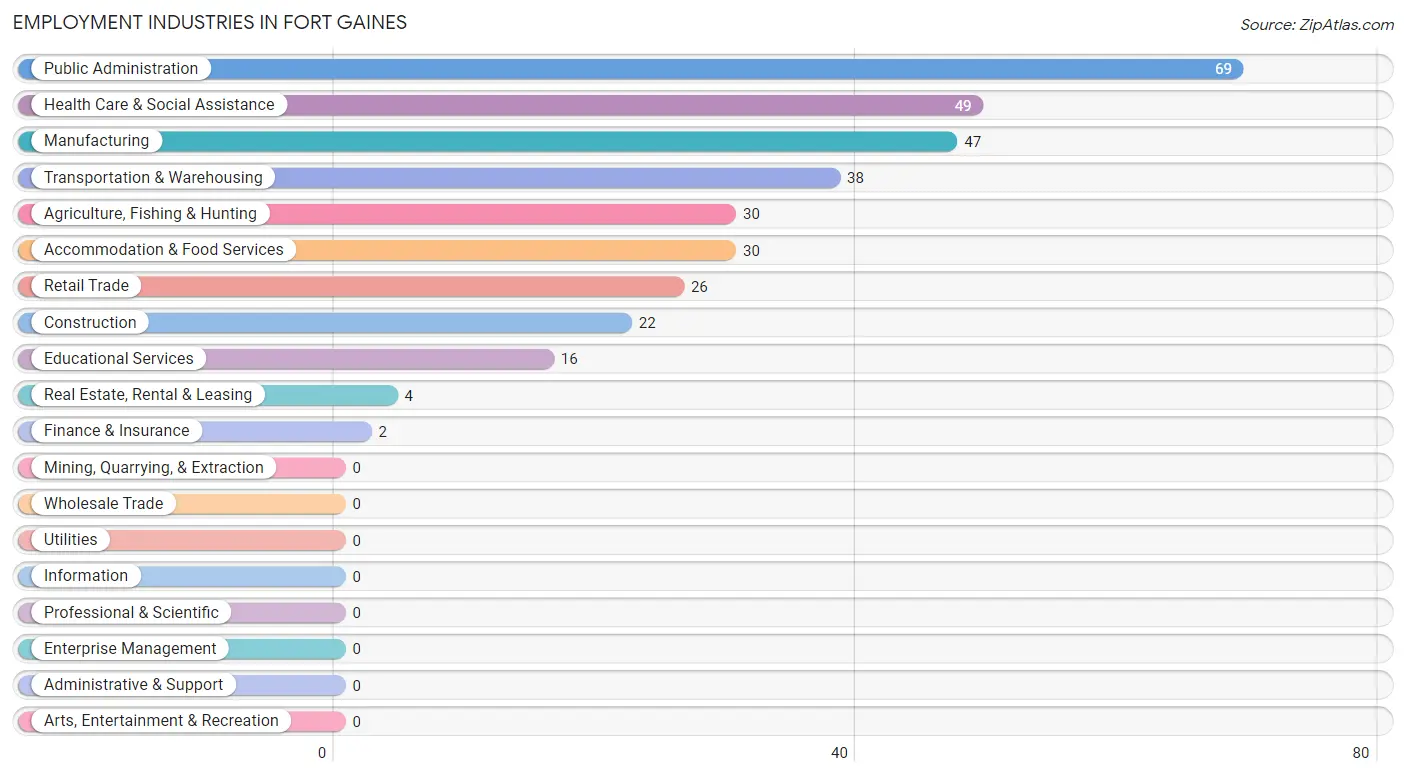
Employment Industries in Fort Gaines
The major employment industries in Fort Gaines include Public Administration (69 | 19.9%), Health Care & Social Assistance (49 | 14.2%), Manufacturing (47 | 13.6%), Transportation & Warehousing (38 | 11.0%), and Agriculture, Fishing & Hunting (30 | 8.7%).
Employment Industries by Sex in Fort Gaines
The Fort Gaines industries that see more men than women are Agriculture, Fishing & Hunting (100.0%), Transportation & Warehousing (100.0%), and Construction (90.9%), whereas the industries that tend to have a higher number of women are Finance & Insurance (100.0%), Real Estate, Rental & Leasing (100.0%), and Health Care & Social Assistance (85.7%).
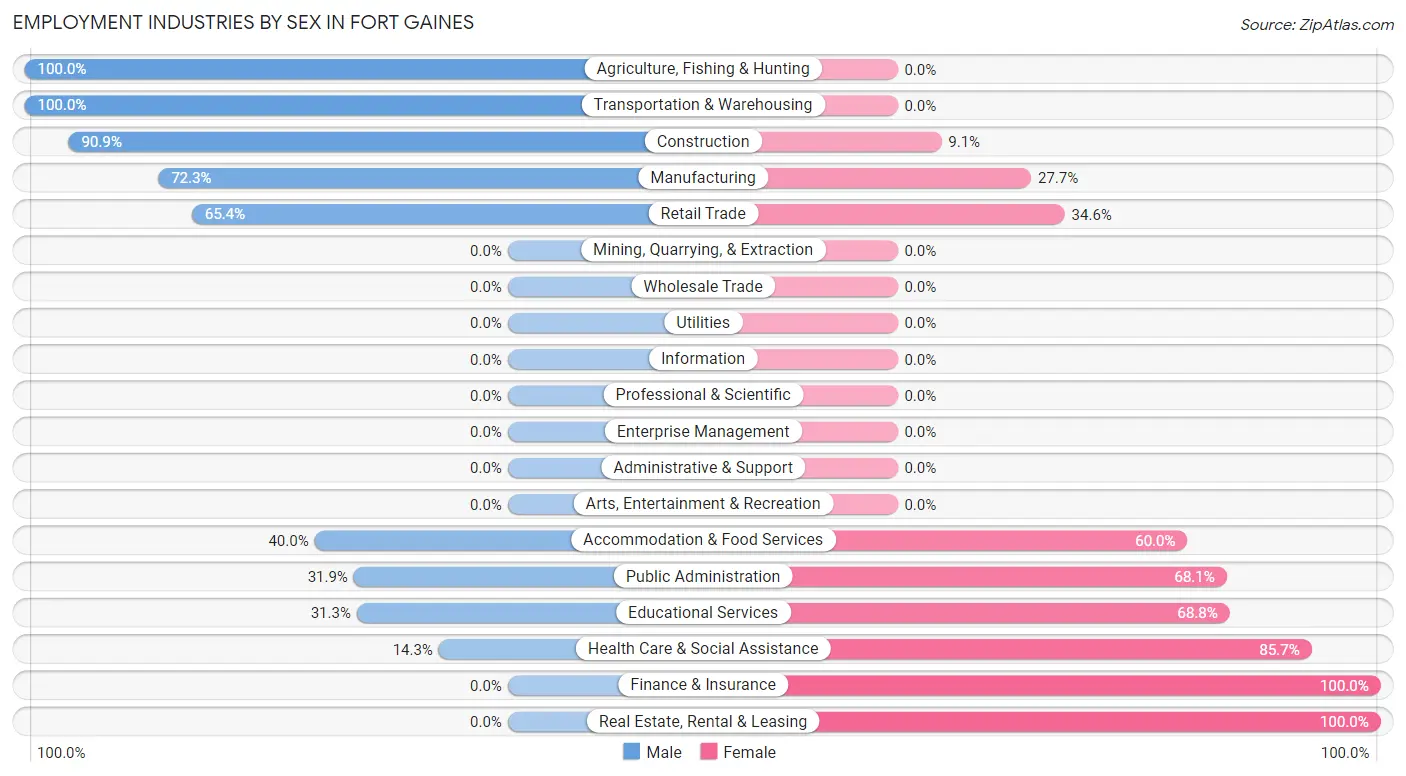
| Industry | Male | Female |
| Agriculture, Fishing & Hunting | 30 (100.0%) | 0 (0.0%) |
| Mining, Quarrying, & Extraction | 0 (0.0%) | 0 (0.0%) |
| Construction | 20 (90.9%) | 2 (9.1%) |
| Manufacturing | 34 (72.3%) | 13 (27.7%) |
| Wholesale Trade | 0 (0.0%) | 0 (0.0%) |
| Retail Trade | 17 (65.4%) | 9 (34.6%) |
| Transportation & Warehousing | 38 (100.0%) | 0 (0.0%) |
| Utilities | 0 (0.0%) | 0 (0.0%) |
| Information | 0 (0.0%) | 0 (0.0%) |
| Finance & Insurance | 0 (0.0%) | 2 (100.0%) |
| Real Estate, Rental & Leasing | 0 (0.0%) | 4 (100.0%) |
| Professional & Scientific | 0 (0.0%) | 0 (0.0%) |
| Enterprise Management | 0 (0.0%) | 0 (0.0%) |
| Administrative & Support | 0 (0.0%) | 0 (0.0%) |
| Educational Services | 5 (31.2%) | 11 (68.8%) |
| Health Care & Social Assistance | 7 (14.3%) | 42 (85.7%) |
| Arts, Entertainment & Recreation | 0 (0.0%) | 0 (0.0%) |
| Accommodation & Food Services | 12 (40.0%) | 18 (60.0%) |
| Public Administration | 22 (31.9%) | 47 (68.1%) |
| Total | 198 (57.2%) | 148 (42.8%) |
Education in Fort Gaines
School Enrollment in Fort Gaines
The most common levels of schooling among the 374 students in Fort Gaines are high school (144 | 38.5%), elementary school (80 | 21.4%), and college / undergraduate (60 | 16.0%).
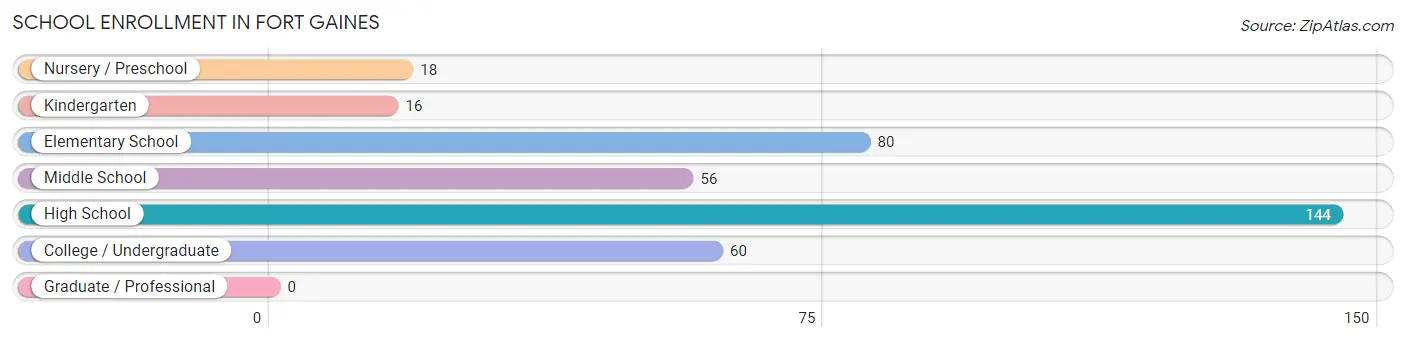
| School Level | # Students | % Students |
| Nursery / Preschool | 18 | 4.8% |
| Kindergarten | 16 | 4.3% |
| Elementary School | 80 | 21.4% |
| Middle School | 56 | 15.0% |
| High School | 144 | 38.5% |
| College / Undergraduate | 60 | 16.0% |
| Graduate / Professional | 0 | 0.0% |
| Total | 374 | 100.0% |
School Enrollment by Age by Funding Source in Fort Gaines
Out of a total of 374 students who are enrolled in schools in Fort Gaines, 23 (6.1%) attend a private institution, while the remaining 351 (93.9%) are enrolled in public schools. The age group of 25 to 34 year olds has the highest likelihood of being enrolled in private schools, with 23 (100.0% in the age bracket) enrolled. Conversely, the age group of 3 to 4 year olds has the lowest likelihood of being enrolled in a private school, with 18 (100.0% in the age bracket) attending a public institution.
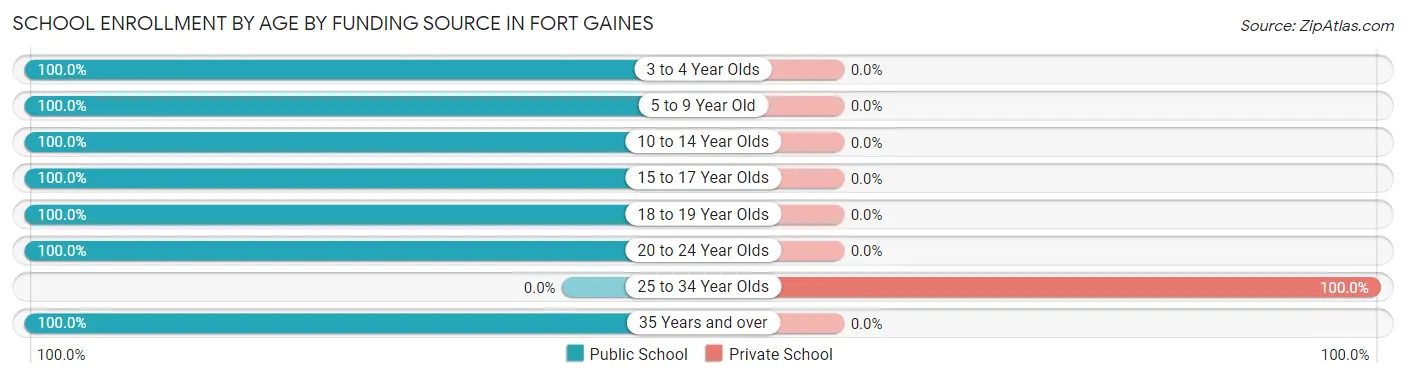
| Age Bracket | Public School | Private School |
| 3 to 4 Year Olds | 18 (100.0%) | 0 (0.0%) |
| 5 to 9 Year Old | 53 (100.0%) | 0 (0.0%) |
| 10 to 14 Year Olds | 104 (100.0%) | 0 (0.0%) |
| 15 to 17 Year Olds | 117 (100.0%) | 0 (0.0%) |
| 18 to 19 Year Olds | 22 (100.0%) | 0 (0.0%) |
| 20 to 24 Year Olds | 33 (100.0%) | 0 (0.0%) |
| 25 to 34 Year Olds | 0 (0.0%) | 23 (100.0%) |
| 35 Years and over | 4 (100.0%) | 0 (0.0%) |
| Total | 351 (93.9%) | 23 (6.1%) |
Educational Attainment by Field of Study in Fort Gaines
Liberal arts & history (13 | 23.6%), arts & humanities (12 | 21.8%), social sciences (7 | 12.7%), science & technology (7 | 12.7%), and education (5 | 9.1%) are the most common fields of study among 55 individuals in Fort Gaines who have obtained a bachelor's degree or higher.
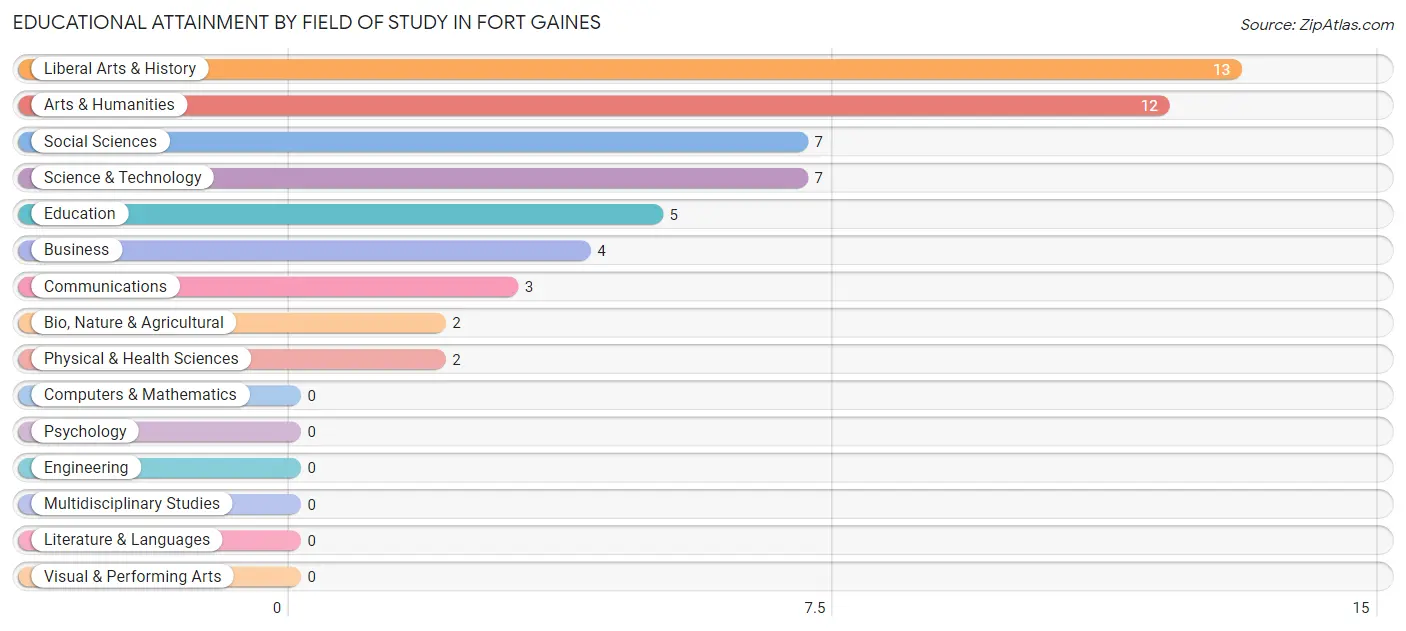
| Field of Study | # Graduates | % Graduates |
| Computers & Mathematics | 0 | 0.0% |
| Bio, Nature & Agricultural | 2 | 3.6% |
| Physical & Health Sciences | 2 | 3.6% |
| Psychology | 0 | 0.0% |
| Social Sciences | 7 | 12.7% |
| Engineering | 0 | 0.0% |
| Multidisciplinary Studies | 0 | 0.0% |
| Science & Technology | 7 | 12.7% |
| Business | 4 | 7.3% |
| Education | 5 | 9.1% |
| Literature & Languages | 0 | 0.0% |
| Liberal Arts & History | 13 | 23.6% |
| Visual & Performing Arts | 0 | 0.0% |
| Communications | 3 | 5.4% |
| Arts & Humanities | 12 | 21.8% |
| Total | 55 | 100.0% |
Transportation & Commute in Fort Gaines
Vehicle Availability by Sex in Fort Gaines
The most prevalent vehicle ownership categories in Fort Gaines are males with 1 vehicle (53, accounting for 26.8%) and females with 1 vehicle (60, making up 37.6%).
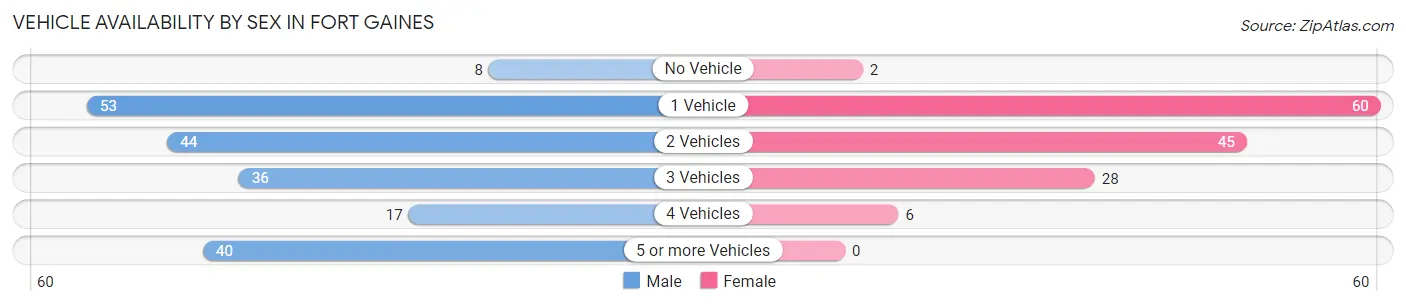
| Vehicles Available | Male | Female |
| No Vehicle | 8 (4.0%) | 2 (1.4%) |
| 1 Vehicle | 53 (26.8%) | 60 (42.5%) |
| 2 Vehicles | 44 (22.2%) | 45 (31.9%) |
| 3 Vehicles | 36 (18.2%) | 28 (19.9%) |
| 4 Vehicles | 17 (8.6%) | 6 (4.3%) |
| 5 or more Vehicles | 40 (20.2%) | 0 (0.0%) |
| Total | 198 (100.0%) | 141 (100.0%) |
Commute Time in Fort Gaines
The most frequently occuring commute durations in Fort Gaines are less than 5 minutes (79 commuters, 25.7%), 30 to 34 minutes (61 commuters, 19.9%), and 10 to 14 minutes (50 commuters, 16.3%).
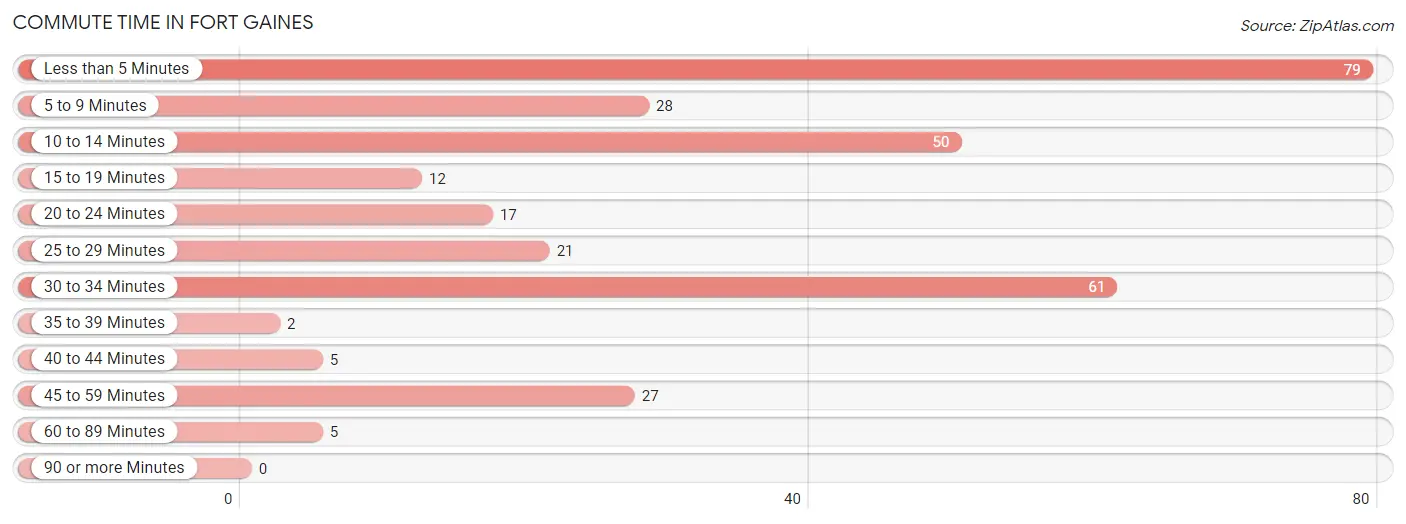
| Commute Time | # Commuters | % Commuters |
| Less than 5 Minutes | 79 | 25.7% |
| 5 to 9 Minutes | 28 | 9.1% |
| 10 to 14 Minutes | 50 | 16.3% |
| 15 to 19 Minutes | 12 | 3.9% |
| 20 to 24 Minutes | 17 | 5.5% |
| 25 to 29 Minutes | 21 | 6.8% |
| 30 to 34 Minutes | 61 | 19.9% |
| 35 to 39 Minutes | 2 | 0.6% |
| 40 to 44 Minutes | 5 | 1.6% |
| 45 to 59 Minutes | 27 | 8.8% |
| 60 to 89 Minutes | 5 | 1.6% |
| 90 or more Minutes | 0 | 0.0% |
Commute Time by Sex in Fort Gaines
The most common commute times in Fort Gaines are 10 to 14 minutes (46 commuters, 27.7%) for males and less than 5 minutes (46 commuters, 32.6%) for females.
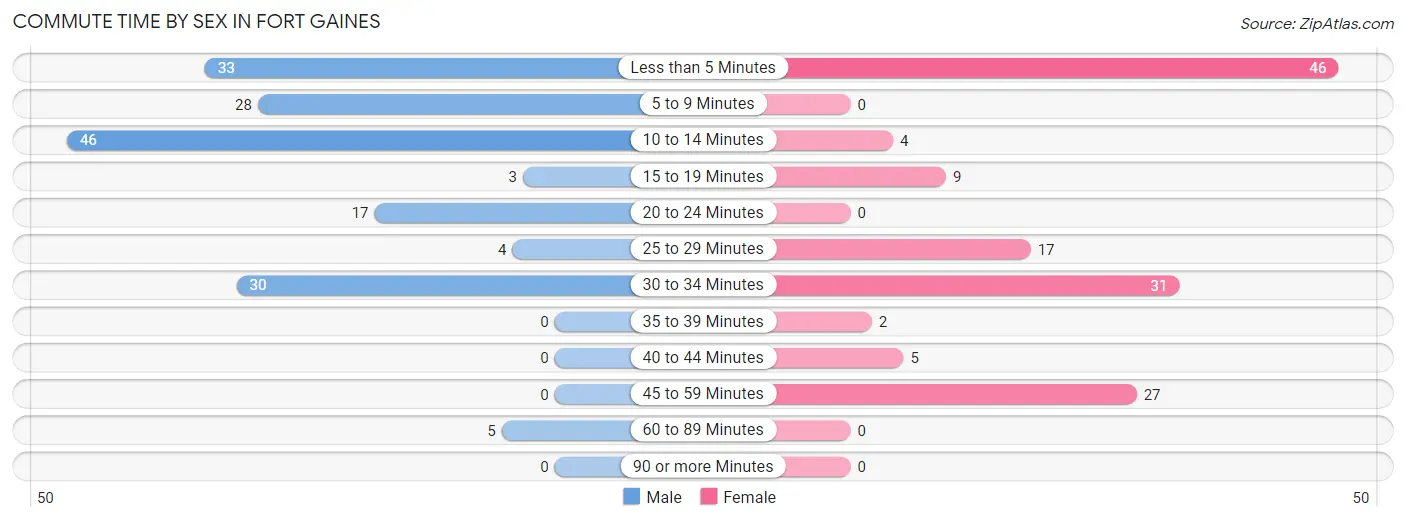
| Commute Time | Male | Female |
| Less than 5 Minutes | 33 (19.9%) | 46 (32.6%) |
| 5 to 9 Minutes | 28 (16.9%) | 0 (0.0%) |
| 10 to 14 Minutes | 46 (27.7%) | 4 (2.8%) |
| 15 to 19 Minutes | 3 (1.8%) | 9 (6.4%) |
| 20 to 24 Minutes | 17 (10.2%) | 0 (0.0%) |
| 25 to 29 Minutes | 4 (2.4%) | 17 (12.1%) |
| 30 to 34 Minutes | 30 (18.1%) | 31 (22.0%) |
| 35 to 39 Minutes | 0 (0.0%) | 2 (1.4%) |
| 40 to 44 Minutes | 0 (0.0%) | 5 (3.5%) |
| 45 to 59 Minutes | 0 (0.0%) | 27 (19.2%) |
| 60 to 89 Minutes | 5 (3.0%) | 0 (0.0%) |
| 90 or more Minutes | 0 (0.0%) | 0 (0.0%) |
Time of Departure to Work by Sex in Fort Gaines
The most frequent times of departure to work in Fort Gaines are 7:30 AM to 7:59 AM (35, 21.1%) for males and 7:00 AM to 7:29 AM (39, 27.7%) for females.
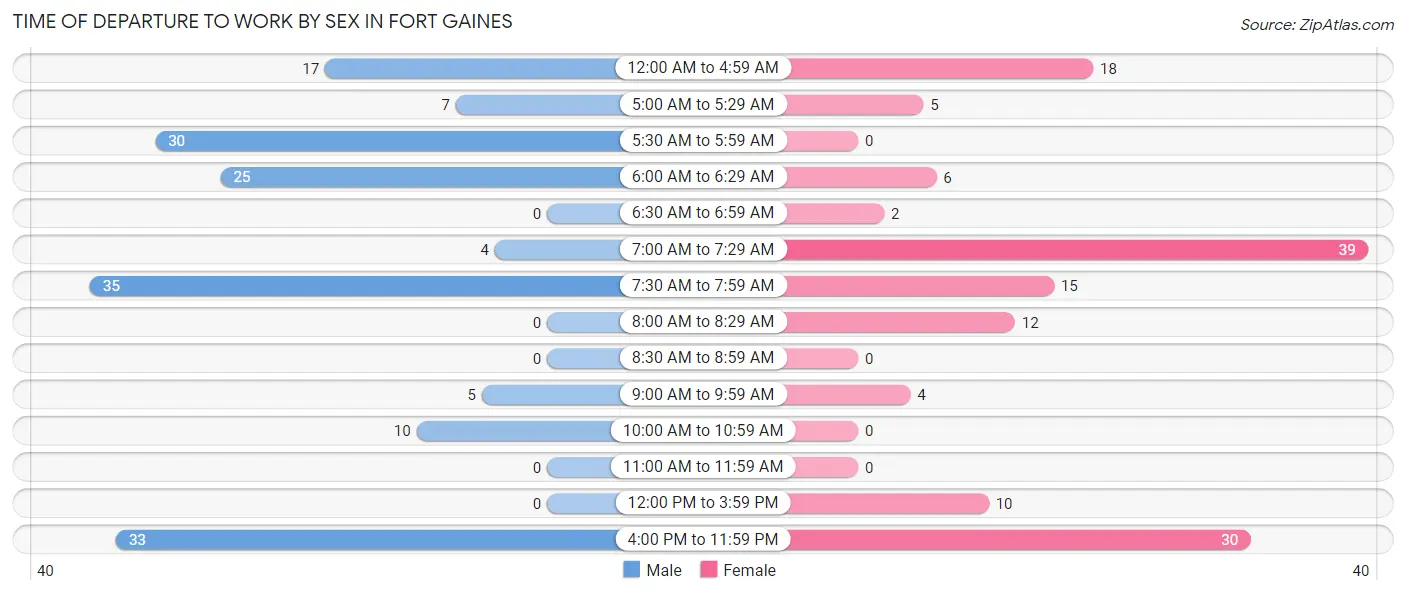
| Time of Departure | Male | Female |
| 12:00 AM to 4:59 AM | 17 (10.2%) | 18 (12.8%) |
| 5:00 AM to 5:29 AM | 7 (4.2%) | 5 (3.5%) |
| 5:30 AM to 5:59 AM | 30 (18.1%) | 0 (0.0%) |
| 6:00 AM to 6:29 AM | 25 (15.1%) | 6 (4.3%) |
| 6:30 AM to 6:59 AM | 0 (0.0%) | 2 (1.4%) |
| 7:00 AM to 7:29 AM | 4 (2.4%) | 39 (27.7%) |
| 7:30 AM to 7:59 AM | 35 (21.1%) | 15 (10.6%) |
| 8:00 AM to 8:29 AM | 0 (0.0%) | 12 (8.5%) |
| 8:30 AM to 8:59 AM | 0 (0.0%) | 0 (0.0%) |
| 9:00 AM to 9:59 AM | 5 (3.0%) | 4 (2.8%) |
| 10:00 AM to 10:59 AM | 10 (6.0%) | 0 (0.0%) |
| 11:00 AM to 11:59 AM | 0 (0.0%) | 0 (0.0%) |
| 12:00 PM to 3:59 PM | 0 (0.0%) | 10 (7.1%) |
| 4:00 PM to 11:59 PM | 33 (19.9%) | 30 (21.3%) |
| Total | 166 (100.0%) | 141 (100.0%) |
Housing Occupancy in Fort Gaines
Occupancy by Ownership in Fort Gaines
Of the total 347 dwellings in Fort Gaines, owner-occupied units account for 119 (34.3%), while renter-occupied units make up 228 (65.7%).
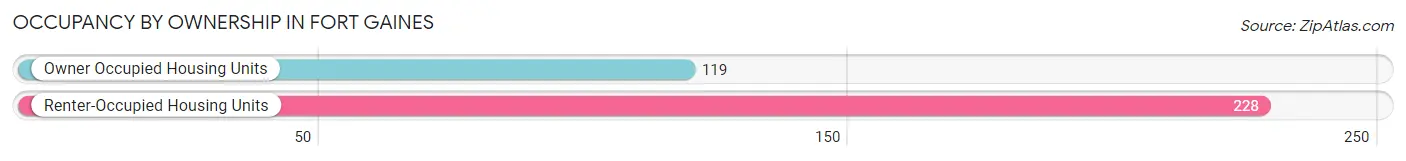
| Occupancy | # Housing Units | % Housing Units |
| Owner Occupied Housing Units | 119 | 34.3% |
| Renter-Occupied Housing Units | 228 | 65.7% |
| Total Occupied Housing Units | 347 | 100.0% |
Occupancy by Household Size in Fort Gaines
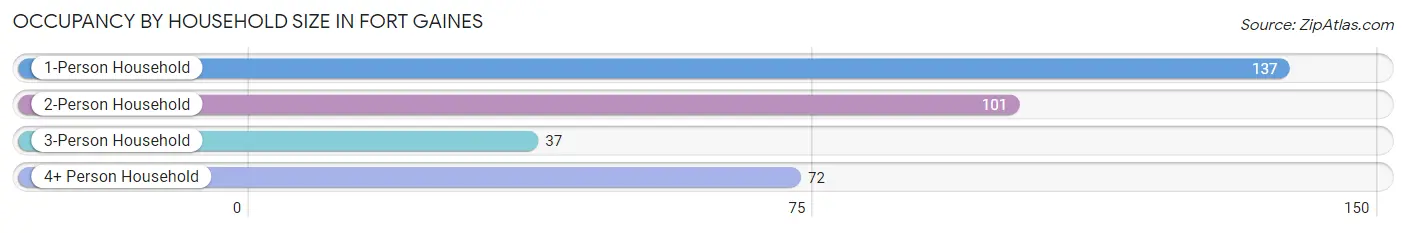
| Household Size | # Housing Units | % Housing Units |
| 1-Person Household | 137 | 39.5% |
| 2-Person Household | 101 | 29.1% |
| 3-Person Household | 37 | 10.7% |
| 4+ Person Household | 72 | 20.7% |
| Total Housing Units | 347 | 100.0% |
Occupancy by Ownership by Household Size in Fort Gaines
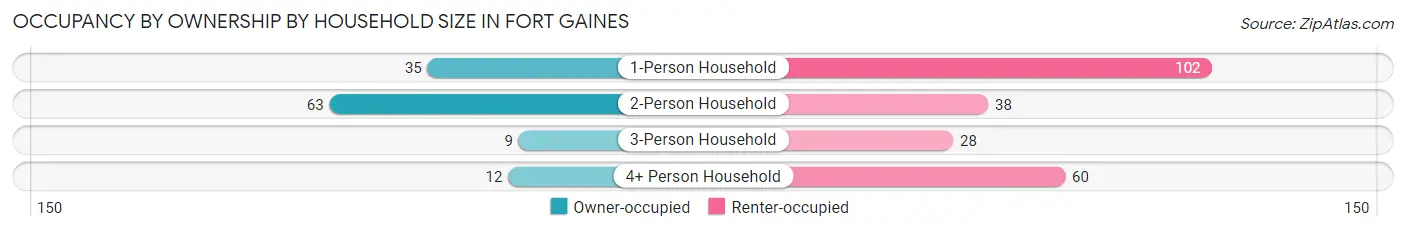
| Household Size | Owner-occupied | Renter-occupied |
| 1-Person Household | 35 (25.6%) | 102 (74.5%) |
| 2-Person Household | 63 (62.4%) | 38 (37.6%) |
| 3-Person Household | 9 (24.3%) | 28 (75.7%) |
| 4+ Person Household | 12 (16.7%) | 60 (83.3%) |
| Total Housing Units | 119 (34.3%) | 228 (65.7%) |
Occupancy by Educational Attainment in Fort Gaines
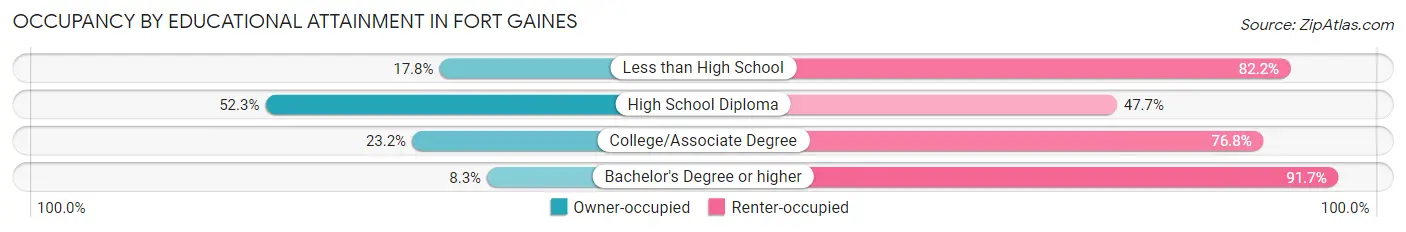
| Household Size | Owner-occupied | Renter-occupied |
| Less than High School | 8 (17.8%) | 37 (82.2%) |
| High School Diploma | 80 (52.3%) | 73 (47.7%) |
| College/Associate Degree | 29 (23.2%) | 96 (76.8%) |
| Bachelor's Degree or higher | 2 (8.3%) | 22 (91.7%) |
Occupancy by Age of Householder in Fort Gaines
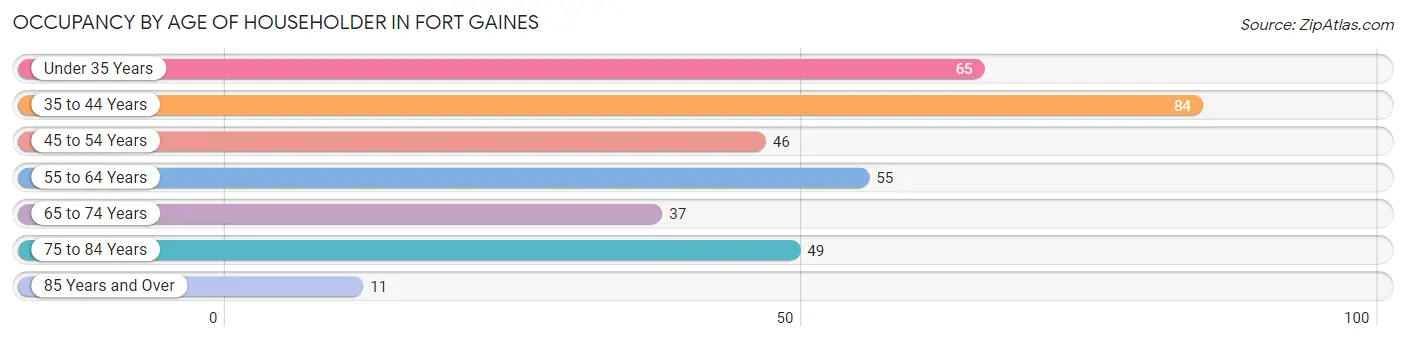
| Age Bracket | # Households | % Households |
| Under 35 Years | 65 | 18.7% |
| 35 to 44 Years | 84 | 24.2% |
| 45 to 54 Years | 46 | 13.3% |
| 55 to 64 Years | 55 | 15.9% |
| 65 to 74 Years | 37 | 10.7% |
| 75 to 84 Years | 49 | 14.1% |
| 85 Years and Over | 11 | 3.2% |
| Total | 347 | 100.0% |
Housing Finances in Fort Gaines
Median Income by Occupancy in Fort Gaines
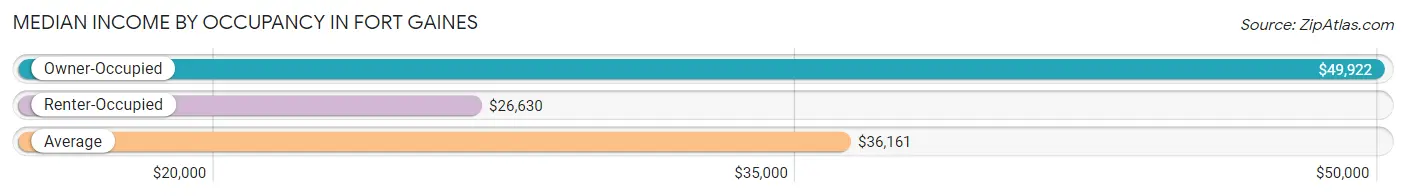
| Occupancy Type | # Households | Median Income |
| Owner-Occupied | 119 (34.3%) | $49,922 |
| Renter-Occupied | 228 (65.7%) | $26,630 |
| Average | 347 (100.0%) | $36,161 |
Occupancy by Householder Income Bracket in Fort Gaines
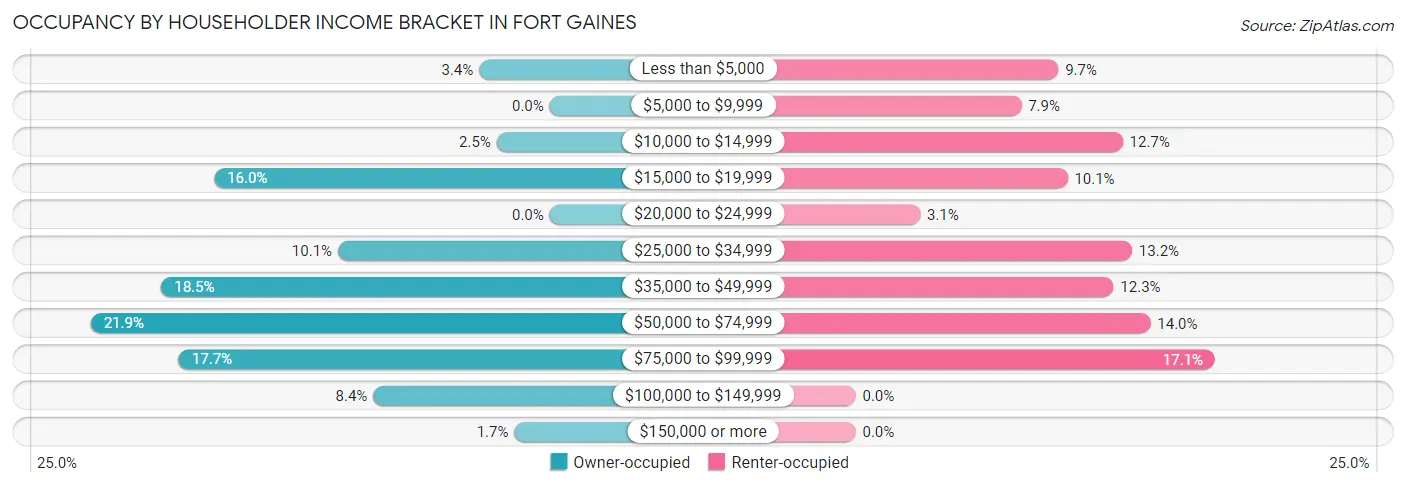
| Income Bracket | Owner-occupied | Renter-occupied |
| Less than $5,000 | 4 (3.4%) | 22 (9.7%) |
| $5,000 to $9,999 | 0 (0.0%) | 18 (7.9%) |
| $10,000 to $14,999 | 3 (2.5%) | 29 (12.7%) |
| $15,000 to $19,999 | 19 (16.0%) | 23 (10.1%) |
| $20,000 to $24,999 | 0 (0.0%) | 7 (3.1%) |
| $25,000 to $34,999 | 12 (10.1%) | 30 (13.2%) |
| $35,000 to $49,999 | 22 (18.5%) | 28 (12.3%) |
| $50,000 to $74,999 | 26 (21.8%) | 32 (14.0%) |
| $75,000 to $99,999 | 21 (17.6%) | 39 (17.1%) |
| $100,000 to $149,999 | 10 (8.4%) | 0 (0.0%) |
| $150,000 or more | 2 (1.7%) | 0 (0.0%) |
| Total | 119 (100.0%) | 228 (100.0%) |
Monthly Housing Cost Tiers in Fort Gaines
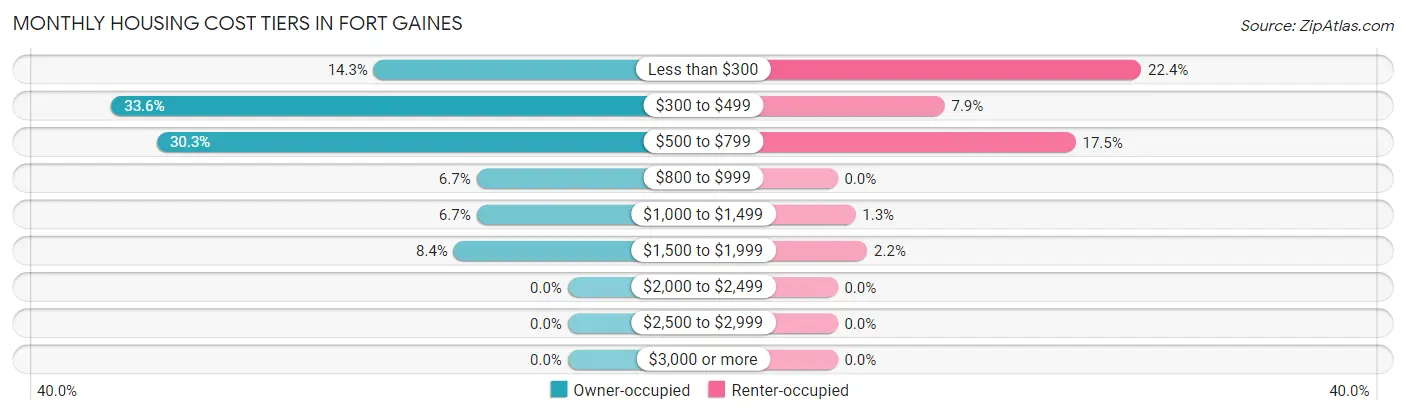
| Monthly Cost | Owner-occupied | Renter-occupied |
| Less than $300 | 17 (14.3%) | 51 (22.4%) |
| $300 to $499 | 40 (33.6%) | 18 (7.9%) |
| $500 to $799 | 36 (30.2%) | 40 (17.5%) |
| $800 to $999 | 8 (6.7%) | 0 (0.0%) |
| $1,000 to $1,499 | 8 (6.7%) | 3 (1.3%) |
| $1,500 to $1,999 | 10 (8.4%) | 5 (2.2%) |
| $2,000 to $2,499 | 0 (0.0%) | 0 (0.0%) |
| $2,500 to $2,999 | 0 (0.0%) | 0 (0.0%) |
| $3,000 or more | 0 (0.0%) | 0 (0.0%) |
| Total | 119 (100.0%) | 228 (100.0%) |
Physical Housing Characteristics in Fort Gaines
Housing Structures in Fort Gaines
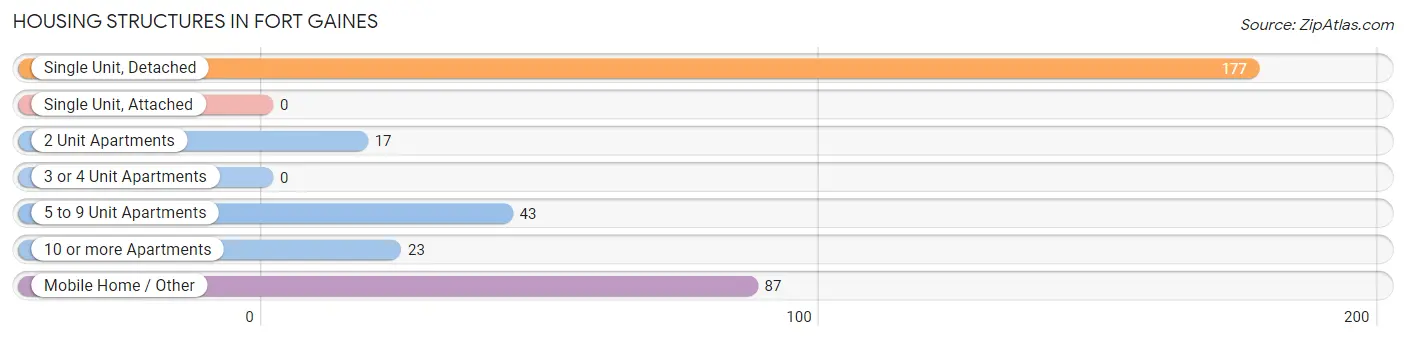
| Structure Type | # Housing Units | % Housing Units |
| Single Unit, Detached | 177 | 51.0% |
| Single Unit, Attached | 0 | 0.0% |
| 2 Unit Apartments | 17 | 4.9% |
| 3 or 4 Unit Apartments | 0 | 0.0% |
| 5 to 9 Unit Apartments | 43 | 12.4% |
| 10 or more Apartments | 23 | 6.6% |
| Mobile Home / Other | 87 | 25.1% |
| Total | 347 | 100.0% |
Housing Structures by Occupancy in Fort Gaines
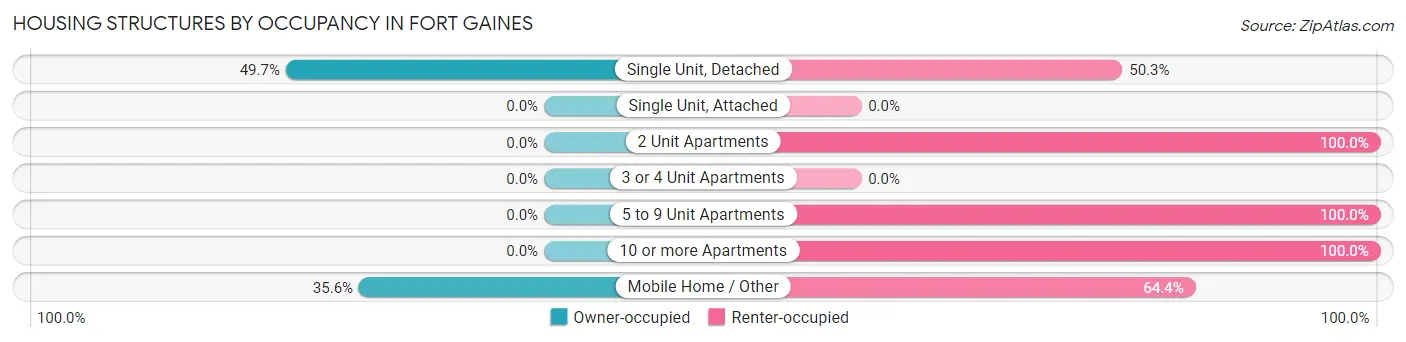
| Structure Type | Owner-occupied | Renter-occupied |
| Single Unit, Detached | 88 (49.7%) | 89 (50.3%) |
| Single Unit, Attached | 0 (0.0%) | 0 (0.0%) |
| 2 Unit Apartments | 0 (0.0%) | 17 (100.0%) |
| 3 or 4 Unit Apartments | 0 (0.0%) | 0 (0.0%) |
| 5 to 9 Unit Apartments | 0 (0.0%) | 43 (100.0%) |
| 10 or more Apartments | 0 (0.0%) | 23 (100.0%) |
| Mobile Home / Other | 31 (35.6%) | 56 (64.4%) |
| Total | 119 (34.3%) | 228 (65.7%) |
Housing Structures by Number of Rooms in Fort Gaines
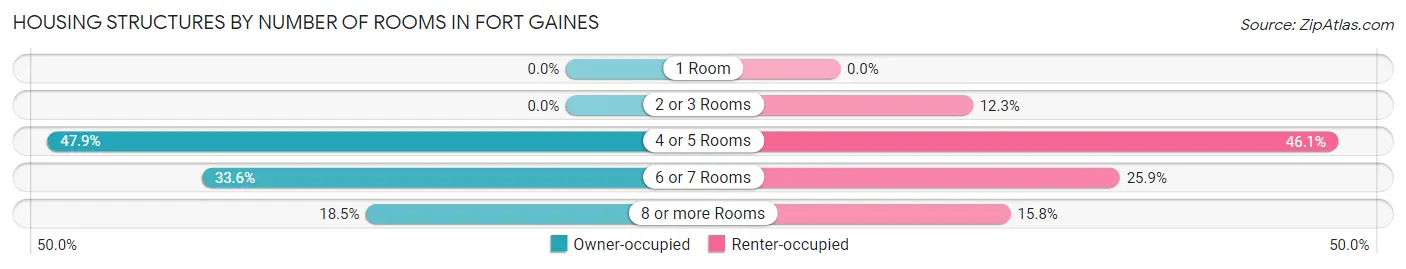
| Number of Rooms | Owner-occupied | Renter-occupied |
| 1 Room | 0 (0.0%) | 0 (0.0%) |
| 2 or 3 Rooms | 0 (0.0%) | 28 (12.3%) |
| 4 or 5 Rooms | 57 (47.9%) | 105 (46.1%) |
| 6 or 7 Rooms | 40 (33.6%) | 59 (25.9%) |
| 8 or more Rooms | 22 (18.5%) | 36 (15.8%) |
| Total | 119 (100.0%) | 228 (100.0%) |
Housing Structure by Heating Type in Fort Gaines
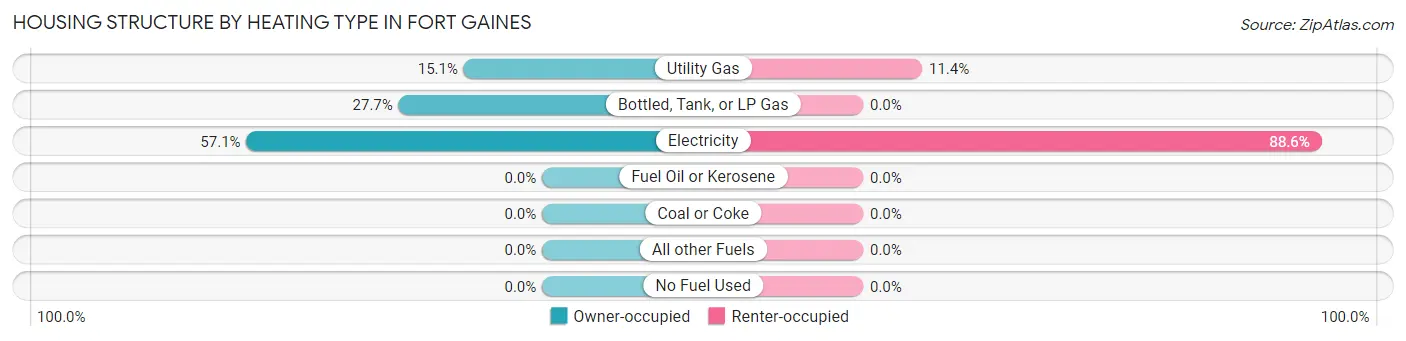
| Heating Type | Owner-occupied | Renter-occupied |
| Utility Gas | 18 (15.1%) | 26 (11.4%) |
| Bottled, Tank, or LP Gas | 33 (27.7%) | 0 (0.0%) |
| Electricity | 68 (57.1%) | 202 (88.6%) |
| Fuel Oil or Kerosene | 0 (0.0%) | 0 (0.0%) |
| Coal or Coke | 0 (0.0%) | 0 (0.0%) |
| All other Fuels | 0 (0.0%) | 0 (0.0%) |
| No Fuel Used | 0 (0.0%) | 0 (0.0%) |
| Total | 119 (100.0%) | 228 (100.0%) |
Household Vehicle Usage in Fort Gaines
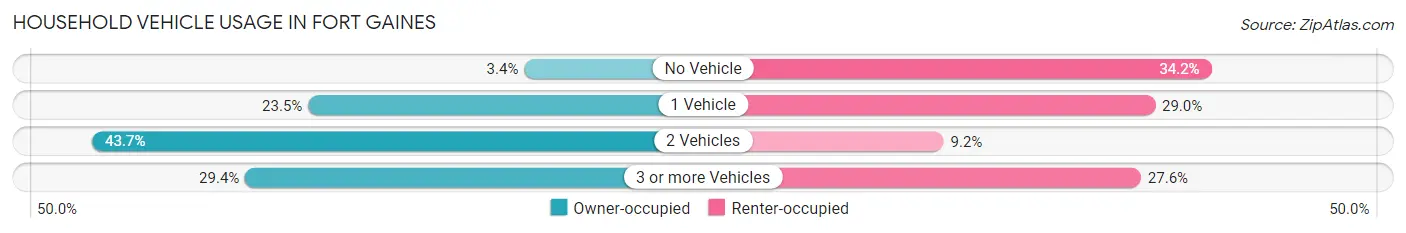
| Vehicles per Household | Owner-occupied | Renter-occupied |
| No Vehicle | 4 (3.4%) | 78 (34.2%) |
| 1 Vehicle | 28 (23.5%) | 66 (28.9%) |
| 2 Vehicles | 52 (43.7%) | 21 (9.2%) |
| 3 or more Vehicles | 35 (29.4%) | 63 (27.6%) |
| Total | 119 (100.0%) | 228 (100.0%) |
Real Estate & Mortgages in Fort Gaines
Real Estate and Mortgage Overview in Fort Gaines
| Characteristic | Without Mortgage | With Mortgage |
| Housing Units | 81 | 38 |
| Median Property Value | $59,500 | $0 |
| Median Household Income | $49,306 | $0 |
| Monthly Housing Costs | $381 | $0 |
| Real Estate Taxes | $760 | $0 |
Property Value by Mortgage Status in Fort Gaines
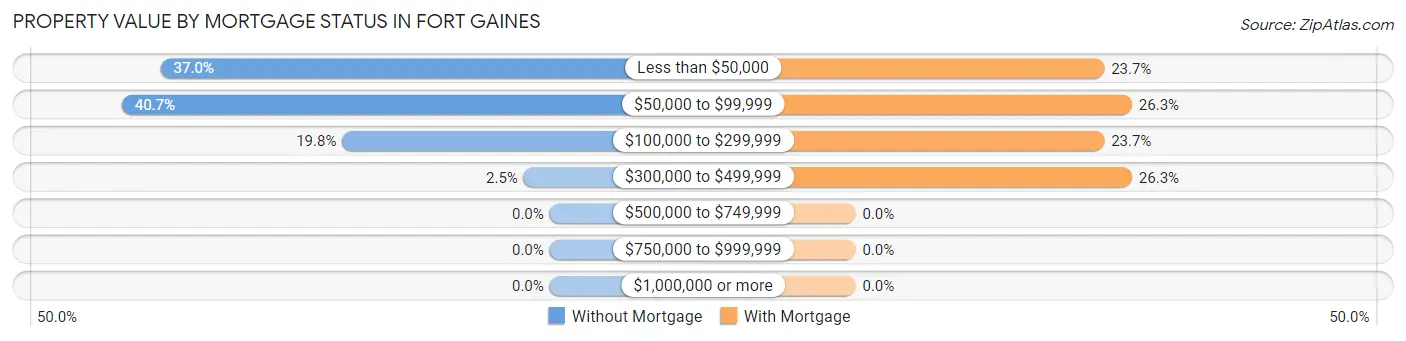
| Property Value | Without Mortgage | With Mortgage |
| Less than $50,000 | 30 (37.0%) | 9 (23.7%) |
| $50,000 to $99,999 | 33 (40.7%) | 10 (26.3%) |
| $100,000 to $299,999 | 16 (19.8%) | 9 (23.7%) |
| $300,000 to $499,999 | 2 (2.5%) | 10 (26.3%) |
| $500,000 to $749,999 | 0 (0.0%) | 0 (0.0%) |
| $750,000 to $999,999 | 0 (0.0%) | 0 (0.0%) |
| $1,000,000 or more | 0 (0.0%) | 0 (0.0%) |
| Total | 81 (100.0%) | 38 (100.0%) |
Household Income by Mortgage Status in Fort Gaines
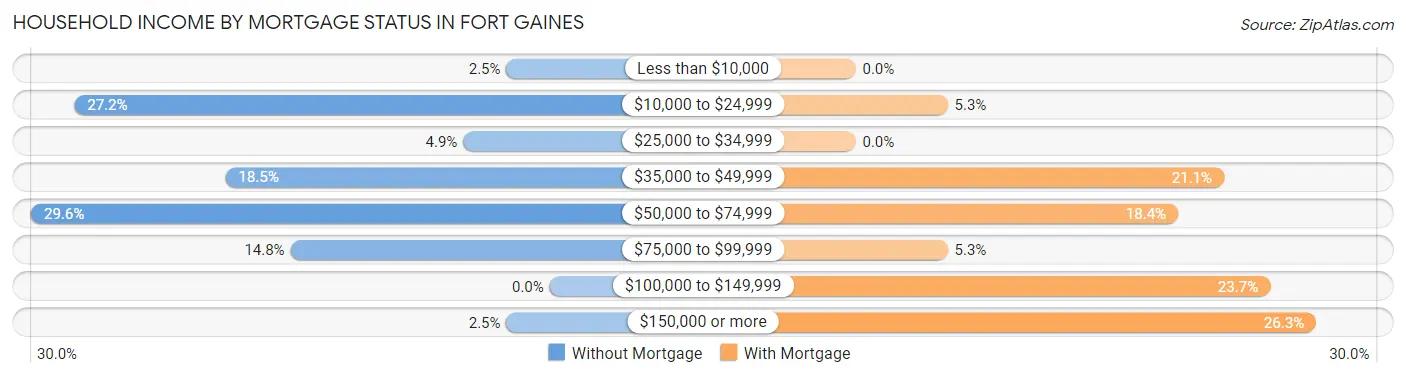
| Household Income | Without Mortgage | With Mortgage |
| Less than $10,000 | 2 (2.5%) | 0 (0.0%) |
| $10,000 to $24,999 | 22 (27.2%) | 2 (5.3%) |
| $25,000 to $34,999 | 4 (4.9%) | 0 (0.0%) |
| $35,000 to $49,999 | 15 (18.5%) | 8 (21.0%) |
| $50,000 to $74,999 | 24 (29.6%) | 7 (18.4%) |
| $75,000 to $99,999 | 12 (14.8%) | 2 (5.3%) |
| $100,000 to $149,999 | 0 (0.0%) | 9 (23.7%) |
| $150,000 or more | 2 (2.5%) | 10 (26.3%) |
| Total | 81 (100.0%) | 38 (100.0%) |
Property Value to Household Income Ratio in Fort Gaines
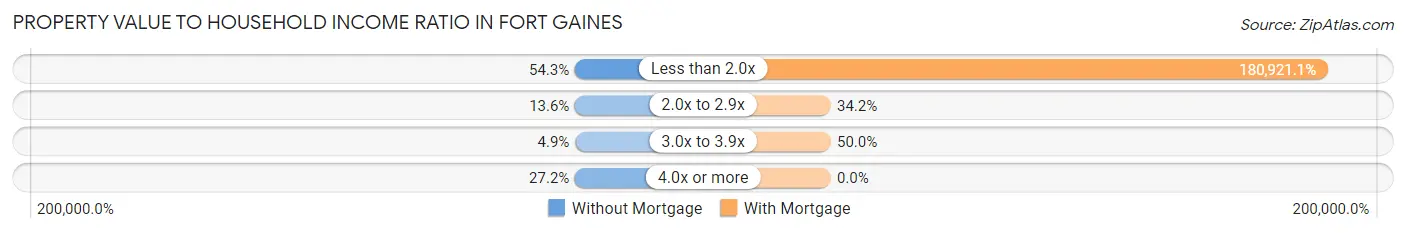
| Value-to-Income Ratio | Without Mortgage | With Mortgage |
| Less than 2.0x | 44 (54.3%) | 68,750 (180,921.0%) |
| 2.0x to 2.9x | 11 (13.6%) | 13 (34.2%) |
| 3.0x to 3.9x | 4 (4.9%) | 19 (50.0%) |
| 4.0x or more | 22 (27.2%) | 0 (0.0%) |
| Total | 81 (100.0%) | 38 (100.0%) |
Real Estate Taxes by Mortgage Status in Fort Gaines
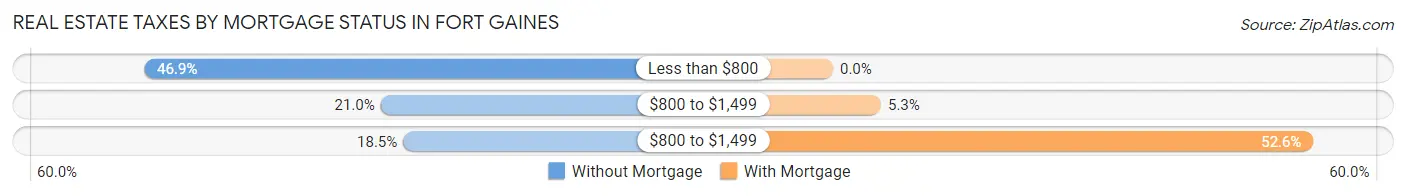
| Property Taxes | Without Mortgage | With Mortgage |
| Less than $800 | 38 (46.9%) | 0 (0.0%) |
| $800 to $1,499 | 17 (21.0%) | 2 (5.3%) |
| $800 to $1,499 | 15 (18.5%) | 20 (52.6%) |
| Total | 81 (100.0%) | 38 (100.0%) |
Health & Disability in Fort Gaines
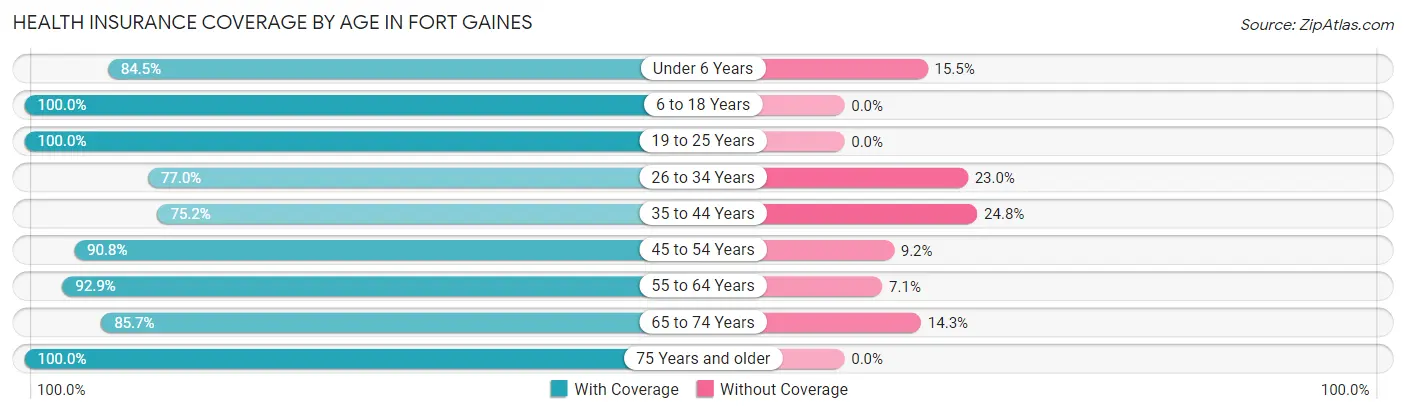
Health Insurance Coverage by Age in Fort Gaines
| Age Bracket | With Coverage | Without Coverage |
| Under 6 Years | 98 (84.5%) | 18 (15.5%) |
| 6 to 18 Years | 290 (100.0%) | 0 (0.0%) |
| 19 to 25 Years | 75 (100.0%) | 0 (0.0%) |
| 26 to 34 Years | 87 (77.0%) | 26 (23.0%) |
| 35 to 44 Years | 85 (75.2%) | 28 (24.8%) |
| 45 to 54 Years | 59 (90.8%) | 6 (9.2%) |
| 55 to 64 Years | 79 (92.9%) | 6 (7.1%) |
| 65 to 74 Years | 42 (85.7%) | 7 (14.3%) |
| 75 Years and older | 72 (100.0%) | 0 (0.0%) |
| Total | 887 (90.7%) | 91 (9.3%) |
Health Insurance Coverage by Citizenship Status in Fort Gaines
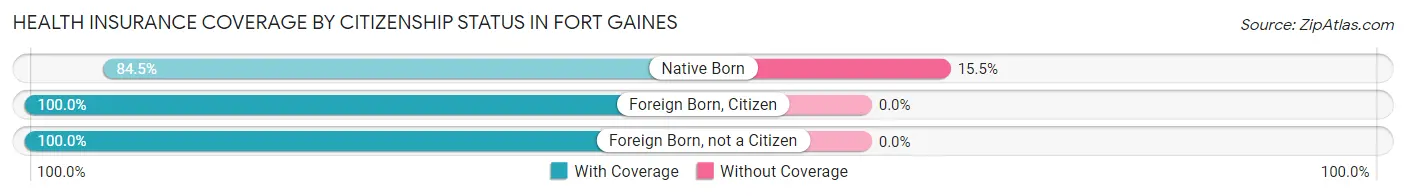
| Citizenship Status | With Coverage | Without Coverage |
| Native Born | 98 (84.5%) | 18 (15.5%) |
| Foreign Born, Citizen | 290 (100.0%) | 0 (0.0%) |
| Foreign Born, not a Citizen | 75 (100.0%) | 0 (0.0%) |
Health Insurance Coverage by Household Income in Fort Gaines
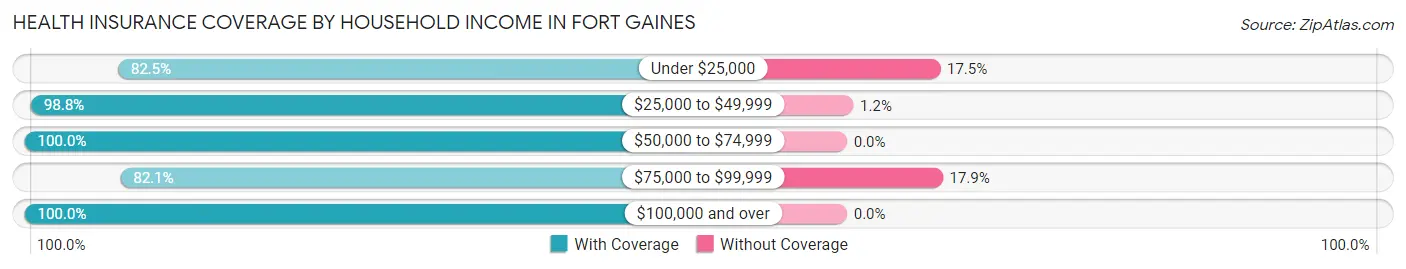
| Household Income | With Coverage | Without Coverage |
| Under $25,000 | 189 (82.5%) | 40 (17.5%) |
| $25,000 to $49,999 | 333 (98.8%) | 4 (1.2%) |
| $50,000 to $74,999 | 122 (100.0%) | 0 (0.0%) |
| $75,000 to $99,999 | 215 (82.1%) | 47 (17.9%) |
| $100,000 and over | 28 (100.0%) | 0 (0.0%) |
Public vs Private Health Insurance Coverage by Age in Fort Gaines
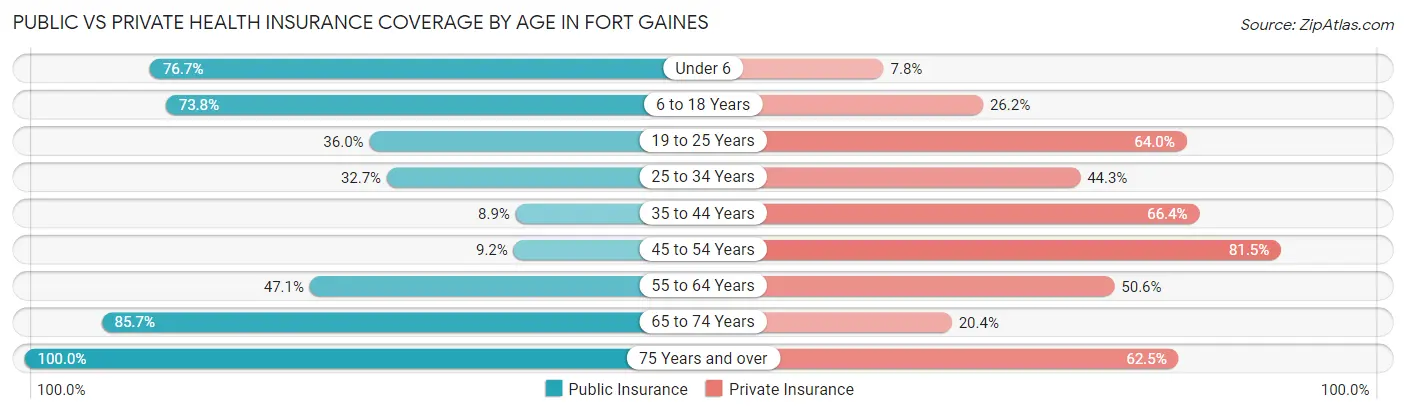
| Age Bracket | Public Insurance | Private Insurance |
| Under 6 | 89 (76.7%) | 9 (7.8%) |
| 6 to 18 Years | 214 (73.8%) | 76 (26.2%) |
| 19 to 25 Years | 27 (36.0%) | 48 (64.0%) |
| 25 to 34 Years | 37 (32.7%) | 50 (44.3%) |
| 35 to 44 Years | 10 (8.8%) | 75 (66.4%) |
| 45 to 54 Years | 6 (9.2%) | 53 (81.5%) |
| 55 to 64 Years | 40 (47.1%) | 43 (50.6%) |
| 65 to 74 Years | 42 (85.7%) | 10 (20.4%) |
| 75 Years and over | 72 (100.0%) | 45 (62.5%) |
| Total | 537 (54.9%) | 409 (41.8%) |
Disability Status by Sex by Age in Fort Gaines
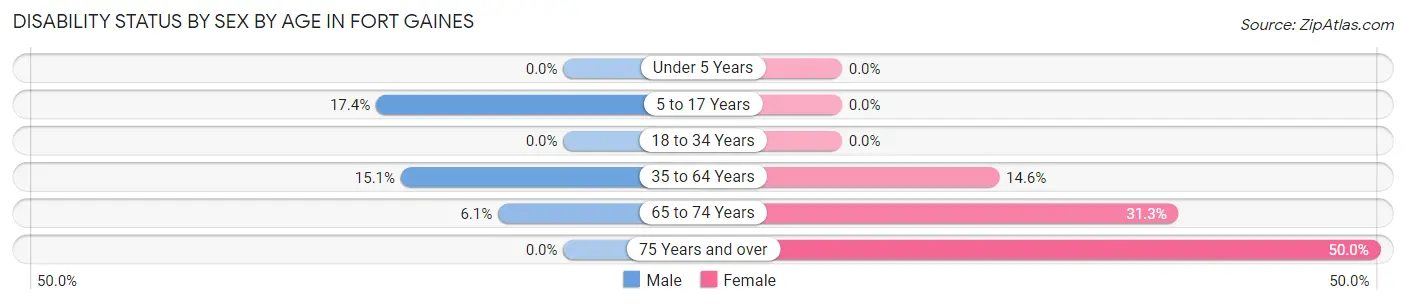
| Age Bracket | Male | Female |
| Under 5 Years | 0 (0.0%) | 0 (0.0%) |
| 5 to 17 Years | 24 (17.4%) | 0 (0.0%) |
| 18 to 34 Years | 0 (0.0%) | 0 (0.0%) |
| 35 to 64 Years | 19 (15.1%) | 20 (14.6%) |
| 65 to 74 Years | 2 (6.1%) | 5 (31.2%) |
| 75 Years and over | 0 (0.0%) | 27 (50.0%) |
Disability Class by Sex by Age in Fort Gaines
Disability Class: Hearing Difficulty
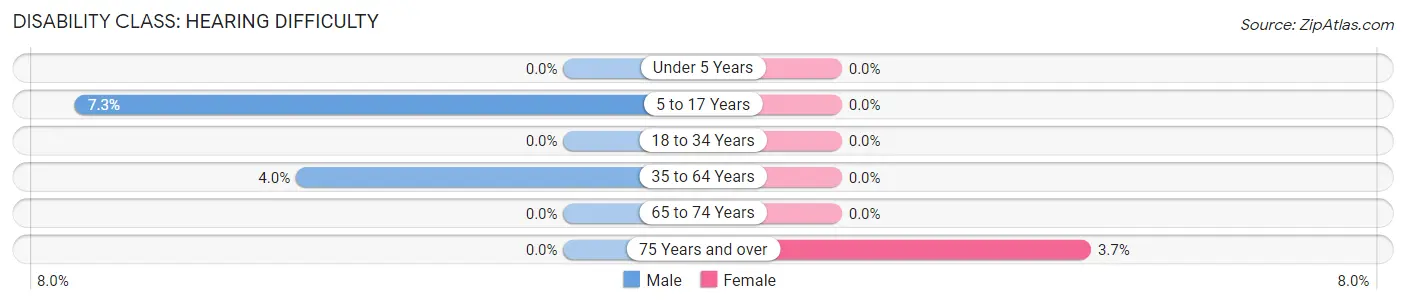
| Age Bracket | Male | Female |
| Under 5 Years | 0 (0.0%) | 0 (0.0%) |
| 5 to 17 Years | 10 (7.2%) | 0 (0.0%) |
| 18 to 34 Years | 0 (0.0%) | 0 (0.0%) |
| 35 to 64 Years | 5 (4.0%) | 0 (0.0%) |
| 65 to 74 Years | 0 (0.0%) | 0 (0.0%) |
| 75 Years and over | 0 (0.0%) | 2 (3.7%) |
Disability Class: Vision Difficulty
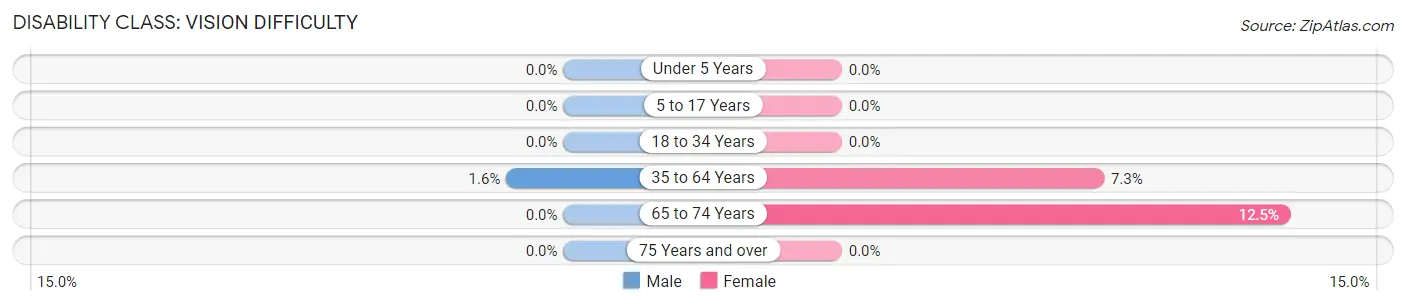
| Age Bracket | Male | Female |
| Under 5 Years | 0 (0.0%) | 0 (0.0%) |
| 5 to 17 Years | 0 (0.0%) | 0 (0.0%) |
| 18 to 34 Years | 0 (0.0%) | 0 (0.0%) |
| 35 to 64 Years | 2 (1.6%) | 10 (7.3%) |
| 65 to 74 Years | 0 (0.0%) | 2 (12.5%) |
| 75 Years and over | 0 (0.0%) | 0 (0.0%) |
Disability Class: Cognitive Difficulty
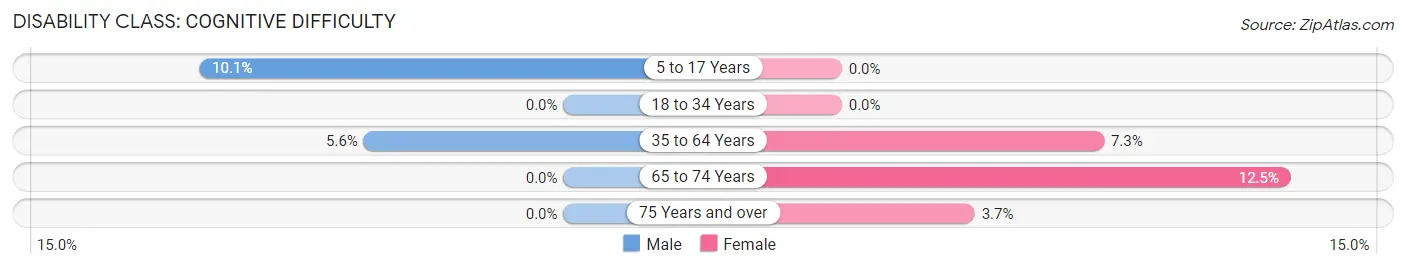
| Age Bracket | Male | Female |
| 5 to 17 Years | 14 (10.1%) | 0 (0.0%) |
| 18 to 34 Years | 0 (0.0%) | 0 (0.0%) |
| 35 to 64 Years | 7 (5.6%) | 10 (7.3%) |
| 65 to 74 Years | 0 (0.0%) | 2 (12.5%) |
| 75 Years and over | 0 (0.0%) | 2 (3.7%) |
Disability Class: Ambulatory Difficulty
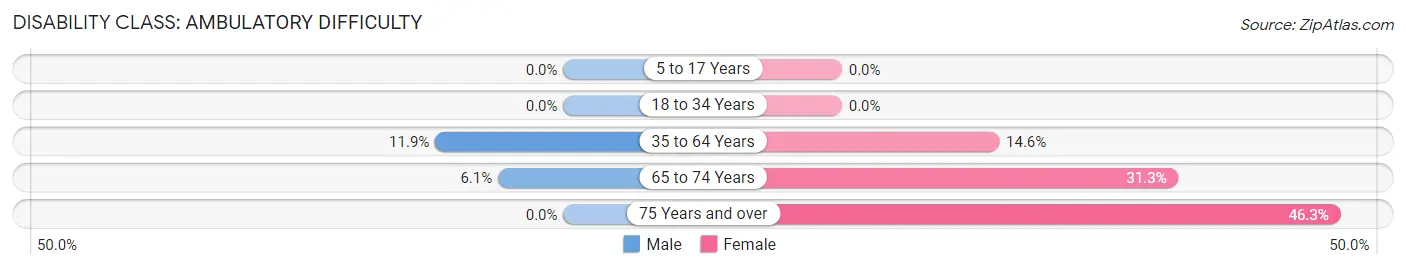
| Age Bracket | Male | Female |
| 5 to 17 Years | 0 (0.0%) | 0 (0.0%) |
| 18 to 34 Years | 0 (0.0%) | 0 (0.0%) |
| 35 to 64 Years | 15 (11.9%) | 20 (14.6%) |
| 65 to 74 Years | 2 (6.1%) | 5 (31.2%) |
| 75 Years and over | 0 (0.0%) | 25 (46.3%) |
Disability Class: Self-Care Difficulty
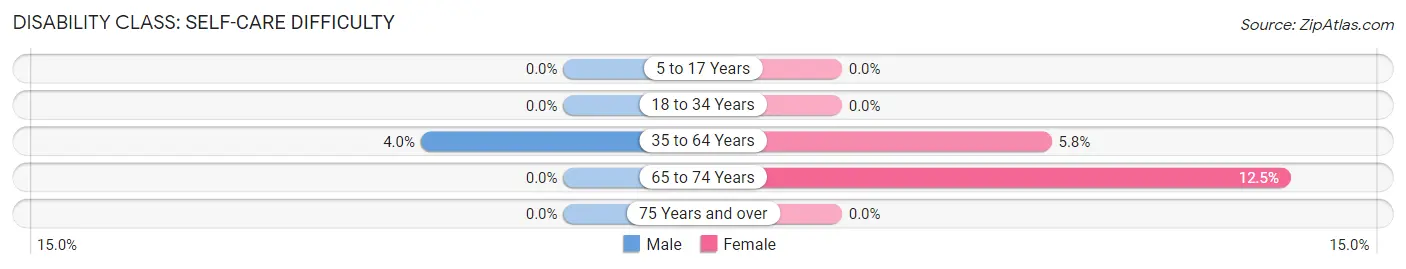
| Age Bracket | Male | Female |
| 5 to 17 Years | 0 (0.0%) | 0 (0.0%) |
| 18 to 34 Years | 0 (0.0%) | 0 (0.0%) |
| 35 to 64 Years | 5 (4.0%) | 8 (5.8%) |
| 65 to 74 Years | 0 (0.0%) | 2 (12.5%) |
| 75 Years and over | 0 (0.0%) | 0 (0.0%) |
Technology Access in Fort Gaines
Computing Device Access in Fort Gaines
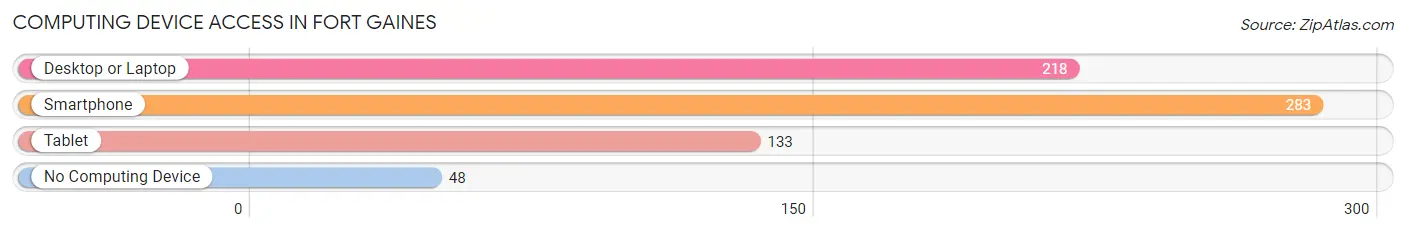
| Device Type | # Households | % Households |
| Desktop or Laptop | 218 | 62.8% |
| Smartphone | 283 | 81.6% |
| Tablet | 133 | 38.3% |
| No Computing Device | 48 | 13.8% |
| Total | 347 | 100.0% |
Internet Access in Fort Gaines
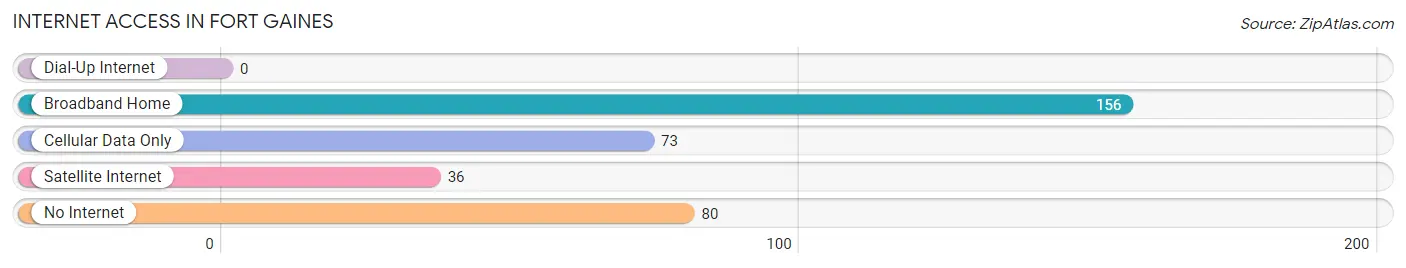
| Internet Type | # Households | % Households |
| Dial-Up Internet | 0 | 0.0% |
| Broadband Home | 156 | 45.0% |
| Cellular Data Only | 73 | 21.0% |
| Satellite Internet | 36 | 10.4% |
| No Internet | 80 | 23.1% |
| Total | 347 | 100.0% |
Fort Gaines Summary
History
Fort Gaines, Georgia is a small town located in Clay County, Georgia. It was founded in 1832 and named after General Edmund Pendleton Gaines, a hero of the War of 1812. The town was originally a trading post and was the site of a Civil War battle in 1864. The Battle of Fort Gaines was fought between Union and Confederate forces and resulted in a Confederate victory.
The town was incorporated in 1887 and has since grown to a population of approximately 1,000 people. The town is home to a variety of businesses, including a grocery store, a hardware store, a pharmacy, and a bank.
Geography
Fort Gaines is located in Clay County, Georgia, approximately 50 miles south of Atlanta. The town is situated on the banks of the Chattahoochee River and is surrounded by rolling hills and forests. The town is located in the foothills of the Appalachian Mountains and is part of the Appalachian Plateau.
The climate in Fort Gaines is humid subtropical, with hot summers and mild winters. The average annual temperature is around 70 degrees Fahrenheit. The town receives an average of 48 inches of rain per year.
Economy
The economy of Fort Gaines is largely based on agriculture and tourism. The town is home to several farms, which produce a variety of crops, including corn, soybeans, and cotton. The town is also home to several tourist attractions, including the Fort Gaines Historic Site, which is a Civil War fort, and the Chattahoochee River National Recreation Area, which offers a variety of outdoor activities.
The town is also home to several small businesses, including a grocery store, a hardware store, a pharmacy, and a bank. The town is also home to a number of restaurants, including a pizza parlor, a Mexican restaurant, and a steakhouse.
Demographics
As of the 2010 census, the population of Fort Gaines was 1,000 people. The racial makeup of the town was 95.2% White, 2.2% African American, 0.7% Native American, 0.3% Asian, and 1.6% from other races. The median household income was $35,000, and the median age was 39 years.
Conclusion
Fort Gaines, Georgia is a small town located in Clay County, Georgia. It was founded in 1832 and named after General Edmund Pendleton Gaines, a hero of the War of 1812. The town is situated on the banks of the Chattahoochee River and is surrounded by rolling hills and forests. The economy of Fort Gaines is largely based on agriculture and tourism, and the town is home to several small businesses, including a grocery store, a hardware store, a pharmacy, and a bank. As of the 2010 census, the population of Fort Gaines was 1,000 people.
Common Questions
What is Per Capita Income in Fort Gaines?
Per Capita income in Fort Gaines is $16,608.
What is the Median Family Income in Fort Gaines?
Median Family Income in Fort Gaines is $53,000.
What is the Median Household income in Fort Gaines?
Median Household Income in Fort Gaines is $36,161.
What is Income or Wage Gap in Fort Gaines?
Income or Wage Gap in Fort Gaines is 8.1%.
Women in Fort Gaines earn 91.9 cents for every dollar earned by a man.
What is Inequality or Gini Index in Fort Gaines?
Inequality or Gini Index in Fort Gaines is 0.43.
What is the Total Population of Fort Gaines?
Total Population of Fort Gaines is 1,035.
What is the Total Male Population of Fort Gaines?
Total Male Population of Fort Gaines is 472.
What is the Total Female Population of Fort Gaines?
Total Female Population of Fort Gaines is 563.
What is the Ratio of Males per 100 Females in Fort Gaines?
There are 83.84 Males per 100 Females in Fort Gaines.
What is the Ratio of Females per 100 Males in Fort Gaines?
There are 119.28 Females per 100 Males in Fort Gaines.
What is the Median Population Age in Fort Gaines?
Median Population Age in Fort Gaines is 31.4 Years.
What is the Average Family Size in Fort Gaines
Average Family Size in Fort Gaines is 4.1 People.
What is the Average Household Size in Fort Gaines
Average Household Size in Fort Gaines is 2.8 People.
How Large is the Labor Force in Fort Gaines?
There are 381 People in the Labor Forcein in Fort Gaines.
What is the Percentage of People in the Labor Force in Fort Gaines?
54.2% of People are in the Labor Force in Fort Gaines.
What is the Unemployment Rate in Fort Gaines?
Unemployment Rate in Fort Gaines is 9.2%.