Waynesboro, GA Map & Demographics
Waynesboro Map
Waynesboro Overview
$18,132
PER CAPITA INCOME
$42,661
AVG FAMILY INCOME
$41,932
AVG HOUSEHOLD INCOME
31.2%
WAGE / INCOME GAP [ % ]
68.8¢/ $1
WAGE / INCOME GAP [ $ ]
0.44
INEQUALITY / GINI INDEX
5,720
TOTAL POPULATION
2,614
MALE POPULATION
3,106
FEMALE POPULATION
84.16
MALES / 100 FEMALES
118.82
FEMALES / 100 MALES
30.0
MEDIAN AGE
3.6
AVG FAMILY SIZE
2.8
AVG HOUSEHOLD SIZE
2,682
LABOR FORCE [ PEOPLE ]
65.5%
PERCENT IN LABOR FORCE
4.8%
UNEMPLOYMENT RATE
Waynesboro Zip Codes
Income in Waynesboro
Income Overview in Waynesboro
Per Capita Income in Waynesboro is $18,132, while median incomes of families and households are $42,661 and $41,932 respectively.
| Characteristic | Number | Measure |
| Per Capita Income | 5,720 | $18,132 |
| Median Family Income | 1,372 | $42,661 |
| Mean Family Income | 1,372 | $51,313 |
| Median Household Income | 2,027 | $41,932 |
| Mean Household Income | 2,027 | $46,983 |
| Income Deficit | 1,372 | $0 |
| Wage / Income Gap (%) | 5,720 | 31.16% |
| Wage / Income Gap ($) | 5,720 | 68.84¢ per $1 |
| Gini / Inequality Index | 5,720 | 0.44 |
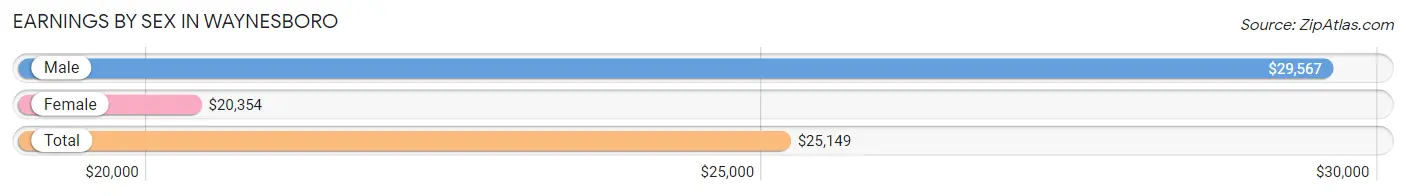
Earnings by Sex in Waynesboro
Average Earnings in Waynesboro are $25,149, $29,567 for men and $20,354 for women, a difference of 31.2%.
| Sex | Number | Average Earnings |
| Male | 1,071 (39.8%) | $29,567 |
| Female | 1,621 (60.2%) | $20,354 |
| Total | 2,692 (100.0%) | $25,149 |
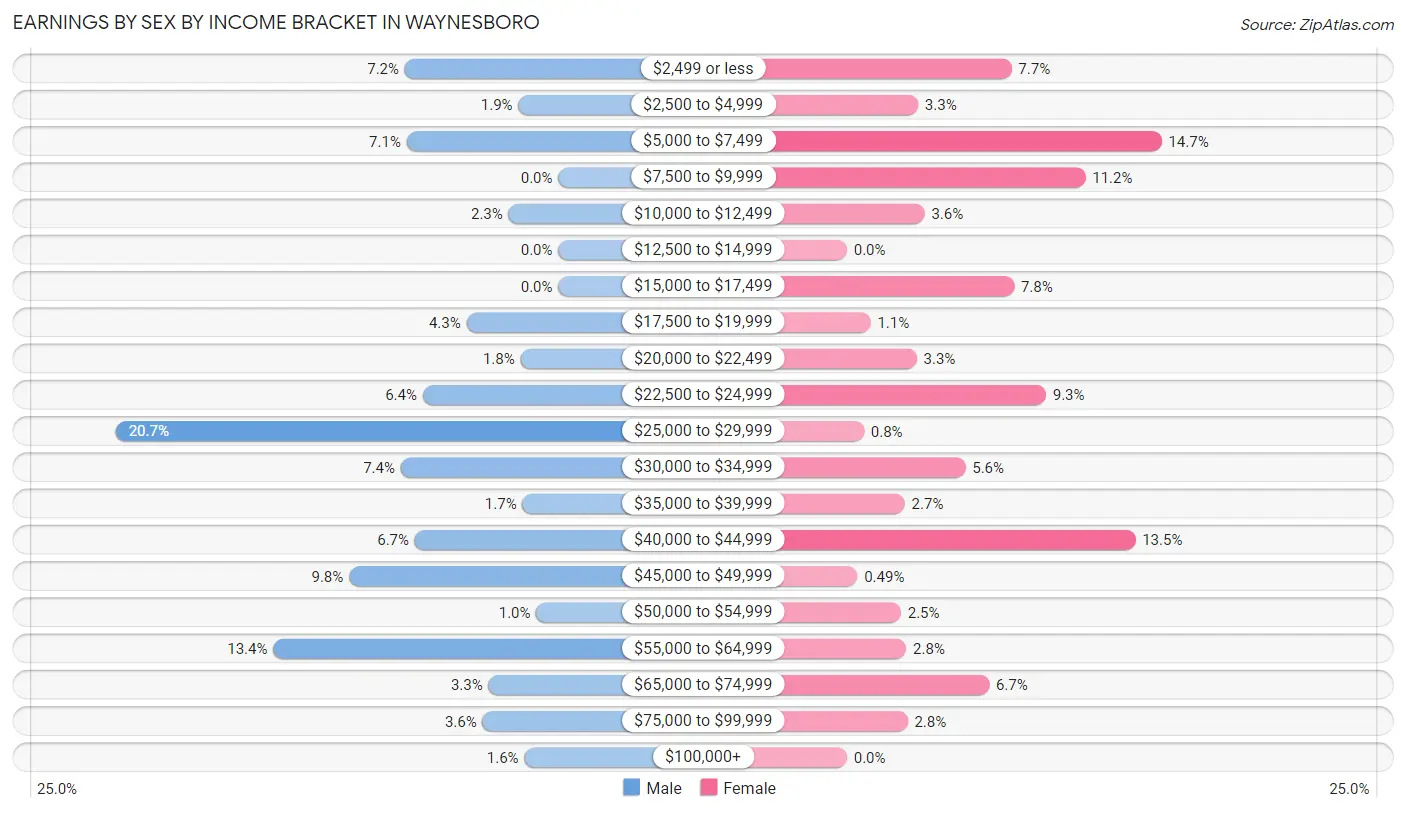
Earnings by Sex by Income Bracket in Waynesboro
The most common earnings brackets in Waynesboro are $25,000 to $29,999 for men (222 | 20.7%) and $5,000 to $7,499 for women (239 | 14.7%).
| Income | Male | Female |
| $2,499 or less | 77 (7.2%) | 125 (7.7%) |
| $2,500 to $4,999 | 20 (1.9%) | 54 (3.3%) |
| $5,000 to $7,499 | 76 (7.1%) | 239 (14.7%) |
| $7,500 to $9,999 | 0 (0.0%) | 181 (11.2%) |
| $10,000 to $12,499 | 25 (2.3%) | 59 (3.6%) |
| $12,500 to $14,999 | 0 (0.0%) | 0 (0.0%) |
| $15,000 to $17,499 | 0 (0.0%) | 127 (7.8%) |
| $17,500 to $19,999 | 46 (4.3%) | 18 (1.1%) |
| $20,000 to $22,499 | 19 (1.8%) | 53 (3.3%) |
| $22,500 to $24,999 | 68 (6.4%) | 151 (9.3%) |
| $25,000 to $29,999 | 222 (20.7%) | 13 (0.8%) |
| $30,000 to $34,999 | 79 (7.4%) | 90 (5.6%) |
| $35,000 to $39,999 | 18 (1.7%) | 44 (2.7%) |
| $40,000 to $44,999 | 72 (6.7%) | 219 (13.5%) |
| $45,000 to $49,999 | 105 (9.8%) | 8 (0.5%) |
| $50,000 to $54,999 | 11 (1.0%) | 41 (2.5%) |
| $55,000 to $64,999 | 143 (13.4%) | 45 (2.8%) |
| $65,000 to $74,999 | 35 (3.3%) | 108 (6.7%) |
| $75,000 to $99,999 | 38 (3.5%) | 46 (2.8%) |
| $100,000+ | 17 (1.6%) | 0 (0.0%) |
| Total | 1,071 (100.0%) | 1,621 (100.0%) |
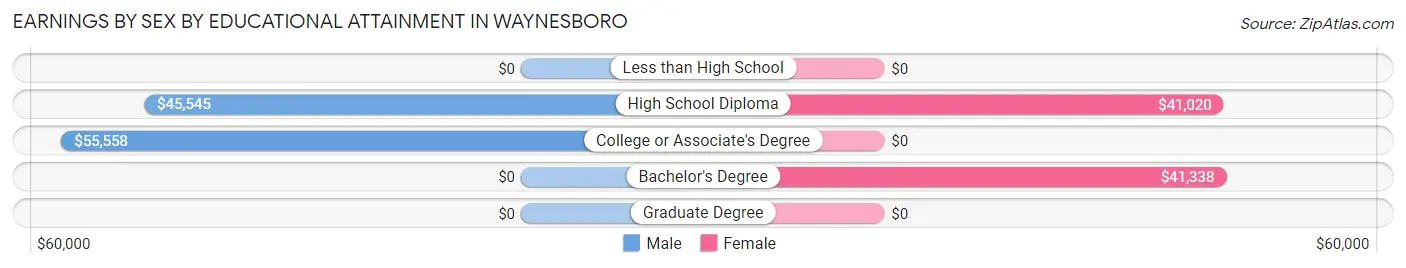
Earnings by Sex by Educational Attainment in Waynesboro
Average earnings in Waynesboro are $42,364 for men and $23,998 for women, a difference of 43.3%. Men with an educational attainment of college or associate's degree enjoy the highest average annual earnings of $55,558, while those with high school diploma education earn the least with $45,545. Women with an educational attainment of bachelor's degree earn the most with the average annual earnings of $41,338, while those with high school diploma education have the smallest earnings of $41,020.
| Educational Attainment | Male Income | Female Income |
| Less than High School | - | - |
| High School Diploma | $45,545 | $41,020 |
| College or Associate's Degree | $55,558 | $0 |
| Bachelor's Degree | - | - |
| Graduate Degree | - | - |
| Total | $42,364 | $23,998 |
Family Income in Waynesboro
Family Income Brackets in Waynesboro
According to the Waynesboro family income data, there are 240 families falling into the $100,000 to $149,999 income range, which is the most common income bracket and makes up 17.5% of all families.
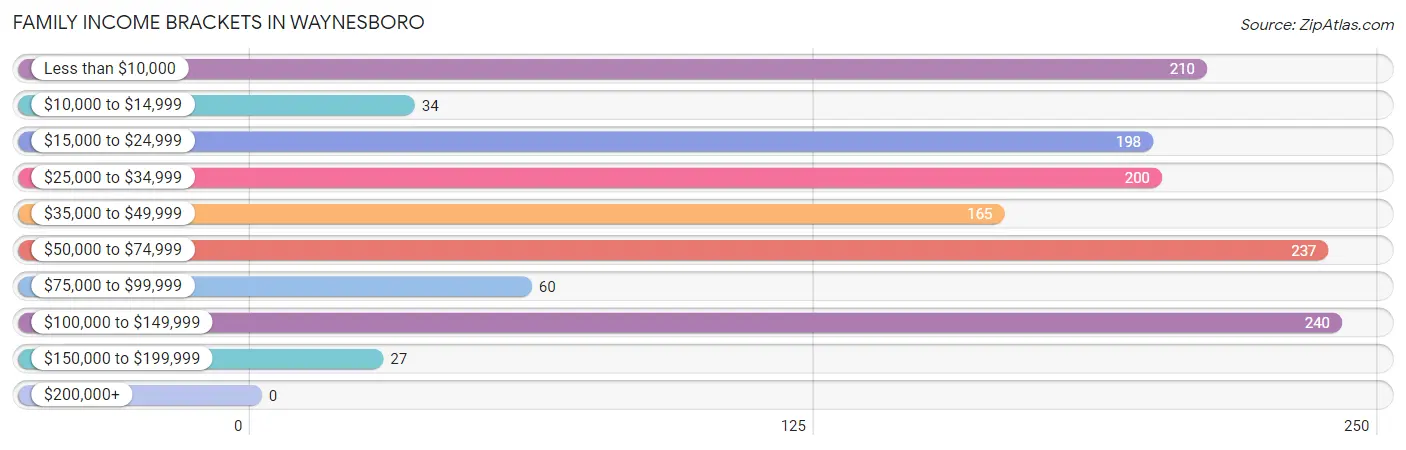
| Income Bracket | # Families | % Families |
| Less than $10,000 | 210 | 15.3% |
| $10,000 to $14,999 | 34 | 2.5% |
| $15,000 to $24,999 | 198 | 14.4% |
| $25,000 to $34,999 | 200 | 14.6% |
| $35,000 to $49,999 | 165 | 12.0% |
| $50,000 to $74,999 | 237 | 17.3% |
| $75,000 to $99,999 | 60 | 4.4% |
| $100,000 to $149,999 | 240 | 17.5% |
| $150,000 to $199,999 | 27 | 2.0% |
| $200,000+ | 0 | 0.0% |
Family Income by Famaliy Size in Waynesboro
4-person families (274 | 20.0%) account for the highest median family income in Waynesboro with $53,103 per family, while 2-person families (482 | 35.1%) have the highest median income of $21,532 per family member.
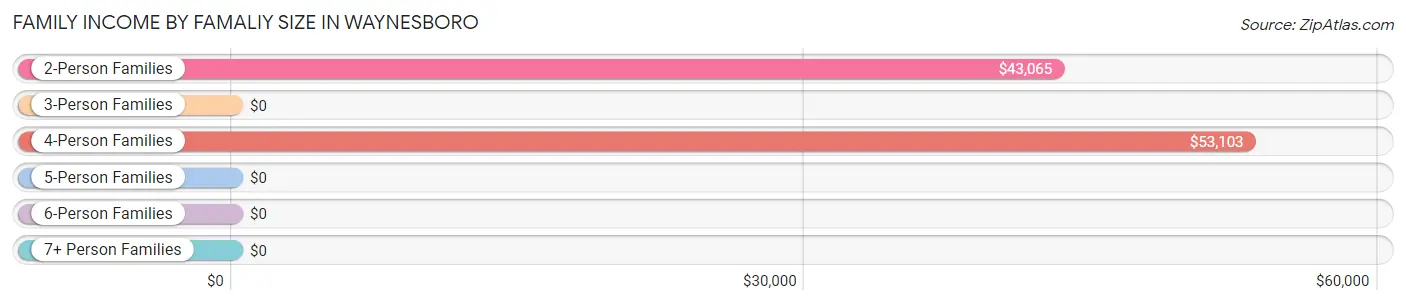
| Income Bracket | # Families | Median Income |
| 2-Person Families | 482 (35.1%) | $43,065 |
| 3-Person Families | 465 (33.9%) | $0 |
| 4-Person Families | 274 (20.0%) | $53,103 |
| 5-Person Families | 90 (6.6%) | $0 |
| 6-Person Families | 61 (4.4%) | $0 |
| 7+ Person Families | 0 (0.0%) | $0 |
| Total | 1,372 (100.0%) | $42,661 |
Family Income by Number of Earners in Waynesboro
The median family income in Waynesboro is $42,661, with families comprising 3+ earners (210) having the highest median family income of $120,400, while families with 1 earner (545) have the lowest median family income of $17,414, accounting for 15.3% and 39.7% of families, respectively.
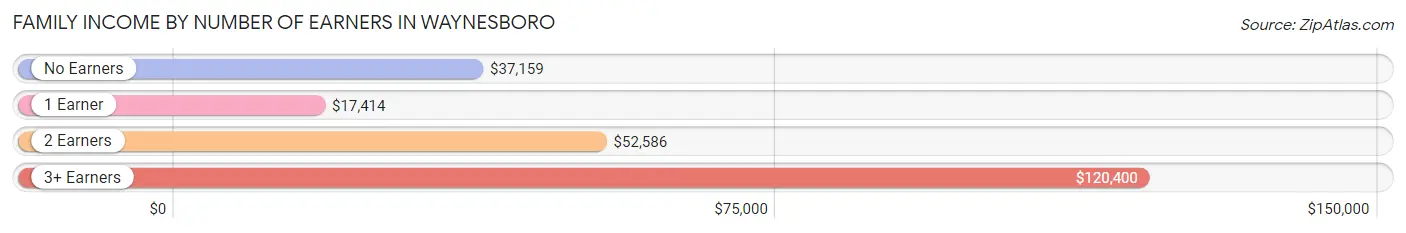
| Number of Earners | # Families | Median Income |
| No Earners | 175 (12.8%) | $37,159 |
| 1 Earner | 545 (39.7%) | $17,414 |
| 2 Earners | 442 (32.2%) | $52,586 |
| 3+ Earners | 210 (15.3%) | $120,400 |
| Total | 1,372 (100.0%) | $42,661 |
Household Income in Waynesboro
Household Income Brackets in Waynesboro
With 373 households falling in the category, the $50,000 to $74,999 income range is the most frequent in Waynesboro, accounting for 18.4% of all households.
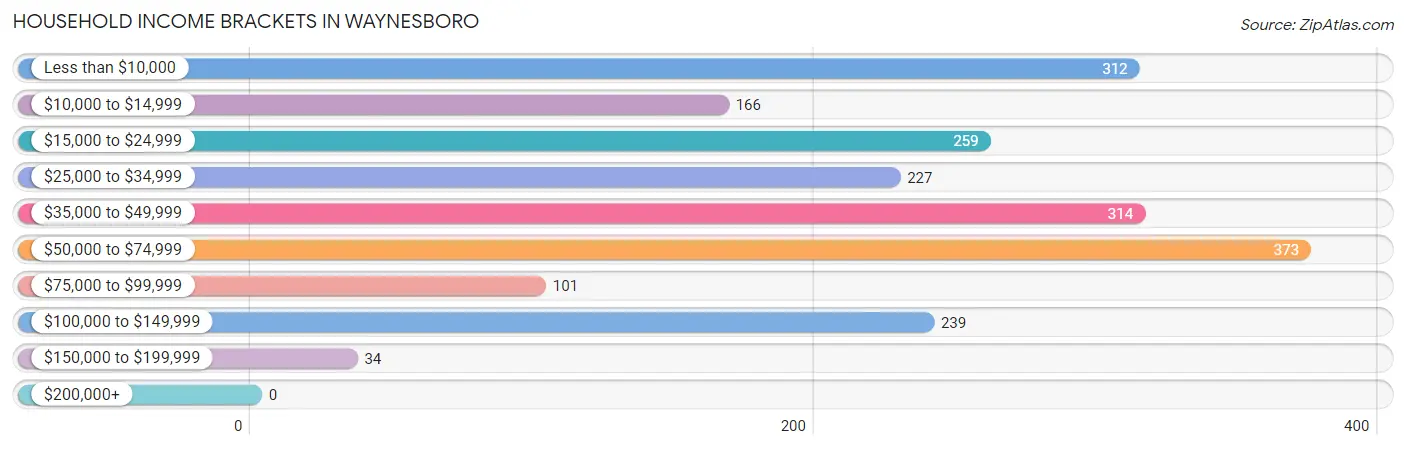
| Income Bracket | # Households | % Households |
| Less than $10,000 | 312 | 15.4% |
| $10,000 to $14,999 | 166 | 8.2% |
| $15,000 to $24,999 | 259 | 12.8% |
| $25,000 to $34,999 | 227 | 11.2% |
| $35,000 to $49,999 | 314 | 15.5% |
| $50,000 to $74,999 | 373 | 18.4% |
| $75,000 to $99,999 | 101 | 5.0% |
| $100,000 to $149,999 | 239 | 11.8% |
| $150,000 to $199,999 | 34 | 1.7% |
| $200,000+ | 0 | 0.0% |
Household Income by Householder Age in Waynesboro
The median household income in Waynesboro is $41,932, with the highest median household income of $49,353 found in the 65+ years age bracket for the primary householder. A total of 503 households (24.8%) fall into this category. Meanwhile, the 15 to 24 years age bracket for the primary householder has the lowest median household income of $0, with 25 households (1.2%) in this group.
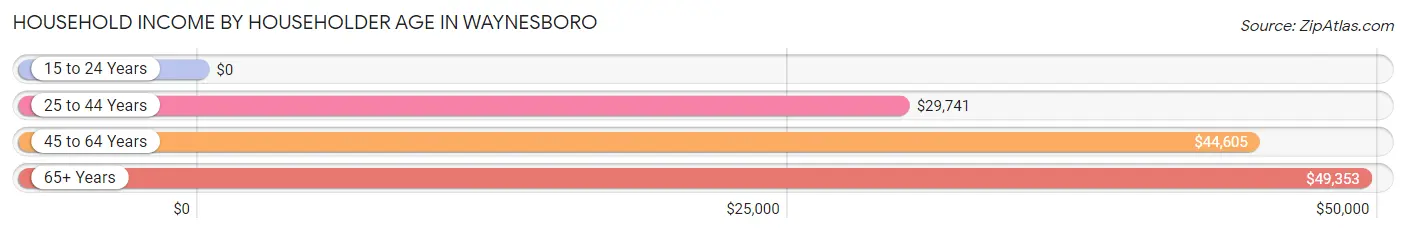
| Income Bracket | # Households | Median Income |
| 15 to 24 Years | 25 (1.2%) | $0 |
| 25 to 44 Years | 815 (40.2%) | $29,741 |
| 45 to 64 Years | 684 (33.7%) | $44,605 |
| 65+ Years | 503 (24.8%) | $49,353 |
| Total | 2,027 (100.0%) | $41,932 |
Poverty in Waynesboro
Income Below Poverty by Sex and Age in Waynesboro
With 37.9% poverty level for males and 27.1% for females among the residents of Waynesboro, 6 to 11 year old males and 15 year old females are the most vulnerable to poverty, with 285 males (86.9%) and 17 females (100.0%) in their respective age groups living below the poverty level.
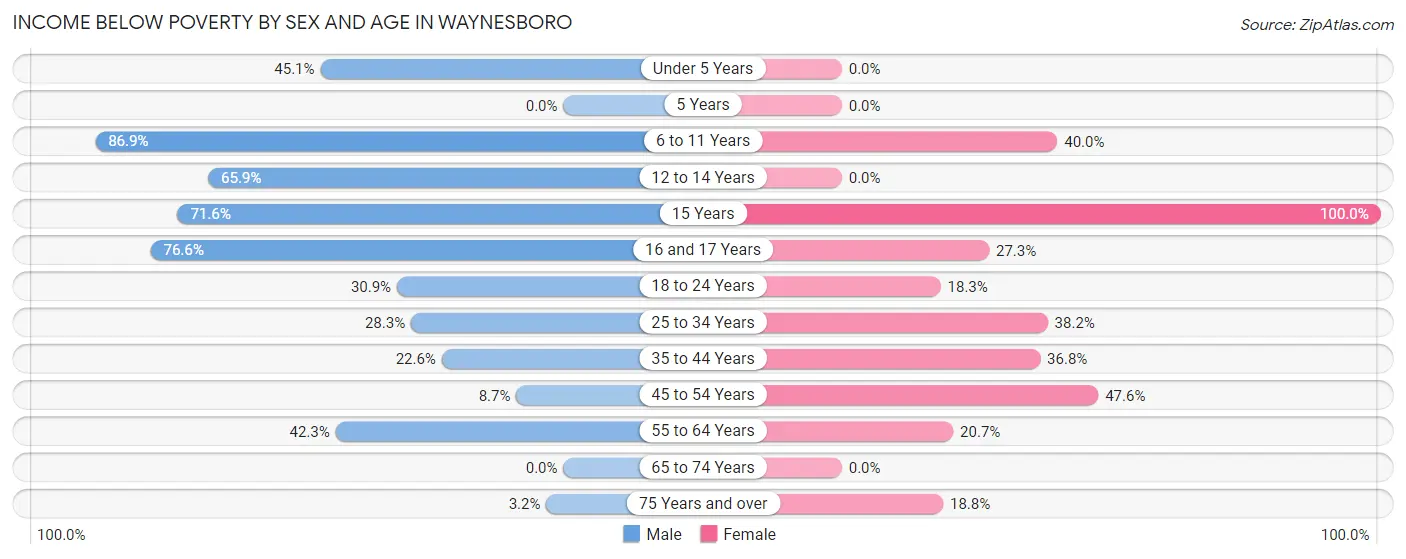
| Age Bracket | Male | Female |
| Under 5 Years | 198 (45.1%) | 0 (0.0%) |
| 5 Years | 0 (0.0%) | 0 (0.0%) |
| 6 to 11 Years | 285 (86.9%) | 124 (40.0%) |
| 12 to 14 Years | 60 (65.9%) | 0 (0.0%) |
| 15 Years | 53 (71.6%) | 17 (100.0%) |
| 16 and 17 Years | 59 (76.6%) | 47 (27.3%) |
| 18 to 24 Years | 152 (30.9%) | 53 (18.3%) |
| 25 to 34 Years | 28 (28.3%) | 107 (38.2%) |
| 35 to 44 Years | 63 (22.6%) | 243 (36.8%) |
| 45 to 54 Years | 20 (8.7%) | 129 (47.6%) |
| 55 to 64 Years | 63 (42.3%) | 74 (20.7%) |
| 65 to 74 Years | 0 (0.0%) | 0 (0.0%) |
| 75 Years and over | 3 (3.2%) | 31 (18.8%) |
| Total | 984 (37.9%) | 825 (27.1%) |
Income Above Poverty by Sex and Age in Waynesboro
According to the poverty statistics in Waynesboro, males aged 5 years and females aged under 5 years are the age groups that are most secure financially, with 100.0% of males and 100.0% of females in these age groups living above the poverty line.
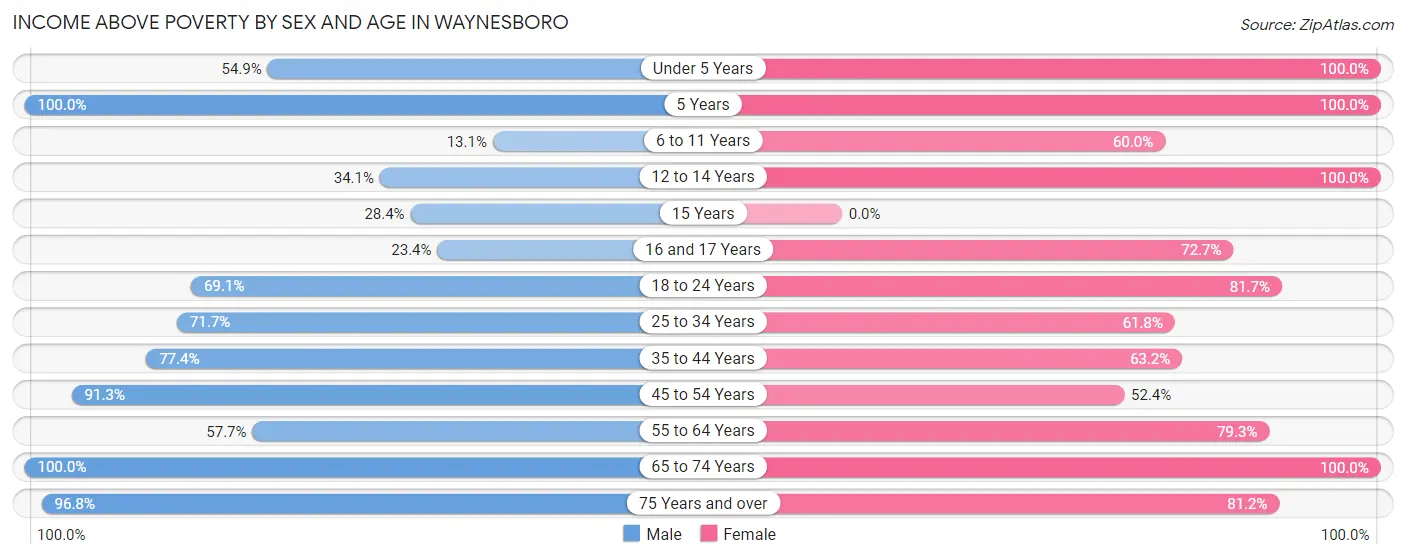
| Age Bracket | Male | Female |
| Under 5 Years | 241 (54.9%) | 63 (100.0%) |
| 5 Years | 70 (100.0%) | 70 (100.0%) |
| 6 to 11 Years | 43 (13.1%) | 186 (60.0%) |
| 12 to 14 Years | 31 (34.1%) | 164 (100.0%) |
| 15 Years | 21 (28.4%) | 0 (0.0%) |
| 16 and 17 Years | 18 (23.4%) | 125 (72.7%) |
| 18 to 24 Years | 340 (69.1%) | 236 (81.7%) |
| 25 to 34 Years | 71 (71.7%) | 173 (61.8%) |
| 35 to 44 Years | 216 (77.4%) | 417 (63.2%) |
| 45 to 54 Years | 209 (91.3%) | 142 (52.4%) |
| 55 to 64 Years | 86 (57.7%) | 284 (79.3%) |
| 65 to 74 Years | 172 (100.0%) | 221 (100.0%) |
| 75 Years and over | 92 (96.8%) | 134 (81.2%) |
| Total | 1,610 (62.1%) | 2,215 (72.9%) |
Income Below Poverty Among Married-Couple Families in Waynesboro
The poverty statistics for married-couple families in Waynesboro show that 9.1% or 61 of the total 672 families live below the poverty line. Families with 1 or 2 children have the highest poverty rate of 18.0%, comprising of 61 families. On the other hand, families with no children have the lowest poverty rate of 0.0%, which includes 0 families.
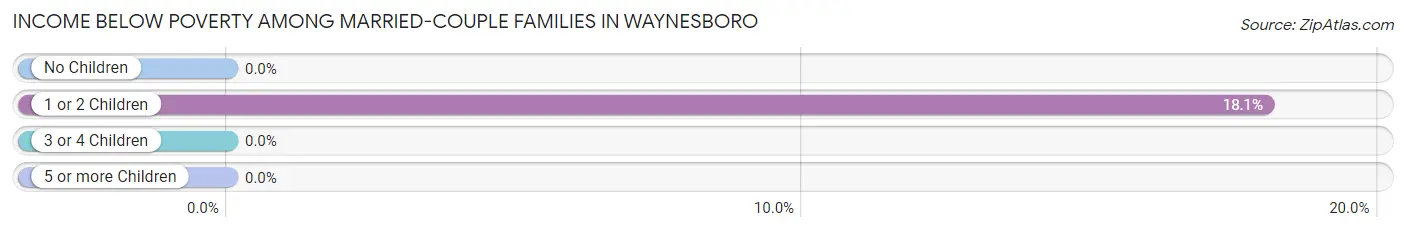
| Children | Above Poverty | Below Poverty |
| No Children | 313 (100.0%) | 0 (0.0%) |
| 1 or 2 Children | 277 (82.0%) | 61 (18.0%) |
| 3 or 4 Children | 21 (100.0%) | 0 (0.0%) |
| 5 or more Children | 0 (0.0%) | 0 (0.0%) |
| Total | 611 (90.9%) | 61 (9.1%) |
Income Below Poverty Among Single-Parent Households in Waynesboro
According to the poverty data in Waynesboro, 75.6% or 34 single-father households and 51.9% or 340 single-mother households are living below the poverty line. Among single-father households, those with 3 or 4 children have the highest poverty rate, with 28 households (100.0%) experiencing poverty. Likewise, among single-mother households, those with 5 or more children have the highest poverty rate, with 40 households (100.0%) falling below the poverty line.
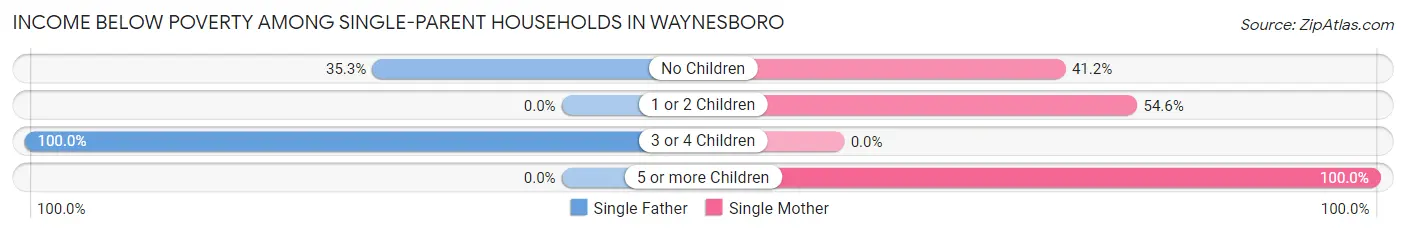
| Children | Single Father | Single Mother |
| No Children | 6 (35.3%) | 54 (41.2%) |
| 1 or 2 Children | 0 (0.0%) | 246 (54.5%) |
| 3 or 4 Children | 28 (100.0%) | 0 (0.0%) |
| 5 or more Children | 0 (0.0%) | 40 (100.0%) |
| Total | 34 (75.6%) | 340 (51.9%) |
Income Below Poverty Among Married-Couple vs Single-Parent Households in Waynesboro
The poverty data for Waynesboro shows that 61 of the married-couple family households (9.1%) and 374 of the single-parent households (53.4%) are living below the poverty level. Within the married-couple family households, those with 1 or 2 children have the highest poverty rate, with 61 households (18.0%) falling below the poverty line. Among the single-parent households, those with 5 or more children have the highest poverty rate, with 40 household (100.0%) living below poverty.
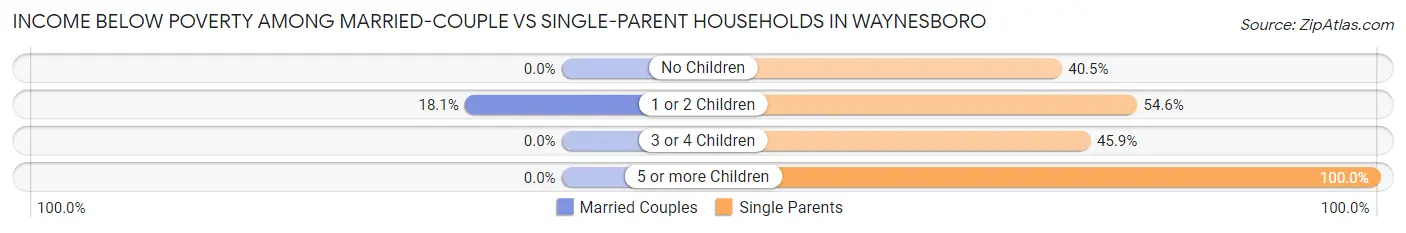
| Children | Married-Couple Families | Single-Parent Households |
| No Children | 0 (0.0%) | 60 (40.5%) |
| 1 or 2 Children | 61 (18.0%) | 246 (54.5%) |
| 3 or 4 Children | 0 (0.0%) | 28 (45.9%) |
| 5 or more Children | 0 (0.0%) | 40 (100.0%) |
| Total | 61 (9.1%) | 374 (53.4%) |
Race in Waynesboro
The most populous races in Waynesboro are Black / African American (3,969 | 69.4%), White / Caucasian (1,449 | 25.3%), and Two or more Races (288 | 5.0%).
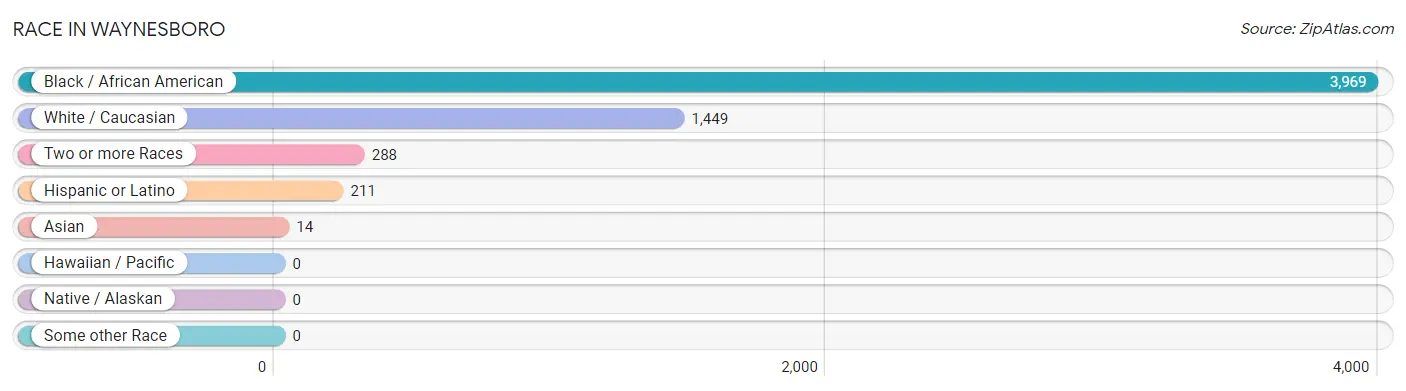
| Race | # Population | % Population |
| Asian | 14 | 0.2% |
| Black / African American | 3,969 | 69.4% |
| Hawaiian / Pacific | 0 | 0.0% |
| Hispanic or Latino | 211 | 3.7% |
| Native / Alaskan | 0 | 0.0% |
| White / Caucasian | 1,449 | 25.3% |
| Two or more Races | 288 | 5.0% |
| Some other Race | 0 | 0.0% |
| Total | 5,720 | 100.0% |
Ancestry in Waynesboro
The most populous ancestries reported in Waynesboro are Irish (265 | 4.6%), German (164 | 2.9%), Puerto Rican (107 | 1.9%), Mexican (104 | 1.8%), and American (102 | 1.8%), together accounting for 13.0% of all Waynesboro residents.
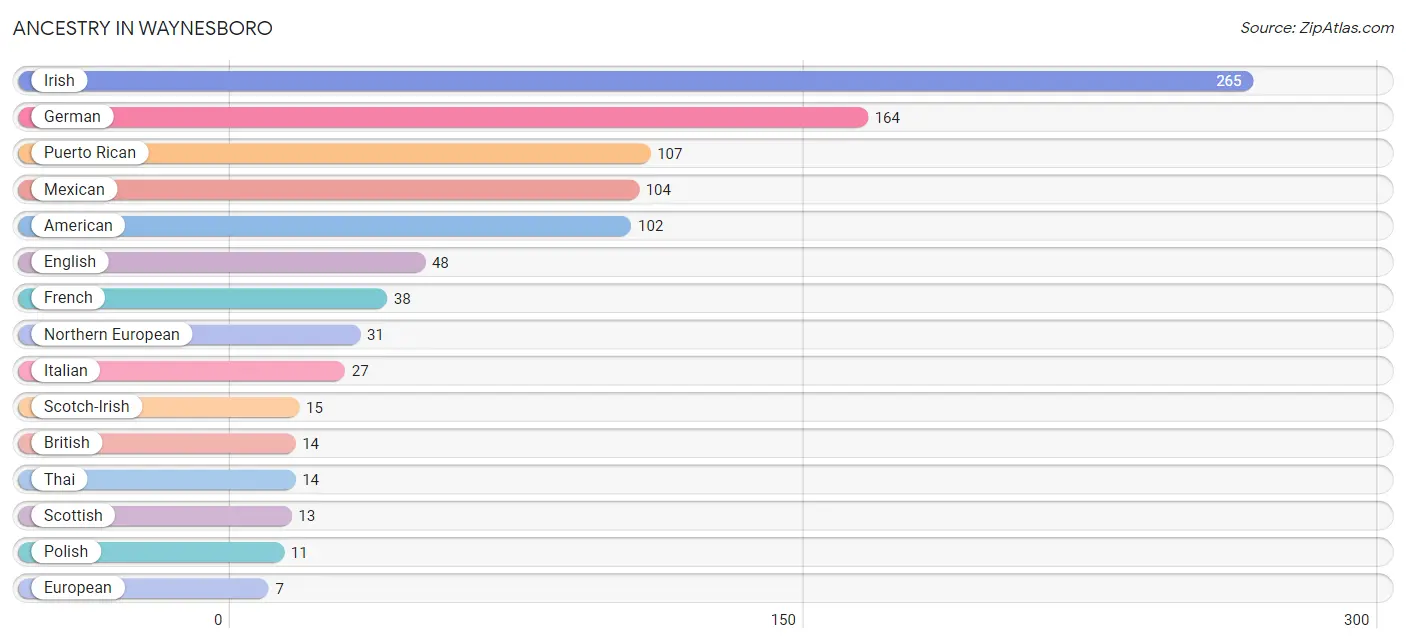
| Ancestry | # Population | % Population |
| American | 102 | 1.8% |
| British | 14 | 0.2% |
| English | 48 | 0.8% |
| European | 7 | 0.1% |
| French | 38 | 0.7% |
| German | 164 | 2.9% |
| Irish | 265 | 4.6% |
| Italian | 27 | 0.5% |
| Mexican | 104 | 1.8% |
| Northern European | 31 | 0.5% |
| Polish | 11 | 0.2% |
| Puerto Rican | 107 | 1.9% |
| Scotch-Irish | 15 | 0.3% |
| Scottish | 13 | 0.2% |
| Thai | 14 | 0.2% | View All 15 Rows |
Immigrants in Waynesboro
The most numerous immigrant groups reported in Waynesboro came from Central America (78 | 1.4%), Latin America (78 | 1.4%), Mexico (78 | 1.4%), Asia (14 | 0.2%), and South Central Asia (14 | 0.2%), together accounting for 4.6% of all Waynesboro residents.
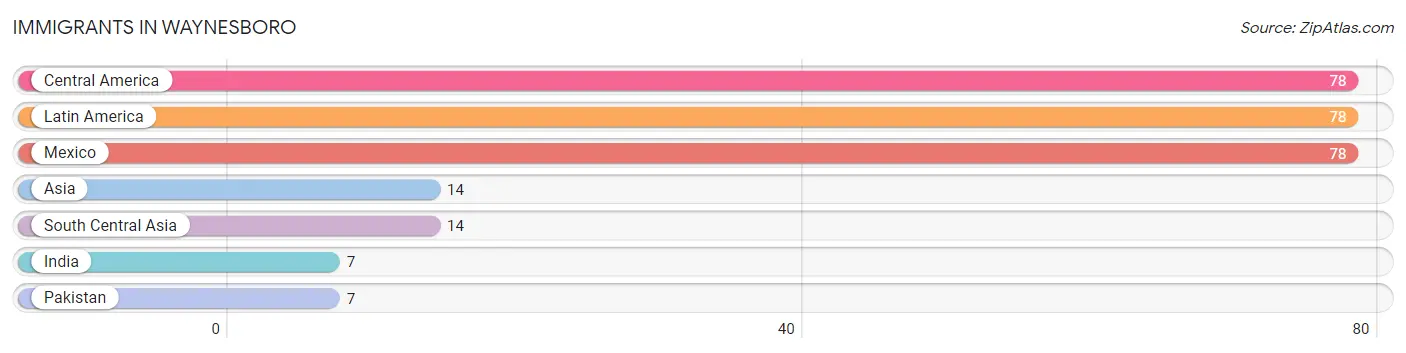
| Immigration Origin | # Population | % Population |
| Asia | 14 | 0.2% |
| Central America | 78 | 1.4% |
| India | 7 | 0.1% |
| Latin America | 78 | 1.4% |
| Mexico | 78 | 1.4% |
| Pakistan | 7 | 0.1% |
| South Central Asia | 14 | 0.2% | View All 7 Rows |
Sex and Age in Waynesboro
Sex and Age in Waynesboro
The most populous age groups in Waynesboro are Under 5 Years (439 | 16.8%) for men and 35 to 39 Years (388 | 12.5%) for women.
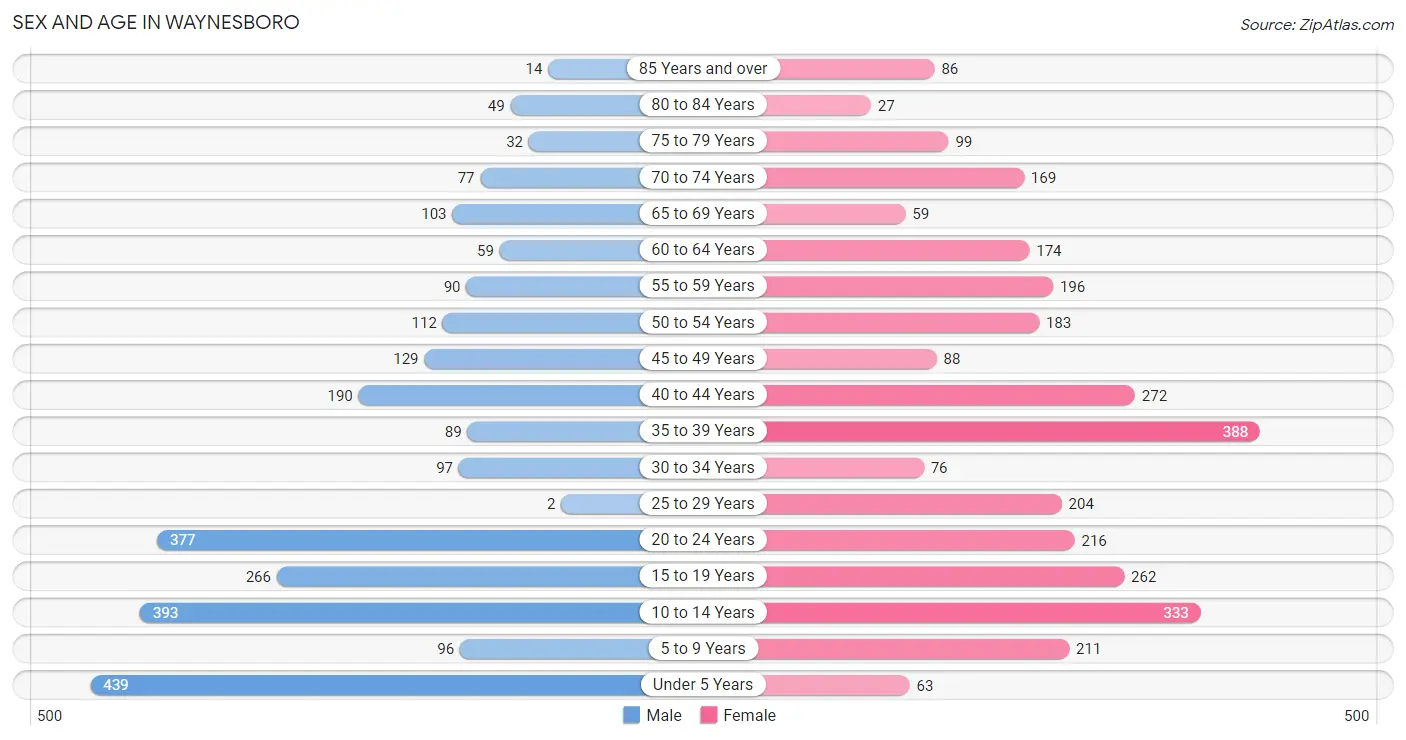
| Age Bracket | Male | Female |
| Under 5 Years | 439 (16.8%) | 63 (2.0%) |
| 5 to 9 Years | 96 (3.7%) | 211 (6.8%) |
| 10 to 14 Years | 393 (15.0%) | 333 (10.7%) |
| 15 to 19 Years | 266 (10.2%) | 262 (8.4%) |
| 20 to 24 Years | 377 (14.4%) | 216 (7.0%) |
| 25 to 29 Years | 2 (0.1%) | 204 (6.6%) |
| 30 to 34 Years | 97 (3.7%) | 76 (2.5%) |
| 35 to 39 Years | 89 (3.4%) | 388 (12.5%) |
| 40 to 44 Years | 190 (7.3%) | 272 (8.8%) |
| 45 to 49 Years | 129 (4.9%) | 88 (2.8%) |
| 50 to 54 Years | 112 (4.3%) | 183 (5.9%) |
| 55 to 59 Years | 90 (3.4%) | 196 (6.3%) |
| 60 to 64 Years | 59 (2.3%) | 174 (5.6%) |
| 65 to 69 Years | 103 (3.9%) | 59 (1.9%) |
| 70 to 74 Years | 77 (2.9%) | 169 (5.4%) |
| 75 to 79 Years | 32 (1.2%) | 99 (3.2%) |
| 80 to 84 Years | 49 (1.9%) | 27 (0.9%) |
| 85 Years and over | 14 (0.5%) | 86 (2.8%) |
| Total | 2,614 (100.0%) | 3,106 (100.0%) |
Families and Households in Waynesboro
Median Family Size in Waynesboro
The median family size in Waynesboro is 3.57 persons per family, with single male/father families (45 | 3.3%) accounting for the largest median family size of 4.69 persons per family. On the other hand, single female/mother families (655 | 47.7%) represent the smallest median family size with 3.47 persons per family.
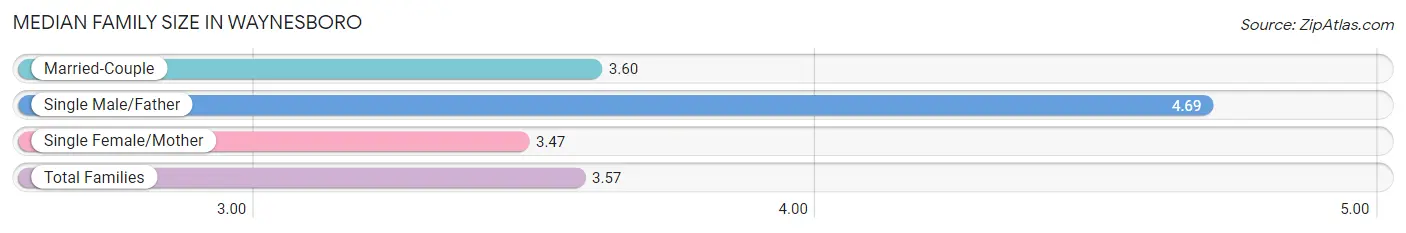
| Family Type | # Families | Family Size |
| Married-Couple | 672 (49.0%) | 3.60 |
| Single Male/Father | 45 (3.3%) | 4.69 |
| Single Female/Mother | 655 (47.7%) | 3.47 |
| Total Families | 1,372 (100.0%) | 3.57 |
Median Household Size in Waynesboro
The median household size in Waynesboro is 2.78 persons per household, with single male/father households (45 | 2.2%) accounting for the largest median household size of 4.69 persons per household. non-family households (655 | 32.3%) represent the smallest median household size with 1.03 persons per household.
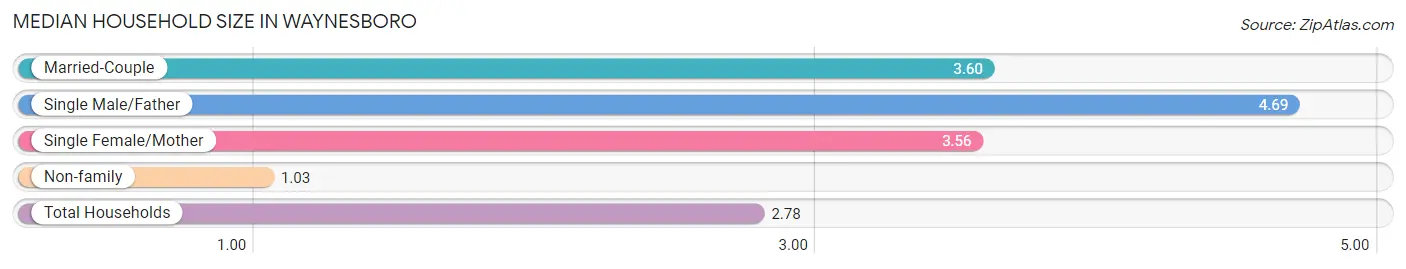
| Household Type | # Households | Household Size |
| Married-Couple | 672 (33.2%) | 3.60 |
| Single Male/Father | 45 (2.2%) | 4.69 |
| Single Female/Mother | 655 (32.3%) | 3.56 |
| Non-family | 655 (32.3%) | 1.03 |
| Total Households | 2,027 (100.0%) | 2.78 |
Household Size by Marriage Status in Waynesboro
Out of a total of 2,027 households in Waynesboro, 1,372 (67.7%) are family households, while 655 (32.3%) are nonfamily households. The most numerous type of family households are 2-person households, comprising 482, and the most common type of nonfamily households are 1-person households, comprising 637.
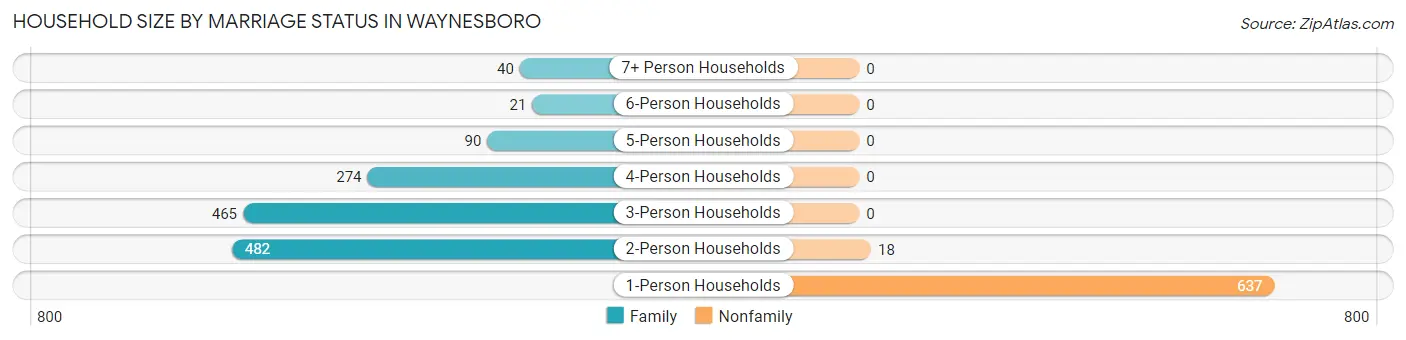
| Household Size | Family Households | Nonfamily Households |
| 1-Person Households | - | 637 (31.4%) |
| 2-Person Households | 482 (23.8%) | 18 (0.9%) |
| 3-Person Households | 465 (22.9%) | 0 (0.0%) |
| 4-Person Households | 274 (13.5%) | 0 (0.0%) |
| 5-Person Households | 90 (4.4%) | 0 (0.0%) |
| 6-Person Households | 21 (1.0%) | 0 (0.0%) |
| 7+ Person Households | 40 (2.0%) | 0 (0.0%) |
| Total | 1,372 (67.7%) | 655 (32.3%) |
Female Fertility in Waynesboro
Fertility by Age in Waynesboro
Average fertility rate in Waynesboro is 46.0 births per 1,000 women. Women in the age bracket of 35 to 50 years have the highest fertility rate with 66.0 births per 1,000 women. Women in the age bracket of 35 to 50 years acount for 71.8% of all women with births.
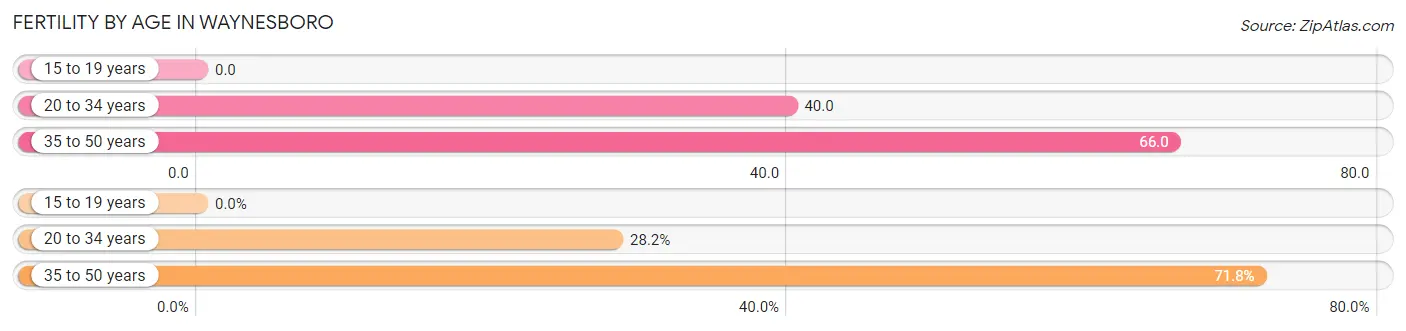
| Age Bracket | Women with Births | Births / 1,000 Women |
| 15 to 19 years | 0 (0.0%) | 0.0 |
| 20 to 34 years | 20 (28.2%) | 40.0 |
| 35 to 50 years | 51 (71.8%) | 66.0 |
| Total | 71 (100.0%) | 46.0 |
Fertility by Age by Marriage Status in Waynesboro
71.8% of women with births (71) in Waynesboro are married. The highest percentage of unmarried women with births falls into 20 to 34 years age bracket with 100.0% of them unmarried at the time of birth, while the lowest percentage of unmarried women with births belong to 35 to 50 years age bracket with 0.0% of them unmarried.
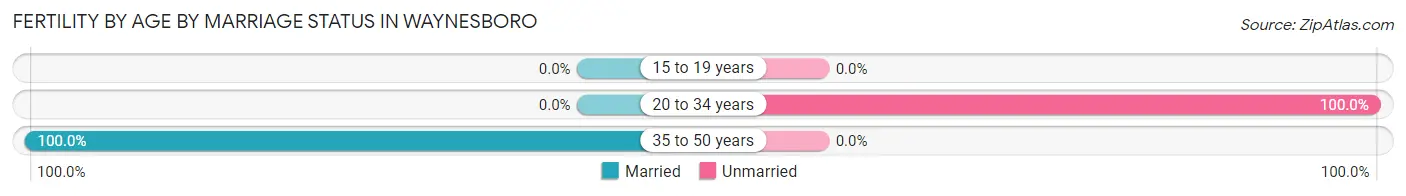
| Age Bracket | Married | Unmarried |
| 15 to 19 years | 0 (0.0%) | 0 (0.0%) |
| 20 to 34 years | 0 (0.0%) | 20 (100.0%) |
| 35 to 50 years | 51 (100.0%) | 0 (0.0%) |
| Total | 51 (71.8%) | 20 (28.2%) |
Fertility by Education in Waynesboro
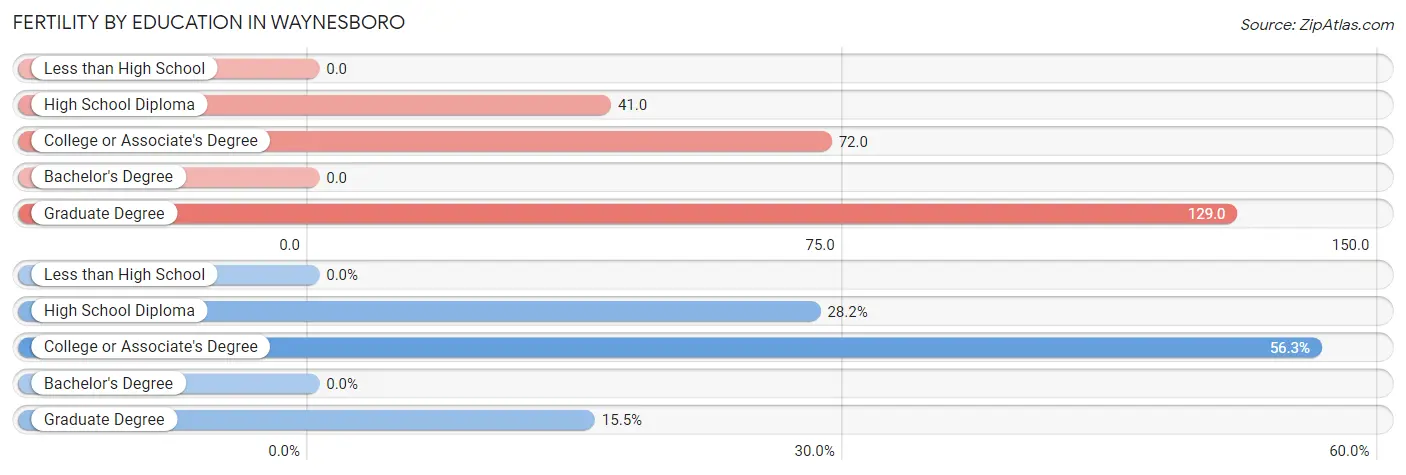
| Educational Attainment | Women with Births | Births / 1,000 Women |
| Less than High School | 0 (0.0%) | 0.0 |
| High School Diploma | 20 (28.2%) | 41.0 |
| College or Associate's Degree | 40 (56.3%) | 72.0 |
| Bachelor's Degree | 0 (0.0%) | 0.0 |
| Graduate Degree | 11 (15.5%) | 129.0 |
| Total | 71 (100.0%) | 46.0 |
Fertility by Education by Marriage Status in Waynesboro
28.2% of women with births in Waynesboro are unmarried. Women with the educational attainment of college or associate's degree are most likely to be married with 100.0% of them married at childbirth, while women with the educational attainment of high school diploma are least likely to be married with 100.0% of them unmarried at childbirth.
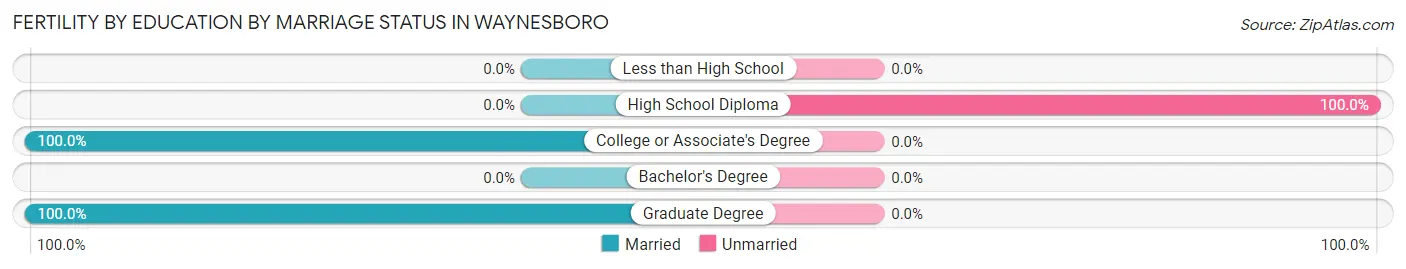
| Educational Attainment | Married | Unmarried |
| Less than High School | 0 (0.0%) | 0 (0.0%) |
| High School Diploma | 0 (0.0%) | 20 (100.0%) |
| College or Associate's Degree | 40 (100.0%) | 0 (0.0%) |
| Bachelor's Degree | 0 (0.0%) | 0 (0.0%) |
| Graduate Degree | 11 (100.0%) | 0 (0.0%) |
| Total | 51 (71.8%) | 20 (28.2%) |
Employment Characteristics in Waynesboro
Employment by Class of Employer in Waynesboro
Among the 2,458 employed individuals in Waynesboro, private company employees (1,921 | 78.1%), local government employees (186 | 7.6%), and state government employees (162 | 6.6%) make up the most common classes of employment.
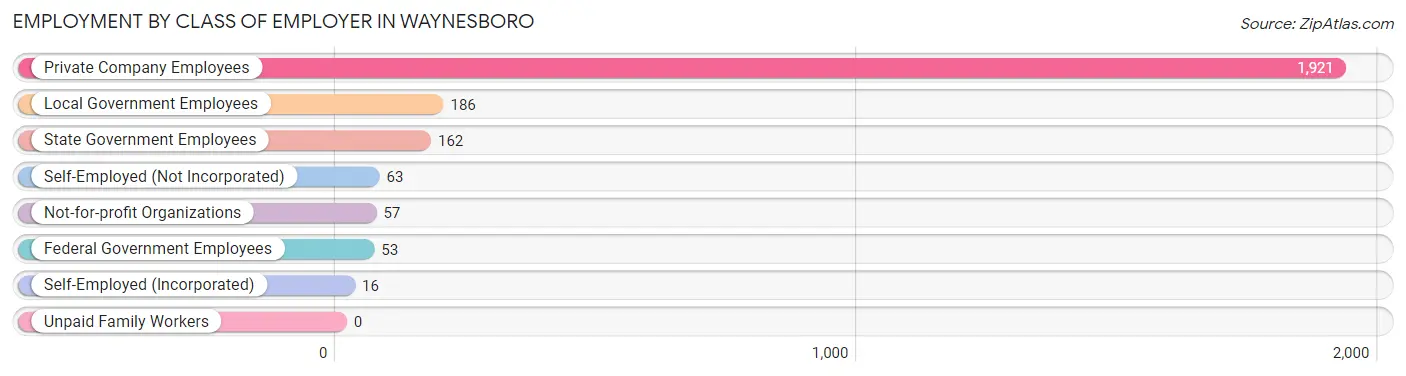
| Employer Class | # Employees | % Employees |
| Private Company Employees | 1,921 | 78.1% |
| Self-Employed (Incorporated) | 16 | 0.6% |
| Self-Employed (Not Incorporated) | 63 | 2.6% |
| Not-for-profit Organizations | 57 | 2.3% |
| Local Government Employees | 186 | 7.6% |
| State Government Employees | 162 | 6.6% |
| Federal Government Employees | 53 | 2.2% |
| Unpaid Family Workers | 0 | 0.0% |
| Total | 2,458 | 100.0% |
Employment Status by Age in Waynesboro
According to the labor force statistics for Waynesboro, out of the total population over 16 years of age (4,094), 65.5% or 2,682 individuals are in the labor force, with 4.8% or 129 of them unemployed. The age group with the highest labor force participation rate is 35 to 44 years, with 93.7% or 880 individuals in the labor force. Within the labor force, the 25 to 29 years age range has the highest percentage of unemployed individuals, with 39.4% or 74 of them being unemployed.
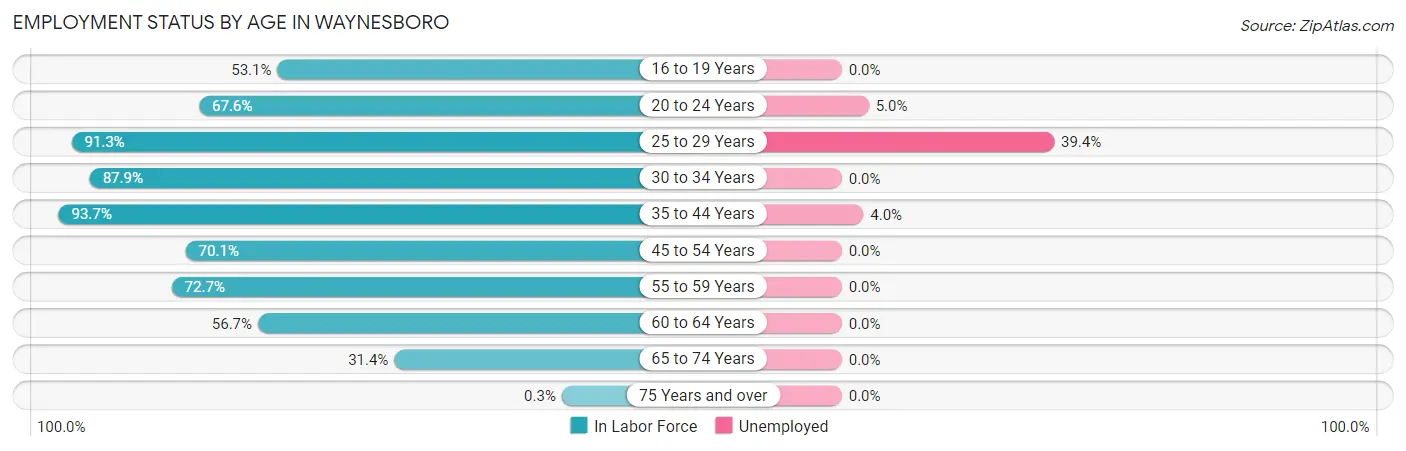
| Age Bracket | In Labor Force | Unemployed |
| 16 to 19 Years | 232 (53.1%) | 0 (0.0%) |
| 20 to 24 Years | 401 (67.6%) | 20 (5.0%) |
| 25 to 29 Years | 188 (91.3%) | 74 (39.4%) |
| 30 to 34 Years | 152 (87.9%) | 0 (0.0%) |
| 35 to 44 Years | 880 (93.7%) | 35 (4.0%) |
| 45 to 54 Years | 359 (70.1%) | 0 (0.0%) |
| 55 to 59 Years | 208 (72.7%) | 0 (0.0%) |
| 60 to 64 Years | 132 (56.7%) | 0 (0.0%) |
| 65 to 74 Years | 128 (31.4%) | 0 (0.0%) |
| 75 Years and over | 1 (0.3%) | 0 (0.0%) |
| Total | 2,682 (65.5%) | 129 (4.8%) |
Employment Status by Educational Attainment in Waynesboro
According to labor force statistics for Waynesboro, 81.7% of individuals (1,919) out of the total population between 25 and 64 years of age (2,349) are in the labor force, with 5.7% or 109 of them being unemployed. The group with the highest labor force participation rate are those with the educational attainment of college / associate degree, with 93.8% or 879 individuals in the labor force. Within the labor force, individuals with college / associate degree education have the highest percentage of unemployment, with 12.4% or 109 of them being unemployed.
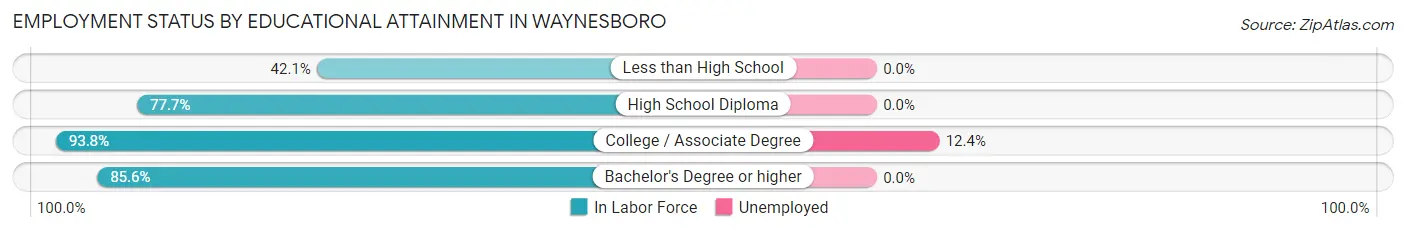
| Educational Attainment | In Labor Force | Unemployed |
| Less than High School | 99 (42.1%) | 0 (0.0%) |
| High School Diploma | 650 (77.7%) | 0 (0.0%) |
| College / Associate Degree | 879 (93.8%) | 116 (12.4%) |
| Bachelor's Degree or higher | 291 (85.6%) | 0 (0.0%) |
| Total | 1,919 (81.7%) | 134 (5.7%) |
Employment Occupations by Sex in Waynesboro
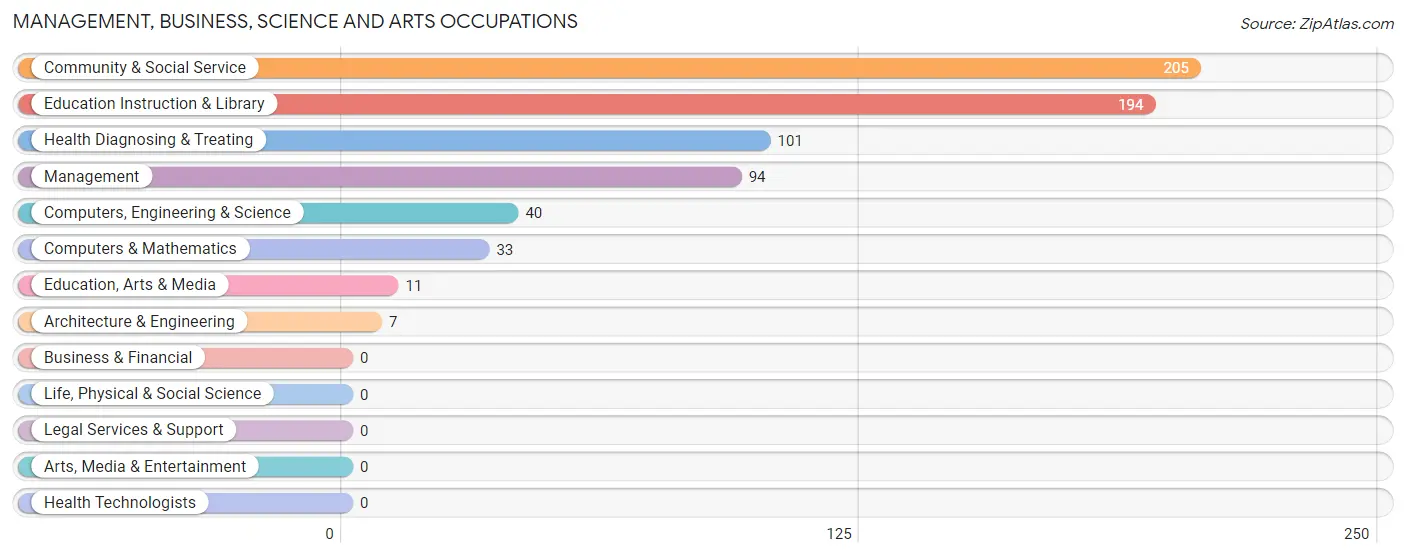
Management, Business, Science and Arts Occupations
The most common Management, Business, Science and Arts occupations in Waynesboro are Community & Social Service (205 | 8.0%), Education Instruction & Library (194 | 7.6%), Health Diagnosing & Treating (101 | 4.0%), Management (94 | 3.7%), and Computers, Engineering & Science (40 | 1.6%).
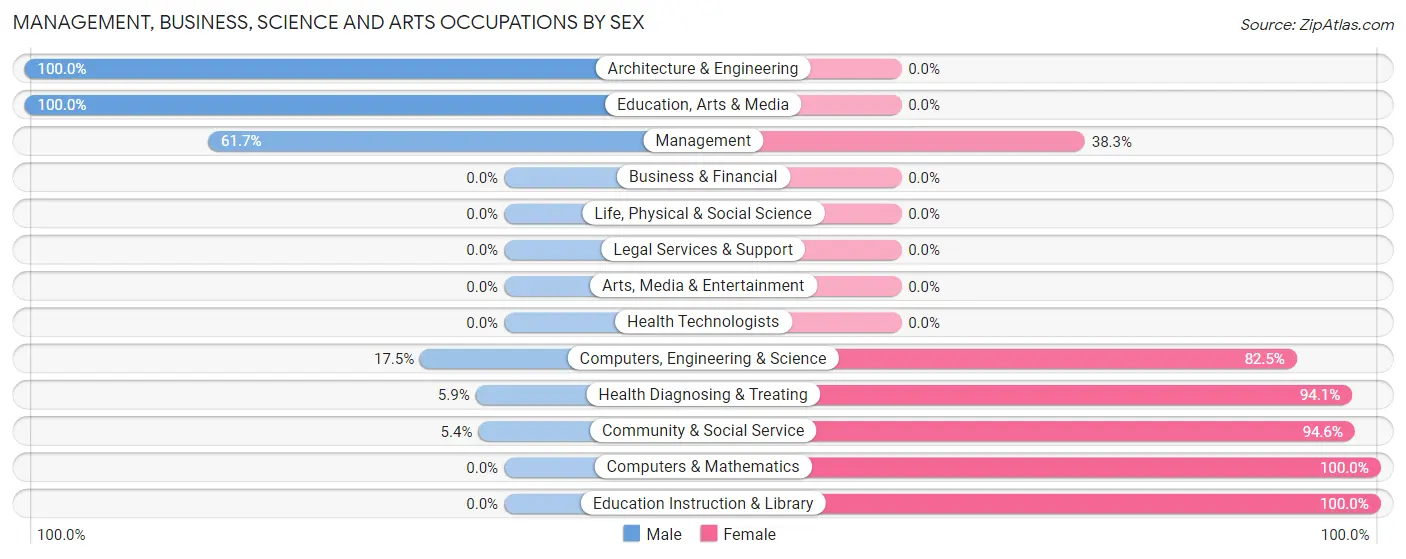
Management, Business, Science and Arts Occupations by Sex
Within the Management, Business, Science and Arts occupations in Waynesboro, the most male-oriented occupations are Architecture & Engineering (100.0%), Education, Arts & Media (100.0%), and Management (61.7%), while the most female-oriented occupations are Computers & Mathematics (100.0%), Education Instruction & Library (100.0%), and Community & Social Service (94.6%).
| Occupation | Male | Female |
| Management | 58 (61.7%) | 36 (38.3%) |
| Business & Financial | 0 (0.0%) | 0 (0.0%) |
| Computers, Engineering & Science | 7 (17.5%) | 33 (82.5%) |
| Computers & Mathematics | 0 (0.0%) | 33 (100.0%) |
| Architecture & Engineering | 7 (100.0%) | 0 (0.0%) |
| Life, Physical & Social Science | 0 (0.0%) | 0 (0.0%) |
| Community & Social Service | 11 (5.4%) | 194 (94.6%) |
| Education, Arts & Media | 11 (100.0%) | 0 (0.0%) |
| Legal Services & Support | 0 (0.0%) | 0 (0.0%) |
| Education Instruction & Library | 0 (0.0%) | 194 (100.0%) |
| Arts, Media & Entertainment | 0 (0.0%) | 0 (0.0%) |
| Health Diagnosing & Treating | 6 (5.9%) | 95 (94.1%) |
| Health Technologists | 0 (0.0%) | 0 (0.0%) |
| Total (Category) | 82 (18.6%) | 358 (81.4%) |
| Total (Overall) | 1,065 (41.7%) | 1,487 (58.3%) |
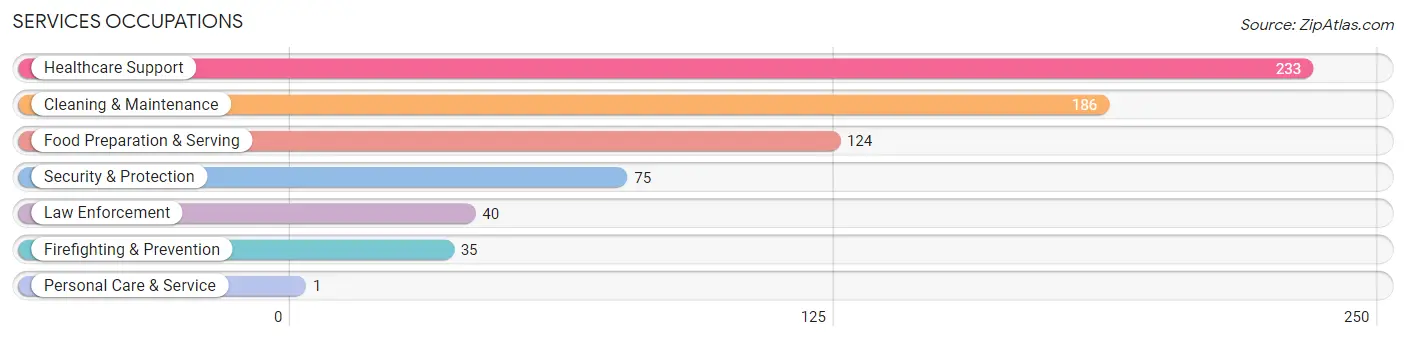
Services Occupations
The most common Services occupations in Waynesboro are Healthcare Support (233 | 9.1%), Cleaning & Maintenance (186 | 7.3%), Food Preparation & Serving (124 | 4.9%), Security & Protection (75 | 2.9%), and Law Enforcement (40 | 1.6%).
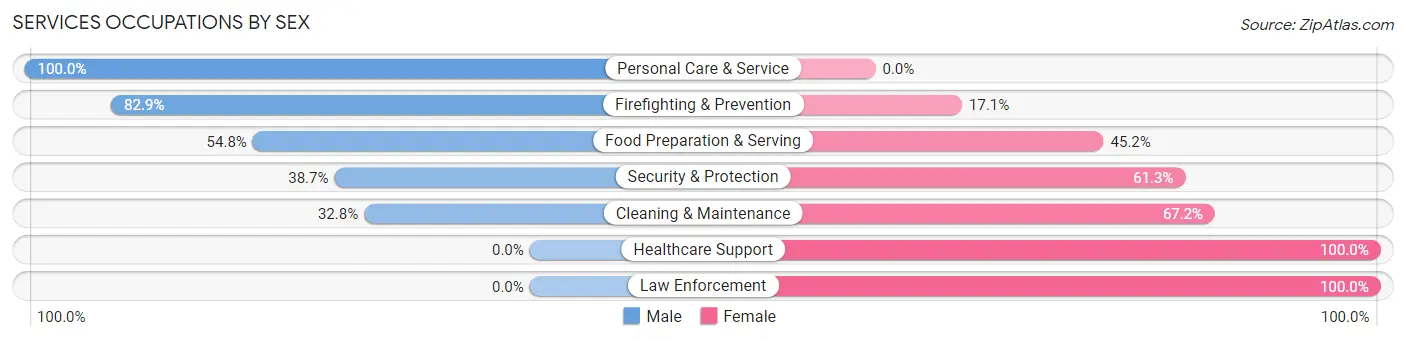
Services Occupations by Sex
Within the Services occupations in Waynesboro, the most male-oriented occupations are Personal Care & Service (100.0%), Firefighting & Prevention (82.9%), and Food Preparation & Serving (54.8%), while the most female-oriented occupations are Healthcare Support (100.0%), Law Enforcement (100.0%), and Cleaning & Maintenance (67.2%).
| Occupation | Male | Female |
| Healthcare Support | 0 (0.0%) | 233 (100.0%) |
| Security & Protection | 29 (38.7%) | 46 (61.3%) |
| Firefighting & Prevention | 29 (82.9%) | 6 (17.1%) |
| Law Enforcement | 0 (0.0%) | 40 (100.0%) |
| Food Preparation & Serving | 68 (54.8%) | 56 (45.2%) |
| Cleaning & Maintenance | 61 (32.8%) | 125 (67.2%) |
| Personal Care & Service | 1 (100.0%) | 0 (0.0%) |
| Total (Category) | 159 (25.7%) | 460 (74.3%) |
| Total (Overall) | 1,065 (41.7%) | 1,487 (58.3%) |
Sales and Office Occupations
The most common Sales and Office occupations in Waynesboro are Sales & Related (318 | 12.5%), and Office & Administration (147 | 5.8%).
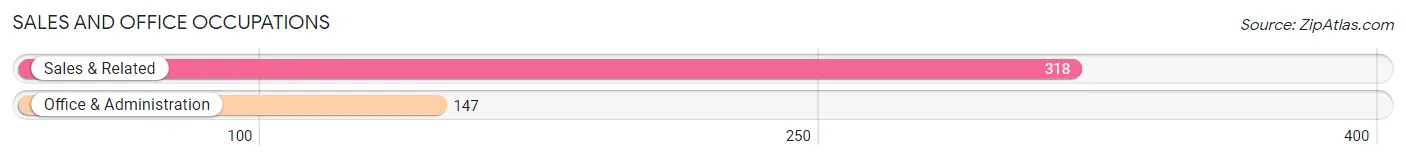
Sales and Office Occupations by Sex

| Occupation | Male | Female |
| Sales & Related | 74 (23.3%) | 244 (76.7%) |
| Office & Administration | 0 (0.0%) | 147 (100.0%) |
| Total (Category) | 74 (15.9%) | 391 (84.1%) |
| Total (Overall) | 1,065 (41.7%) | 1,487 (58.3%) |
Natural Resources, Construction and Maintenance Occupations
The most common Natural Resources, Construction and Maintenance occupations in Waynesboro are Construction & Extraction (81 | 3.2%), and Installation, Maintenance & Repair (74 | 2.9%).
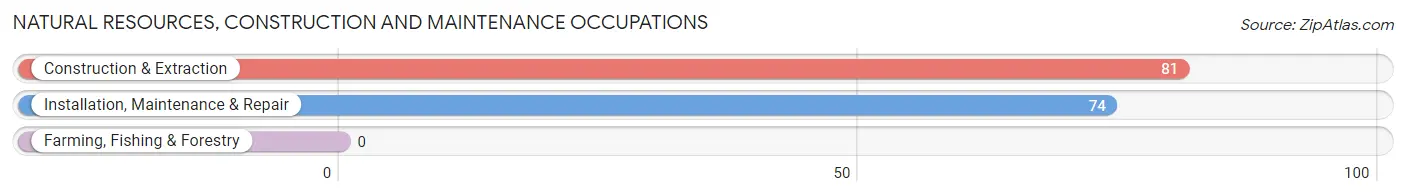
Natural Resources, Construction and Maintenance Occupations by Sex
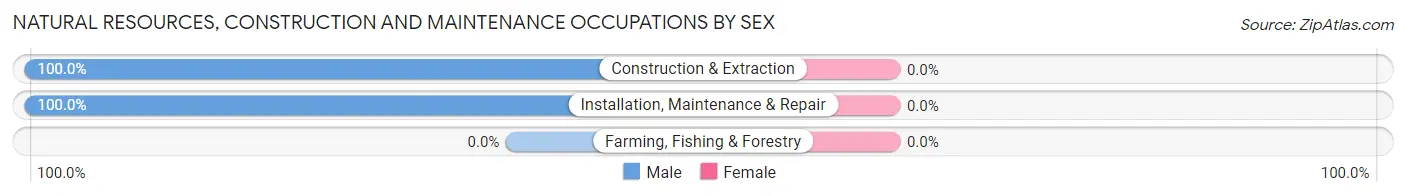
| Occupation | Male | Female |
| Farming, Fishing & Forestry | 0 (0.0%) | 0 (0.0%) |
| Construction & Extraction | 81 (100.0%) | 0 (0.0%) |
| Installation, Maintenance & Repair | 74 (100.0%) | 0 (0.0%) |
| Total (Category) | 155 (100.0%) | 0 (0.0%) |
| Total (Overall) | 1,065 (41.7%) | 1,487 (58.3%) |
Production, Transportation and Moving Occupations
The most common Production, Transportation and Moving occupations in Waynesboro are Transportation (469 | 18.4%), Production (262 | 10.3%), and Material Moving (142 | 5.6%).
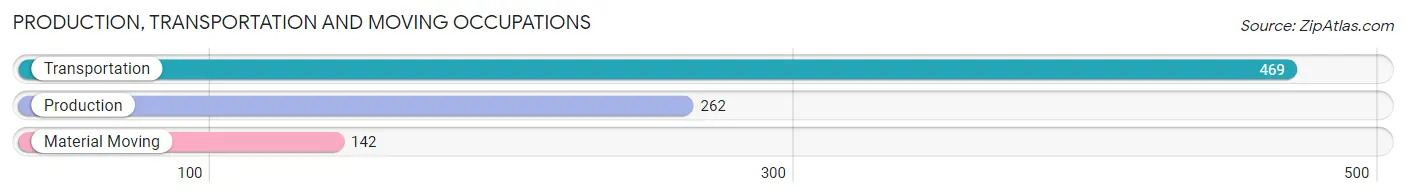
Production, Transportation and Moving Occupations by Sex
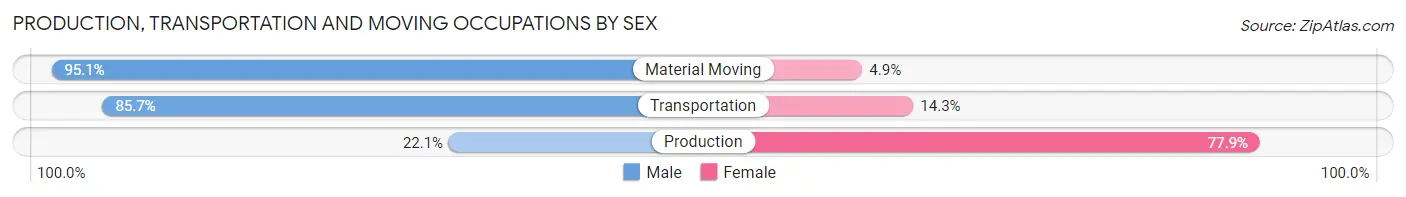
| Occupation | Male | Female |
| Production | 58 (22.1%) | 204 (77.9%) |
| Transportation | 402 (85.7%) | 67 (14.3%) |
| Material Moving | 135 (95.1%) | 7 (4.9%) |
| Total (Category) | 595 (68.2%) | 278 (31.8%) |
| Total (Overall) | 1,065 (41.7%) | 1,487 (58.3%) |
Employment Industries by Sex in Waynesboro
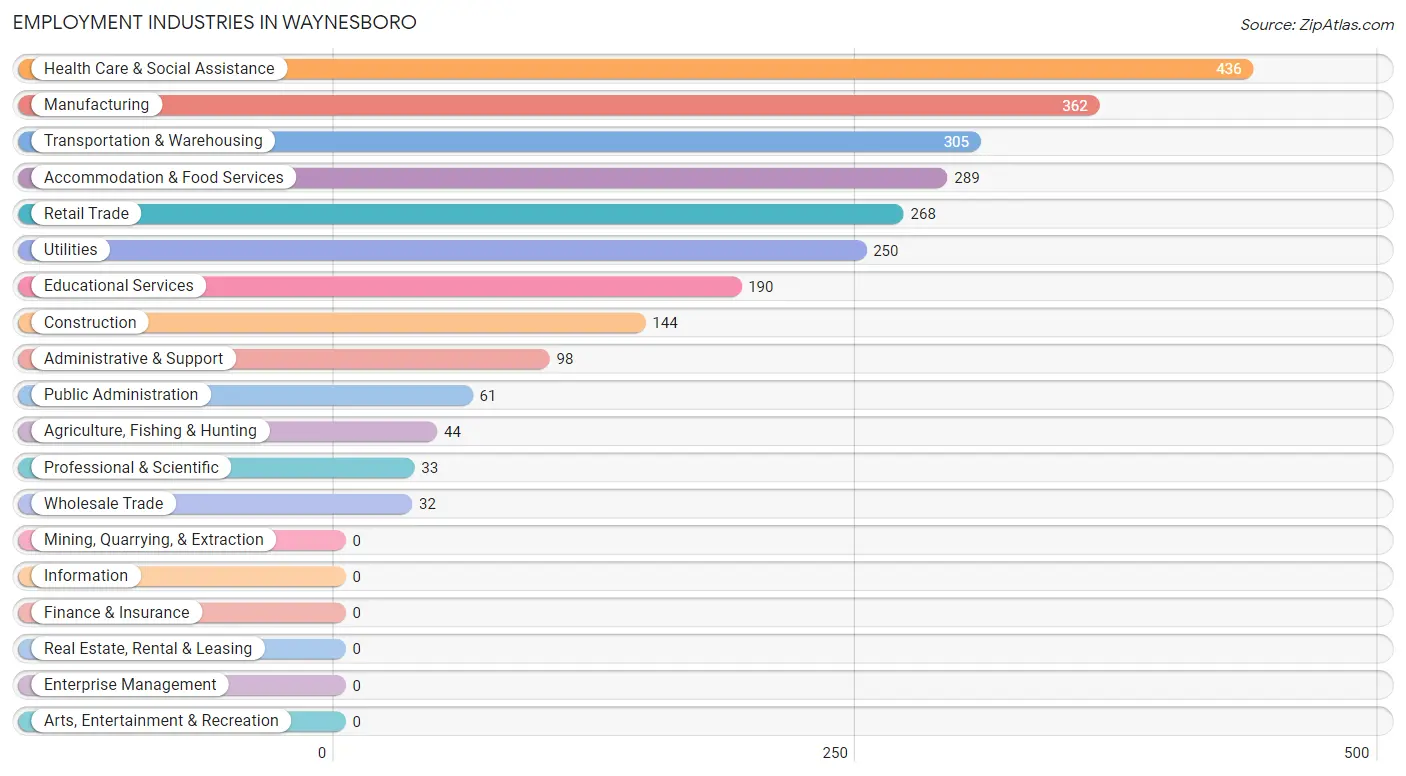
Employment Industries in Waynesboro
The major employment industries in Waynesboro include Health Care & Social Assistance (436 | 17.1%), Manufacturing (362 | 14.2%), Transportation & Warehousing (305 | 11.9%), Accommodation & Food Services (289 | 11.3%), and Retail Trade (268 | 10.5%).
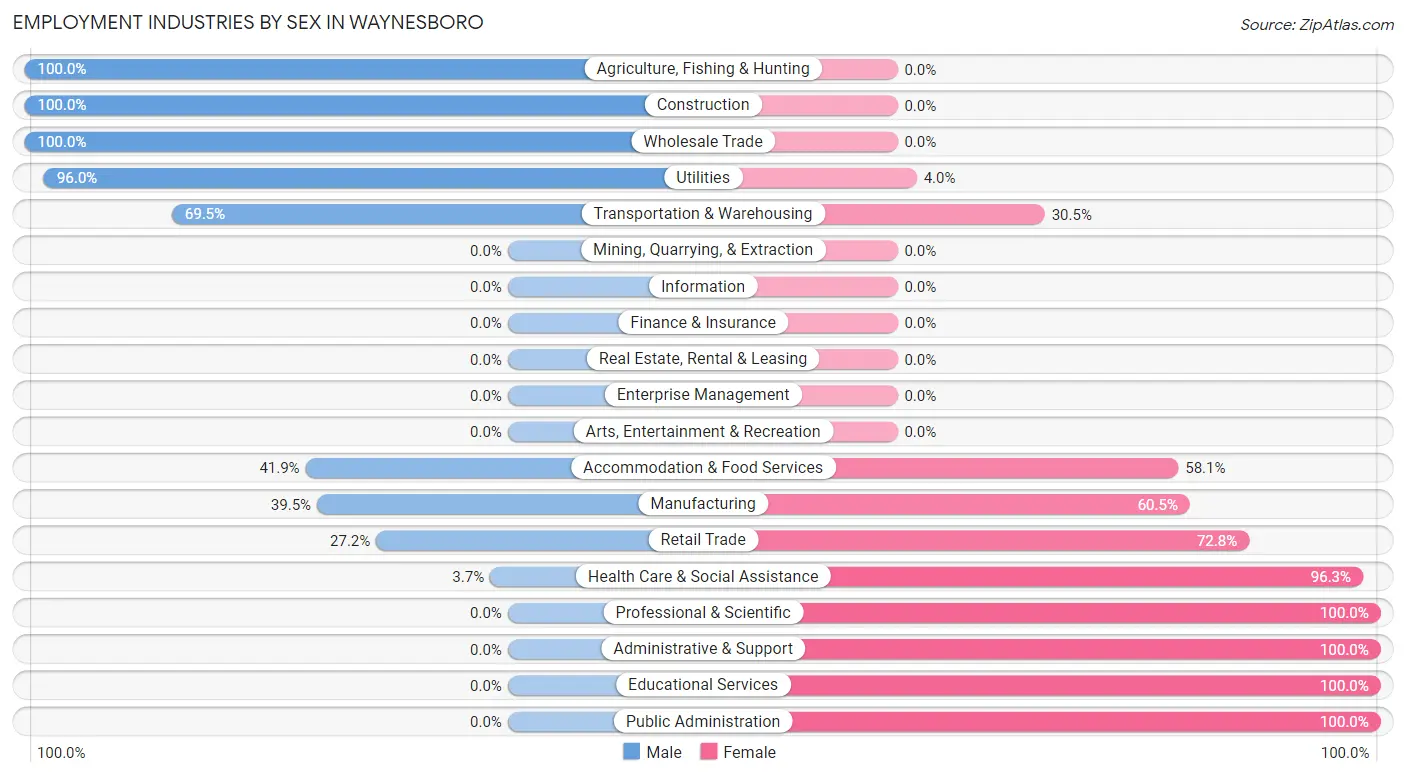
Employment Industries by Sex in Waynesboro
The Waynesboro industries that see more men than women are Agriculture, Fishing & Hunting (100.0%), Construction (100.0%), and Wholesale Trade (100.0%), whereas the industries that tend to have a higher number of women are Professional & Scientific (100.0%), Administrative & Support (100.0%), and Educational Services (100.0%).
| Industry | Male | Female |
| Agriculture, Fishing & Hunting | 44 (100.0%) | 0 (0.0%) |
| Mining, Quarrying, & Extraction | 0 (0.0%) | 0 (0.0%) |
| Construction | 144 (100.0%) | 0 (0.0%) |
| Manufacturing | 143 (39.5%) | 219 (60.5%) |
| Wholesale Trade | 32 (100.0%) | 0 (0.0%) |
| Retail Trade | 73 (27.2%) | 195 (72.8%) |
| Transportation & Warehousing | 212 (69.5%) | 93 (30.5%) |
| Utilities | 240 (96.0%) | 10 (4.0%) |
| Information | 0 (0.0%) | 0 (0.0%) |
| Finance & Insurance | 0 (0.0%) | 0 (0.0%) |
| Real Estate, Rental & Leasing | 0 (0.0%) | 0 (0.0%) |
| Professional & Scientific | 0 (0.0%) | 33 (100.0%) |
| Enterprise Management | 0 (0.0%) | 0 (0.0%) |
| Administrative & Support | 0 (0.0%) | 98 (100.0%) |
| Educational Services | 0 (0.0%) | 190 (100.0%) |
| Health Care & Social Assistance | 16 (3.7%) | 420 (96.3%) |
| Arts, Entertainment & Recreation | 0 (0.0%) | 0 (0.0%) |
| Accommodation & Food Services | 121 (41.9%) | 168 (58.1%) |
| Public Administration | 0 (0.0%) | 61 (100.0%) |
| Total | 1,065 (41.7%) | 1,487 (58.3%) |
Education in Waynesboro
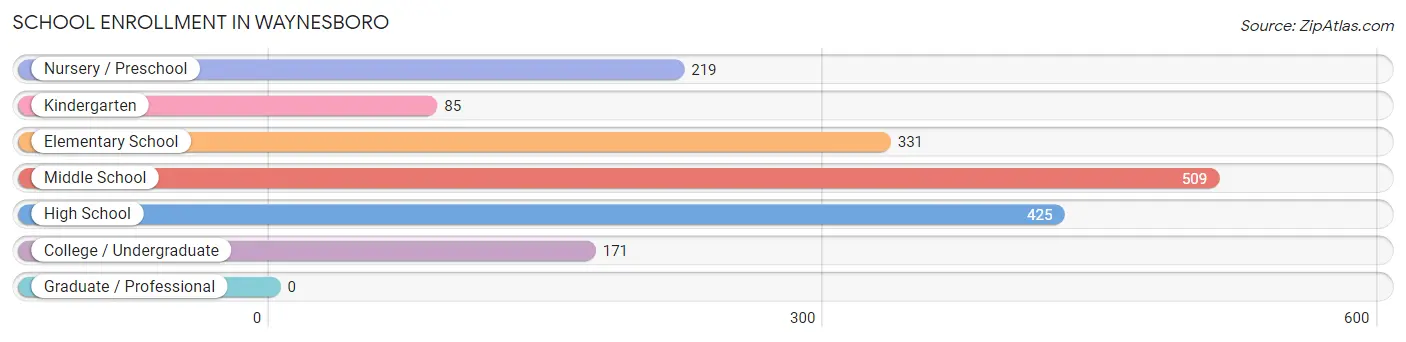
School Enrollment in Waynesboro
The most common levels of schooling among the 1,740 students in Waynesboro are middle school (509 | 29.2%), high school (425 | 24.4%), and elementary school (331 | 19.0%).
| School Level | # Students | % Students |
| Nursery / Preschool | 219 | 12.6% |
| Kindergarten | 85 | 4.9% |
| Elementary School | 331 | 19.0% |
| Middle School | 509 | 29.2% |
| High School | 425 | 24.4% |
| College / Undergraduate | 171 | 9.8% |
| Graduate / Professional | 0 | 0.0% |
| Total | 1,740 | 100.0% |
School Enrollment by Age by Funding Source in Waynesboro
Out of a total of 1,740 students who are enrolled in schools in Waynesboro, 57 (3.3%) attend a private institution, while the remaining 1,683 (96.7%) are enrolled in public schools. The age group of 3 to 4 year olds has the highest likelihood of being enrolled in private schools, with 18 (12.1% in the age bracket) enrolled. Conversely, the age group of 15 to 17 year olds has the lowest likelihood of being enrolled in a private school, with 340 (100.0% in the age bracket) attending a public institution.
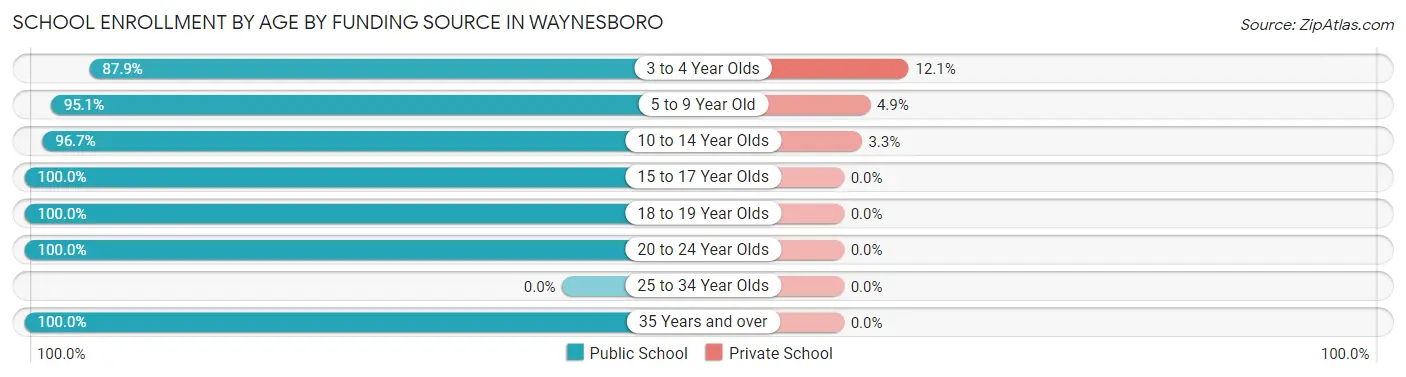
| Age Bracket | Public School | Private School |
| 3 to 4 Year Olds | 131 (87.9%) | 18 (12.1%) |
| 5 to 9 Year Old | 292 (95.1%) | 15 (4.9%) |
| 10 to 14 Year Olds | 702 (96.7%) | 24 (3.3%) |
| 15 to 17 Year Olds | 340 (100.0%) | 0 (0.0%) |
| 18 to 19 Year Olds | 83 (100.0%) | 0 (0.0%) |
| 20 to 24 Year Olds | 105 (100.0%) | 0 (0.0%) |
| 25 to 34 Year Olds | 0 (0.0%) | 0 (0.0%) |
| 35 Years and over | 30 (100.0%) | 0 (0.0%) |
| Total | 1,683 (96.7%) | 57 (3.3%) |
Educational Attainment by Field of Study in Waynesboro
Education (129 | 23.9%), psychology (114 | 21.1%), arts & humanities (111 | 20.6%), business (100 | 18.5%), and science & technology (24 | 4.4%) are the most common fields of study among 540 individuals in Waynesboro who have obtained a bachelor's degree or higher.
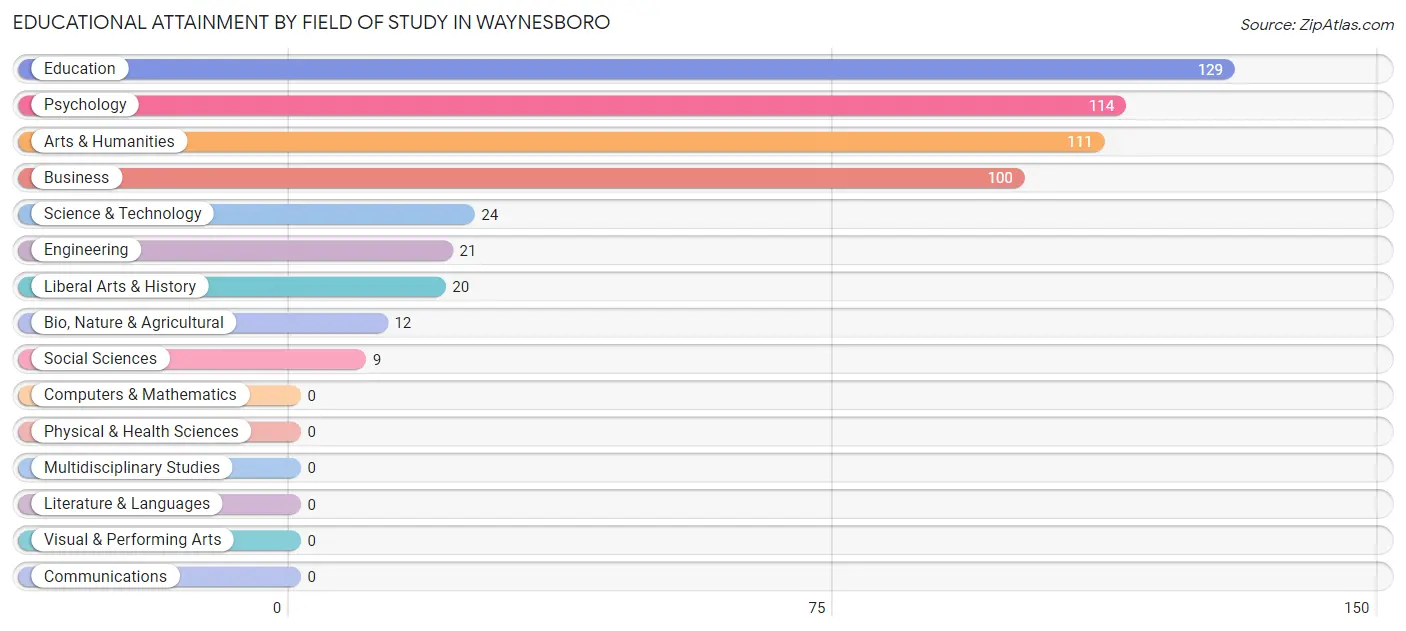
| Field of Study | # Graduates | % Graduates |
| Computers & Mathematics | 0 | 0.0% |
| Bio, Nature & Agricultural | 12 | 2.2% |
| Physical & Health Sciences | 0 | 0.0% |
| Psychology | 114 | 21.1% |
| Social Sciences | 9 | 1.7% |
| Engineering | 21 | 3.9% |
| Multidisciplinary Studies | 0 | 0.0% |
| Science & Technology | 24 | 4.4% |
| Business | 100 | 18.5% |
| Education | 129 | 23.9% |
| Literature & Languages | 0 | 0.0% |
| Liberal Arts & History | 20 | 3.7% |
| Visual & Performing Arts | 0 | 0.0% |
| Communications | 0 | 0.0% |
| Arts & Humanities | 111 | 20.6% |
| Total | 540 | 100.0% |
Transportation & Commute in Waynesboro
Vehicle Availability by Sex in Waynesboro
The most prevalent vehicle ownership categories in Waynesboro are males with 2 vehicles (553, accounting for 56.2%) and females with 2 vehicles (457, making up 37.5%).
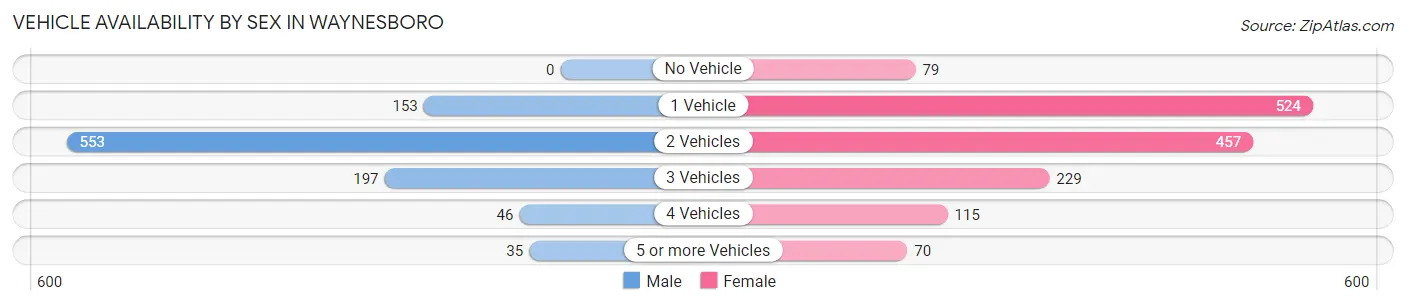
| Vehicles Available | Male | Female |
| No Vehicle | 0 (0.0%) | 79 (5.4%) |
| 1 Vehicle | 153 (15.5%) | 524 (35.5%) |
| 2 Vehicles | 553 (56.2%) | 457 (31.0%) |
| 3 Vehicles | 197 (20.0%) | 229 (15.5%) |
| 4 Vehicles | 46 (4.7%) | 115 (7.8%) |
| 5 or more Vehicles | 35 (3.6%) | 70 (4.8%) |
| Total | 984 (100.0%) | 1,474 (100.0%) |
Commute Time in Waynesboro
The most frequently occuring commute durations in Waynesboro are 5 to 9 minutes (613 commuters, 25.6%), 10 to 14 minutes (412 commuters, 17.2%), and 15 to 19 minutes (232 commuters, 9.7%).
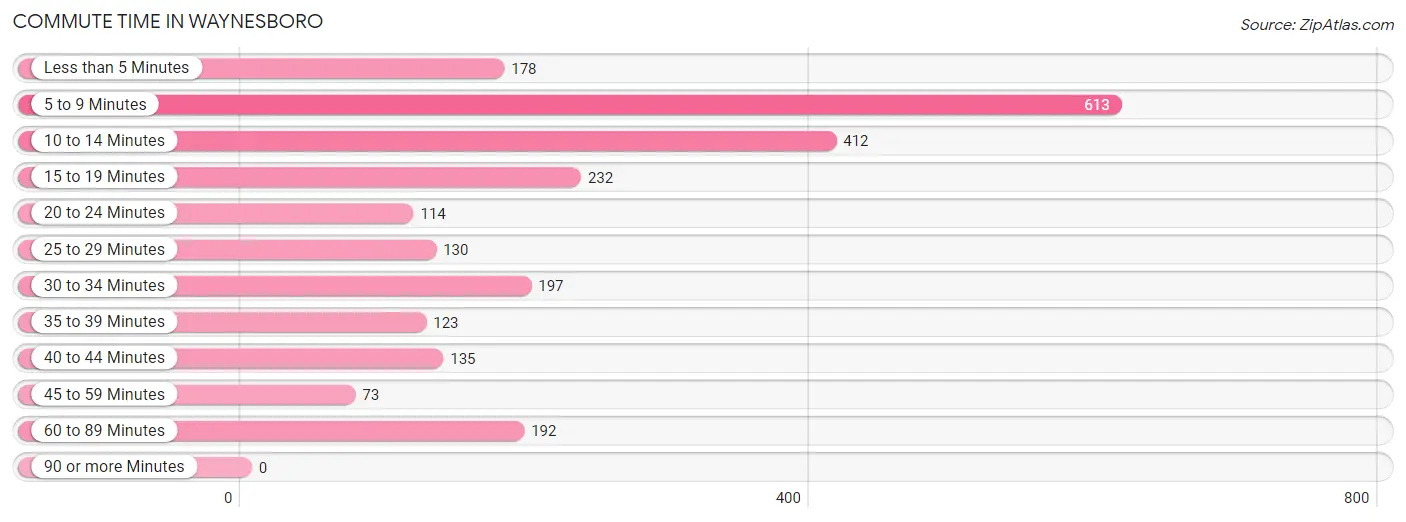
| Commute Time | # Commuters | % Commuters |
| Less than 5 Minutes | 178 | 7.4% |
| 5 to 9 Minutes | 613 | 25.6% |
| 10 to 14 Minutes | 412 | 17.2% |
| 15 to 19 Minutes | 232 | 9.7% |
| 20 to 24 Minutes | 114 | 4.8% |
| 25 to 29 Minutes | 130 | 5.4% |
| 30 to 34 Minutes | 197 | 8.2% |
| 35 to 39 Minutes | 123 | 5.1% |
| 40 to 44 Minutes | 135 | 5.6% |
| 45 to 59 Minutes | 73 | 3.0% |
| 60 to 89 Minutes | 192 | 8.0% |
| 90 or more Minutes | 0 | 0.0% |
Commute Time by Sex in Waynesboro
The most common commute times in Waynesboro are 5 to 9 minutes (228 commuters, 23.2%) for males and 5 to 9 minutes (385 commuters, 27.2%) for females.
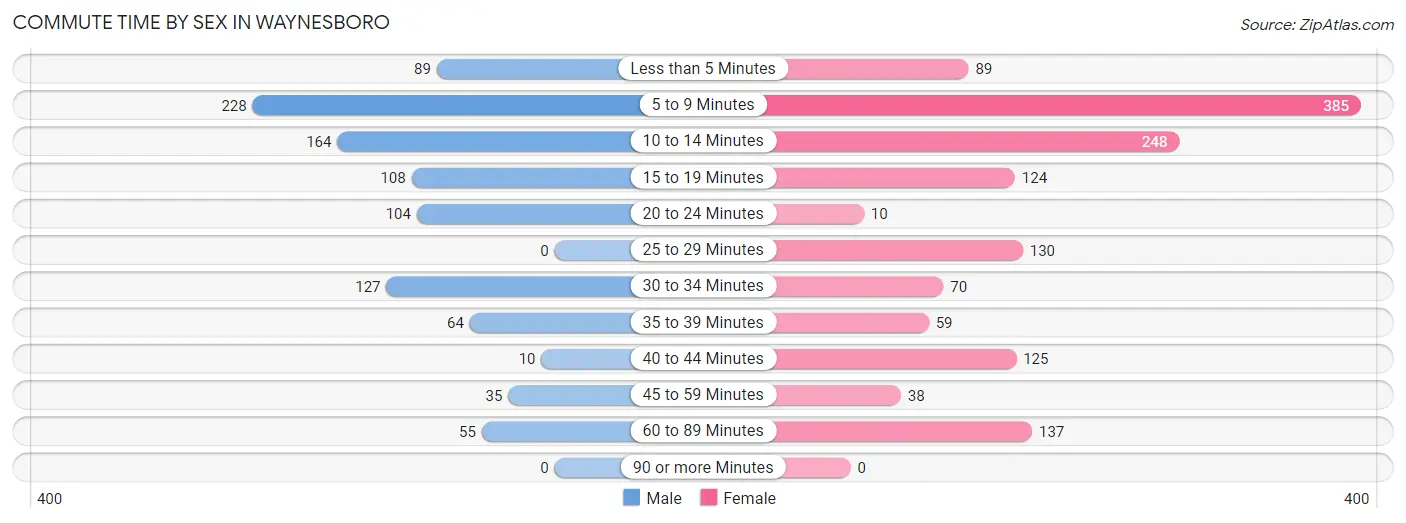
| Commute Time | Male | Female |
| Less than 5 Minutes | 89 (9.0%) | 89 (6.3%) |
| 5 to 9 Minutes | 228 (23.2%) | 385 (27.2%) |
| 10 to 14 Minutes | 164 (16.7%) | 248 (17.5%) |
| 15 to 19 Minutes | 108 (11.0%) | 124 (8.8%) |
| 20 to 24 Minutes | 104 (10.6%) | 10 (0.7%) |
| 25 to 29 Minutes | 0 (0.0%) | 130 (9.2%) |
| 30 to 34 Minutes | 127 (12.9%) | 70 (5.0%) |
| 35 to 39 Minutes | 64 (6.5%) | 59 (4.2%) |
| 40 to 44 Minutes | 10 (1.0%) | 125 (8.8%) |
| 45 to 59 Minutes | 35 (3.6%) | 38 (2.7%) |
| 60 to 89 Minutes | 55 (5.6%) | 137 (9.7%) |
| 90 or more Minutes | 0 (0.0%) | 0 (0.0%) |
Time of Departure to Work by Sex in Waynesboro
The most frequent times of departure to work in Waynesboro are 5:00 AM to 5:29 AM (226, 23.0%) for males and 7:00 AM to 7:29 AM (287, 20.3%) for females.
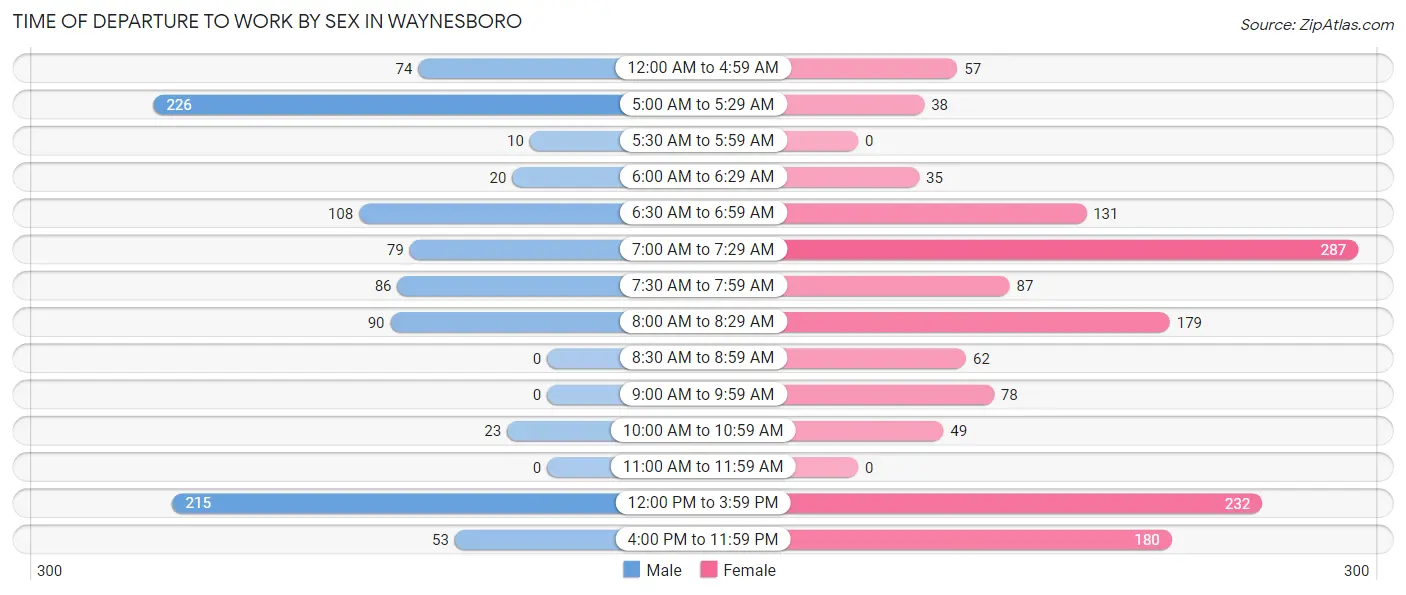
| Time of Departure | Male | Female |
| 12:00 AM to 4:59 AM | 74 (7.5%) | 57 (4.0%) |
| 5:00 AM to 5:29 AM | 226 (23.0%) | 38 (2.7%) |
| 5:30 AM to 5:59 AM | 10 (1.0%) | 0 (0.0%) |
| 6:00 AM to 6:29 AM | 20 (2.0%) | 35 (2.5%) |
| 6:30 AM to 6:59 AM | 108 (11.0%) | 131 (9.3%) |
| 7:00 AM to 7:29 AM | 79 (8.0%) | 287 (20.3%) |
| 7:30 AM to 7:59 AM | 86 (8.7%) | 87 (6.1%) |
| 8:00 AM to 8:29 AM | 90 (9.1%) | 179 (12.7%) |
| 8:30 AM to 8:59 AM | 0 (0.0%) | 62 (4.4%) |
| 9:00 AM to 9:59 AM | 0 (0.0%) | 78 (5.5%) |
| 10:00 AM to 10:59 AM | 23 (2.3%) | 49 (3.5%) |
| 11:00 AM to 11:59 AM | 0 (0.0%) | 0 (0.0%) |
| 12:00 PM to 3:59 PM | 215 (21.8%) | 232 (16.4%) |
| 4:00 PM to 11:59 PM | 53 (5.4%) | 180 (12.7%) |
| Total | 984 (100.0%) | 1,415 (100.0%) |
Housing Occupancy in Waynesboro
Occupancy by Ownership in Waynesboro
Of the total 2,027 dwellings in Waynesboro, owner-occupied units account for 796 (39.3%), while renter-occupied units make up 1,231 (60.7%).
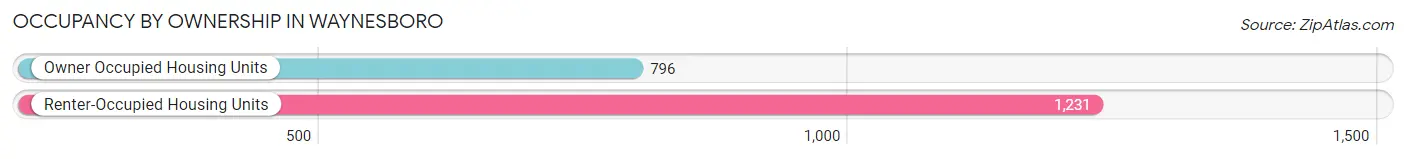
| Occupancy | # Housing Units | % Housing Units |
| Owner Occupied Housing Units | 796 | 39.3% |
| Renter-Occupied Housing Units | 1,231 | 60.7% |
| Total Occupied Housing Units | 2,027 | 100.0% |
Occupancy by Household Size in Waynesboro
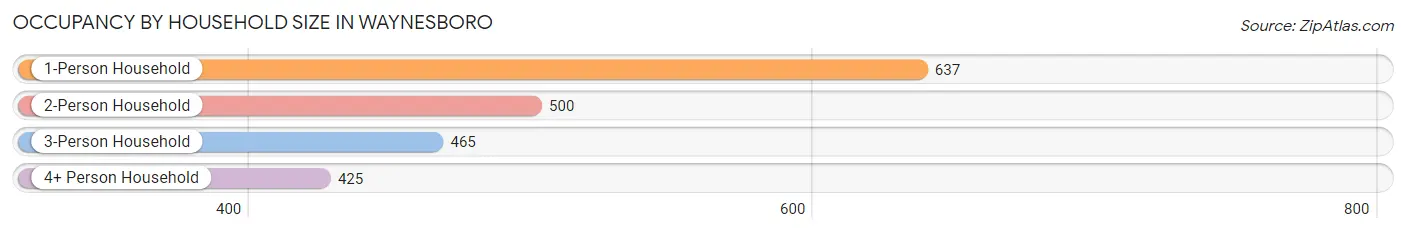
| Household Size | # Housing Units | % Housing Units |
| 1-Person Household | 637 | 31.4% |
| 2-Person Household | 500 | 24.7% |
| 3-Person Household | 465 | 22.9% |
| 4+ Person Household | 425 | 21.0% |
| Total Housing Units | 2,027 | 100.0% |
Occupancy by Ownership by Household Size in Waynesboro
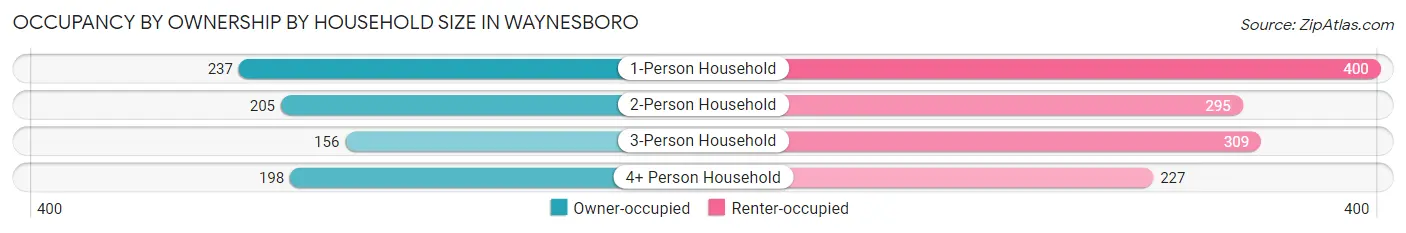
| Household Size | Owner-occupied | Renter-occupied |
| 1-Person Household | 237 (37.2%) | 400 (62.8%) |
| 2-Person Household | 205 (41.0%) | 295 (59.0%) |
| 3-Person Household | 156 (33.6%) | 309 (66.4%) |
| 4+ Person Household | 198 (46.6%) | 227 (53.4%) |
| Total Housing Units | 796 (39.3%) | 1,231 (60.7%) |
Occupancy by Educational Attainment in Waynesboro
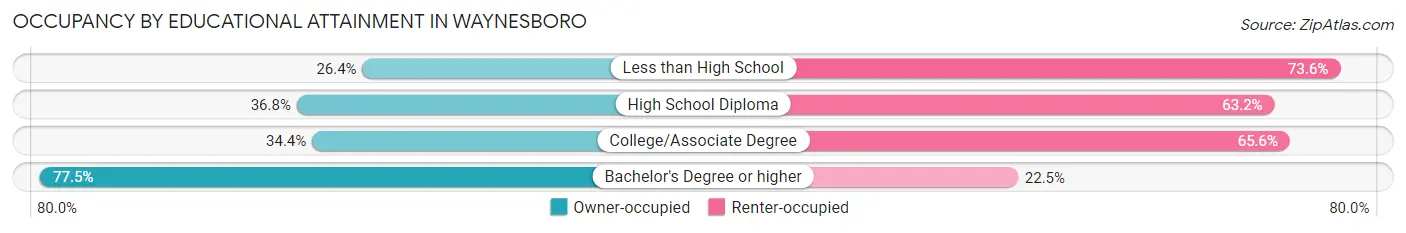
| Household Size | Owner-occupied | Renter-occupied |
| Less than High School | 61 (26.4%) | 170 (73.6%) |
| High School Diploma | 291 (36.8%) | 499 (63.2%) |
| College/Associate Degree | 268 (34.4%) | 511 (65.6%) |
| Bachelor's Degree or higher | 176 (77.5%) | 51 (22.5%) |
Occupancy by Age of Householder in Waynesboro
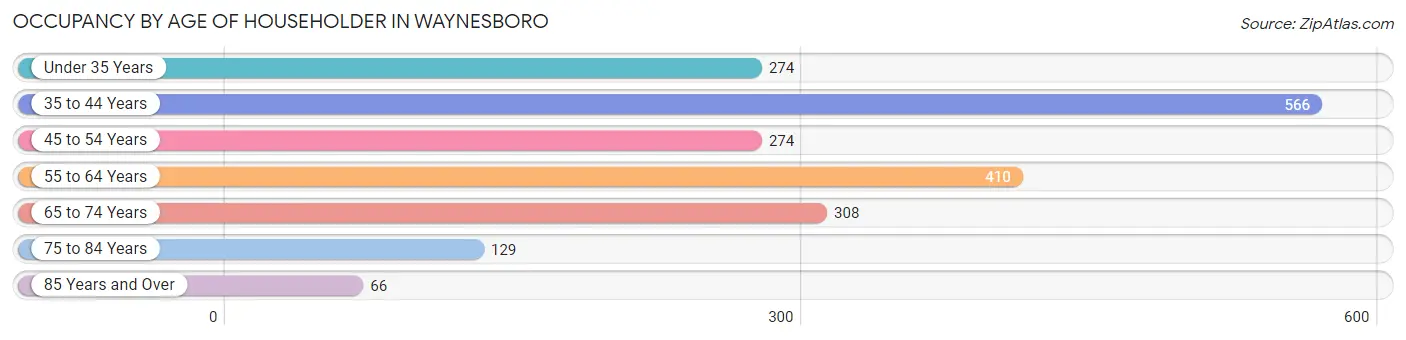
| Age Bracket | # Households | % Households |
| Under 35 Years | 274 | 13.5% |
| 35 to 44 Years | 566 | 27.9% |
| 45 to 54 Years | 274 | 13.5% |
| 55 to 64 Years | 410 | 20.2% |
| 65 to 74 Years | 308 | 15.2% |
| 75 to 84 Years | 129 | 6.4% |
| 85 Years and Over | 66 | 3.3% |
| Total | 2,027 | 100.0% |
Housing Finances in Waynesboro
Median Income by Occupancy in Waynesboro
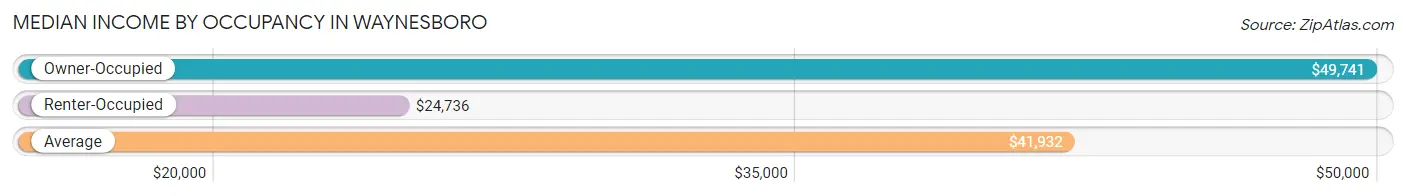
| Occupancy Type | # Households | Median Income |
| Owner-Occupied | 796 (39.3%) | $49,741 |
| Renter-Occupied | 1,231 (60.7%) | $24,736 |
| Average | 2,027 (100.0%) | $41,932 |
Occupancy by Householder Income Bracket in Waynesboro
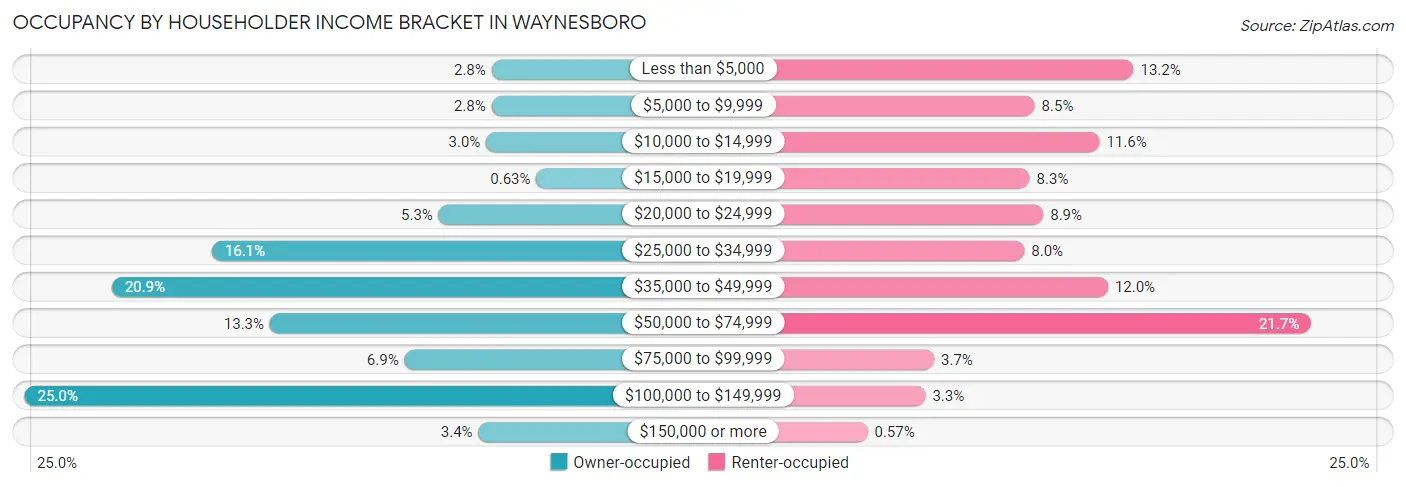
| Income Bracket | Owner-occupied | Renter-occupied |
| Less than $5,000 | 22 (2.8%) | 163 (13.2%) |
| $5,000 to $9,999 | 22 (2.8%) | 105 (8.5%) |
| $10,000 to $14,999 | 24 (3.0%) | 143 (11.6%) |
| $15,000 to $19,999 | 5 (0.6%) | 102 (8.3%) |
| $20,000 to $24,999 | 42 (5.3%) | 110 (8.9%) |
| $25,000 to $34,999 | 128 (16.1%) | 99 (8.0%) |
| $35,000 to $49,999 | 166 (20.8%) | 148 (12.0%) |
| $50,000 to $74,999 | 106 (13.3%) | 267 (21.7%) |
| $75,000 to $99,999 | 55 (6.9%) | 46 (3.7%) |
| $100,000 to $149,999 | 199 (25.0%) | 41 (3.3%) |
| $150,000 or more | 27 (3.4%) | 7 (0.6%) |
| Total | 796 (100.0%) | 1,231 (100.0%) |
Monthly Housing Cost Tiers in Waynesboro
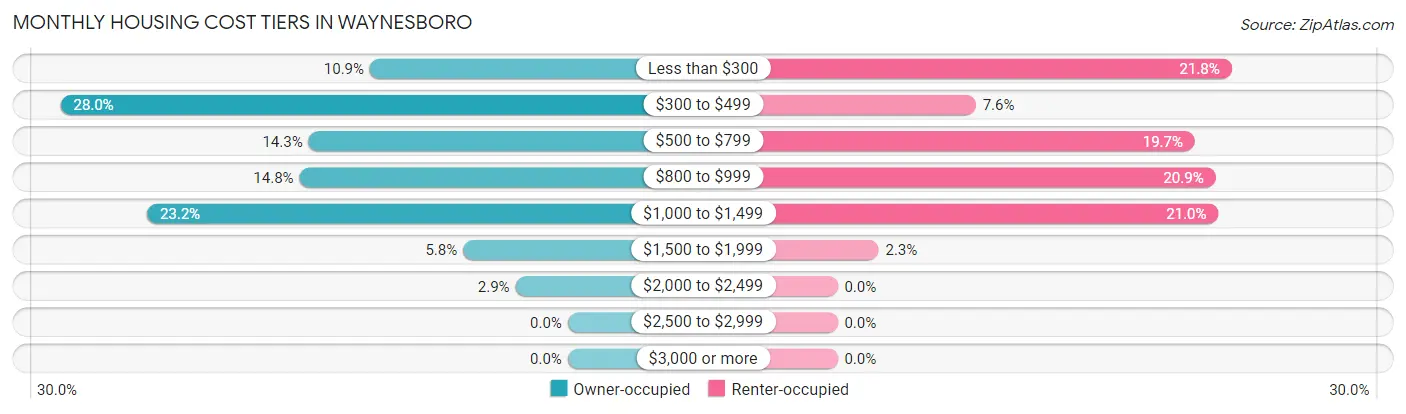
| Monthly Cost | Owner-occupied | Renter-occupied |
| Less than $300 | 87 (10.9%) | 268 (21.8%) |
| $300 to $499 | 223 (28.0%) | 94 (7.6%) |
| $500 to $799 | 114 (14.3%) | 243 (19.7%) |
| $800 to $999 | 118 (14.8%) | 257 (20.9%) |
| $1,000 to $1,499 | 185 (23.2%) | 259 (21.0%) |
| $1,500 to $1,999 | 46 (5.8%) | 28 (2.3%) |
| $2,000 to $2,499 | 23 (2.9%) | 0 (0.0%) |
| $2,500 to $2,999 | 0 (0.0%) | 0 (0.0%) |
| $3,000 or more | 0 (0.0%) | 0 (0.0%) |
| Total | 796 (100.0%) | 1,231 (100.0%) |
Physical Housing Characteristics in Waynesboro
Housing Structures in Waynesboro
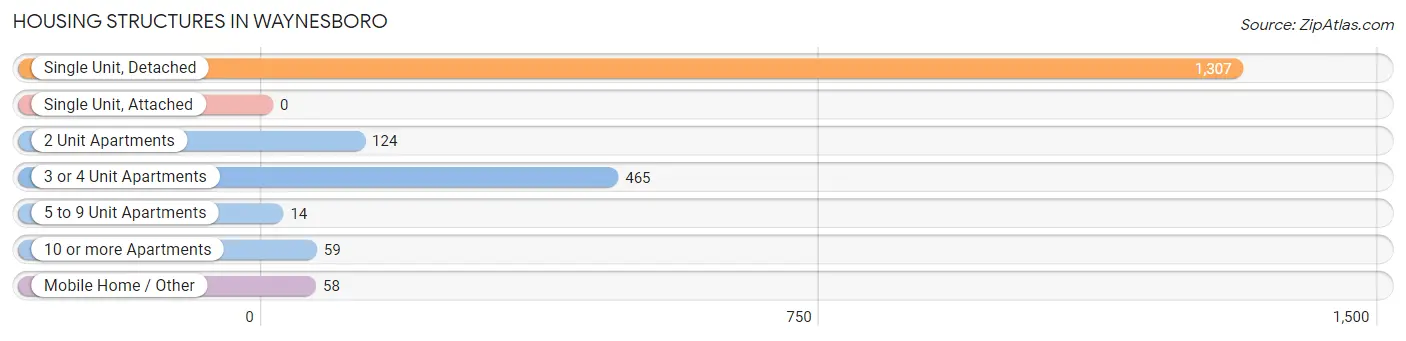
| Structure Type | # Housing Units | % Housing Units |
| Single Unit, Detached | 1,307 | 64.5% |
| Single Unit, Attached | 0 | 0.0% |
| 2 Unit Apartments | 124 | 6.1% |
| 3 or 4 Unit Apartments | 465 | 22.9% |
| 5 to 9 Unit Apartments | 14 | 0.7% |
| 10 or more Apartments | 59 | 2.9% |
| Mobile Home / Other | 58 | 2.9% |
| Total | 2,027 | 100.0% |
Housing Structures by Occupancy in Waynesboro
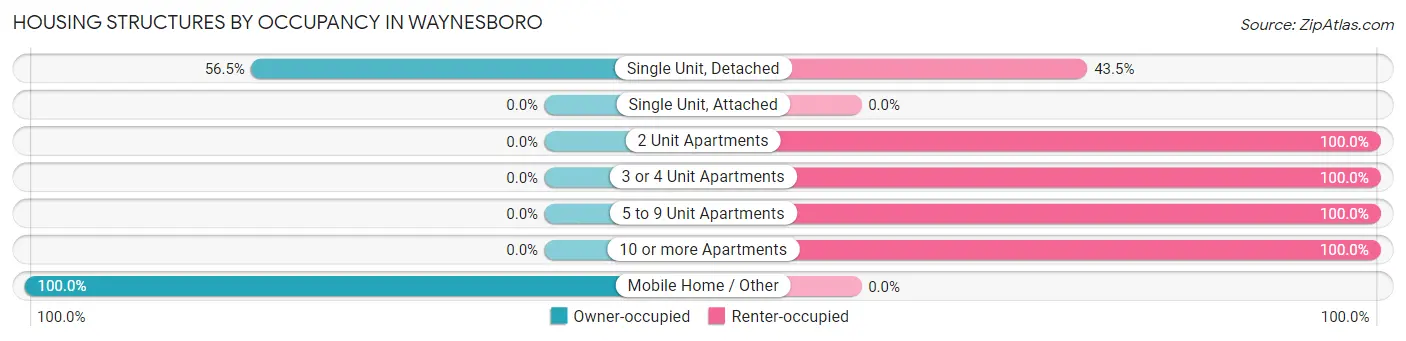
| Structure Type | Owner-occupied | Renter-occupied |
| Single Unit, Detached | 738 (56.5%) | 569 (43.5%) |
| Single Unit, Attached | 0 (0.0%) | 0 (0.0%) |
| 2 Unit Apartments | 0 (0.0%) | 124 (100.0%) |
| 3 or 4 Unit Apartments | 0 (0.0%) | 465 (100.0%) |
| 5 to 9 Unit Apartments | 0 (0.0%) | 14 (100.0%) |
| 10 or more Apartments | 0 (0.0%) | 59 (100.0%) |
| Mobile Home / Other | 58 (100.0%) | 0 (0.0%) |
| Total | 796 (39.3%) | 1,231 (60.7%) |
Housing Structures by Number of Rooms in Waynesboro
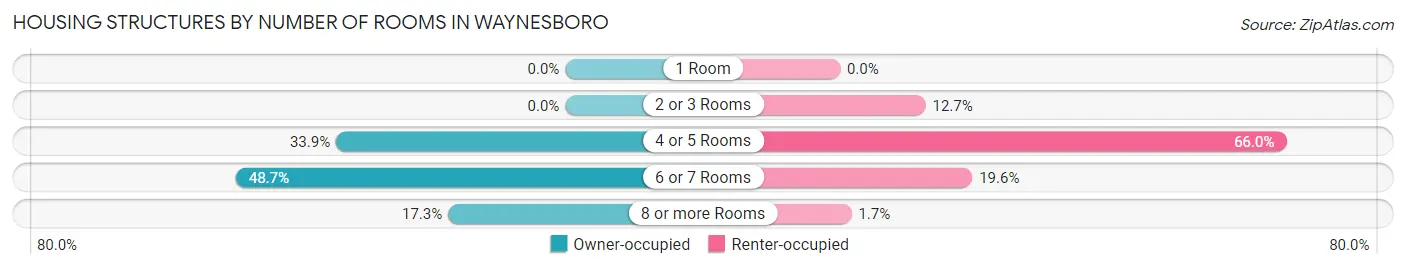
| Number of Rooms | Owner-occupied | Renter-occupied |
| 1 Room | 0 (0.0%) | 0 (0.0%) |
| 2 or 3 Rooms | 0 (0.0%) | 156 (12.7%) |
| 4 or 5 Rooms | 270 (33.9%) | 813 (66.0%) |
| 6 or 7 Rooms | 388 (48.7%) | 241 (19.6%) |
| 8 or more Rooms | 138 (17.3%) | 21 (1.7%) |
| Total | 796 (100.0%) | 1,231 (100.0%) |
Housing Structure by Heating Type in Waynesboro
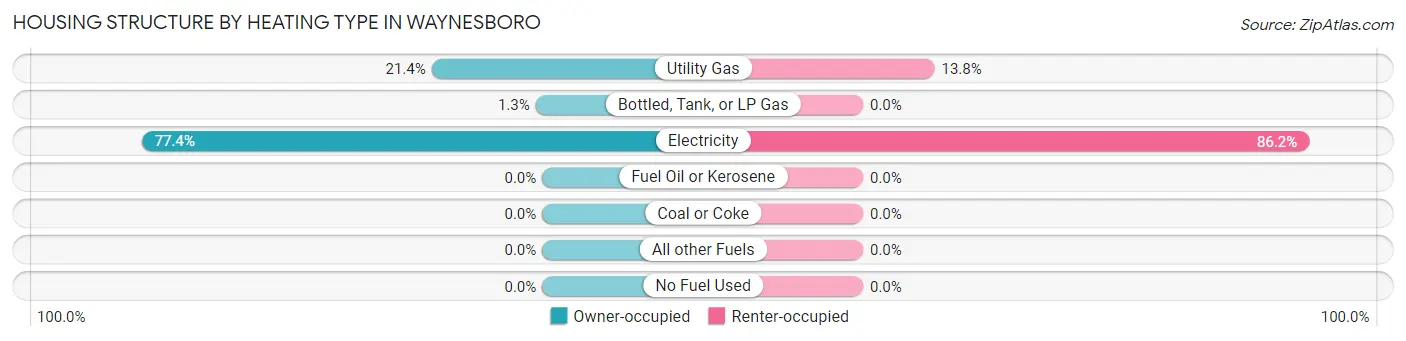
| Heating Type | Owner-occupied | Renter-occupied |
| Utility Gas | 170 (21.4%) | 170 (13.8%) |
| Bottled, Tank, or LP Gas | 10 (1.3%) | 0 (0.0%) |
| Electricity | 616 (77.4%) | 1,061 (86.2%) |
| Fuel Oil or Kerosene | 0 (0.0%) | 0 (0.0%) |
| Coal or Coke | 0 (0.0%) | 0 (0.0%) |
| All other Fuels | 0 (0.0%) | 0 (0.0%) |
| No Fuel Used | 0 (0.0%) | 0 (0.0%) |
| Total | 796 (100.0%) | 1,231 (100.0%) |
Household Vehicle Usage in Waynesboro
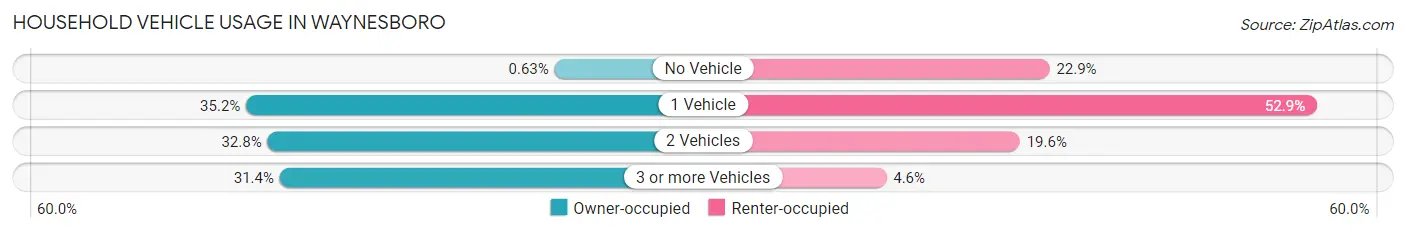
| Vehicles per Household | Owner-occupied | Renter-occupied |
| No Vehicle | 5 (0.6%) | 282 (22.9%) |
| 1 Vehicle | 280 (35.2%) | 651 (52.9%) |
| 2 Vehicles | 261 (32.8%) | 241 (19.6%) |
| 3 or more Vehicles | 250 (31.4%) | 57 (4.6%) |
| Total | 796 (100.0%) | 1,231 (100.0%) |
Real Estate & Mortgages in Waynesboro
Real Estate and Mortgage Overview in Waynesboro
| Characteristic | Without Mortgage | With Mortgage |
| Housing Units | 402 | 394 |
| Median Property Value | $83,400 | $146,400 |
| Median Household Income | $48,880 | $27 |
| Monthly Housing Costs | $434 | $0 |
| Real Estate Taxes | $841 | $10 |
Property Value by Mortgage Status in Waynesboro
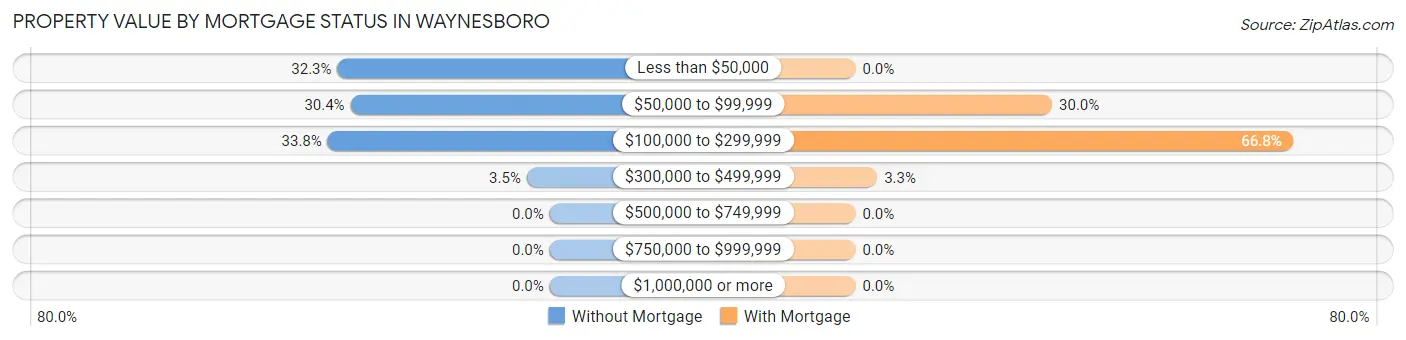
| Property Value | Without Mortgage | With Mortgage |
| Less than $50,000 | 130 (32.3%) | 0 (0.0%) |
| $50,000 to $99,999 | 122 (30.3%) | 118 (29.9%) |
| $100,000 to $299,999 | 136 (33.8%) | 263 (66.7%) |
| $300,000 to $499,999 | 14 (3.5%) | 13 (3.3%) |
| $500,000 to $749,999 | 0 (0.0%) | 0 (0.0%) |
| $750,000 to $999,999 | 0 (0.0%) | 0 (0.0%) |
| $1,000,000 or more | 0 (0.0%) | 0 (0.0%) |
| Total | 402 (100.0%) | 394 (100.0%) |
Household Income by Mortgage Status in Waynesboro
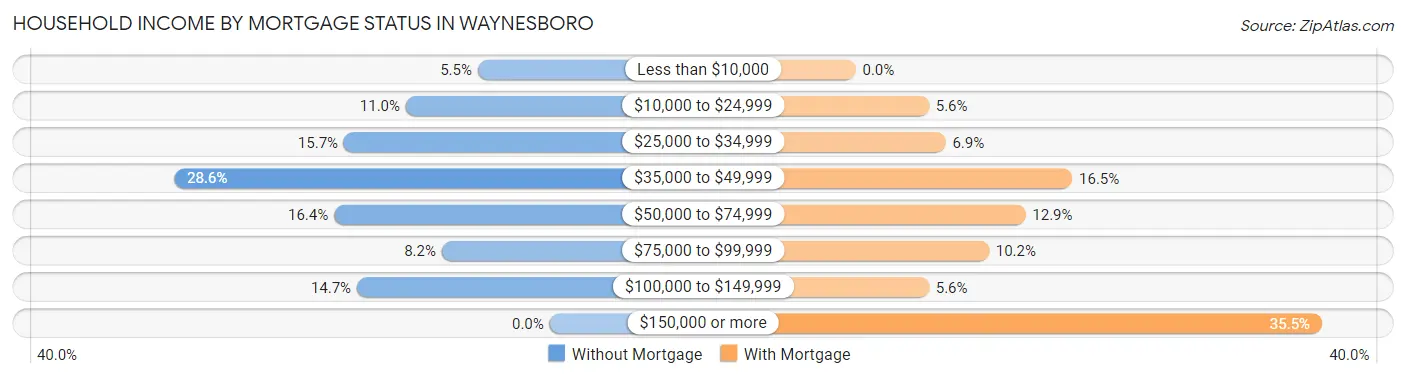
| Household Income | Without Mortgage | With Mortgage |
| Less than $10,000 | 22 (5.5%) | 0 (0.0%) |
| $10,000 to $24,999 | 44 (11.0%) | 22 (5.6%) |
| $25,000 to $34,999 | 63 (15.7%) | 27 (6.9%) |
| $35,000 to $49,999 | 115 (28.6%) | 65 (16.5%) |
| $50,000 to $74,999 | 66 (16.4%) | 51 (12.9%) |
| $75,000 to $99,999 | 33 (8.2%) | 40 (10.2%) |
| $100,000 to $149,999 | 59 (14.7%) | 22 (5.6%) |
| $150,000 or more | 0 (0.0%) | 140 (35.5%) |
| Total | 402 (100.0%) | 394 (100.0%) |
Property Value to Household Income Ratio in Waynesboro
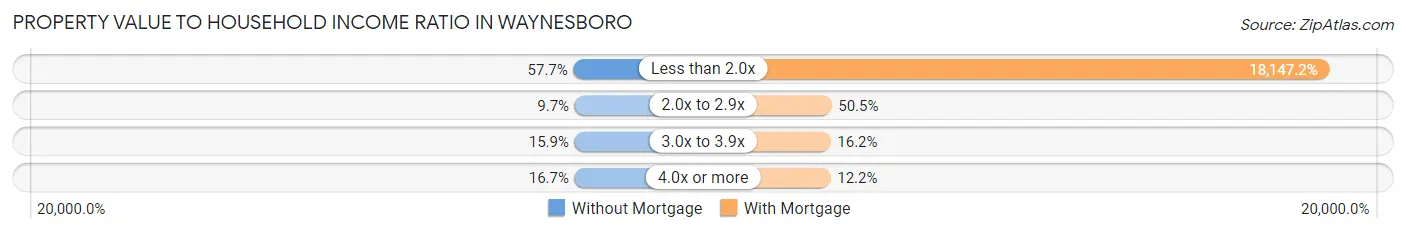
| Value-to-Income Ratio | Without Mortgage | With Mortgage |
| Less than 2.0x | 232 (57.7%) | 71,500 (18,147.2%) |
| 2.0x to 2.9x | 39 (9.7%) | 199 (50.5%) |
| 3.0x to 3.9x | 64 (15.9%) | 64 (16.2%) |
| 4.0x or more | 67 (16.7%) | 48 (12.2%) |
| Total | 402 (100.0%) | 394 (100.0%) |
Real Estate Taxes by Mortgage Status in Waynesboro
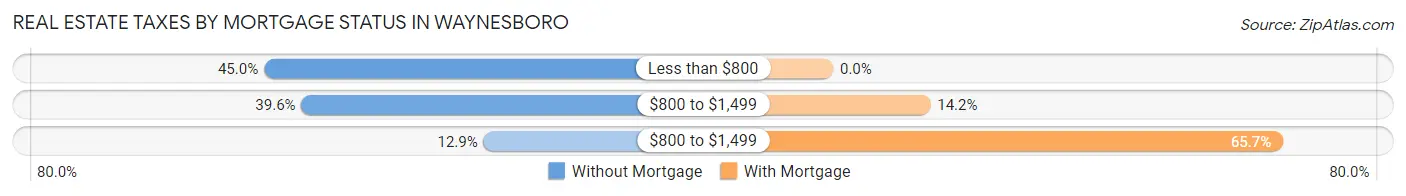
| Property Taxes | Without Mortgage | With Mortgage |
| Less than $800 | 181 (45.0%) | 0 (0.0%) |
| $800 to $1,499 | 159 (39.6%) | 56 (14.2%) |
| $800 to $1,499 | 52 (12.9%) | 259 (65.7%) |
| Total | 402 (100.0%) | 394 (100.0%) |
Health & Disability in Waynesboro
Health Insurance Coverage by Age in Waynesboro
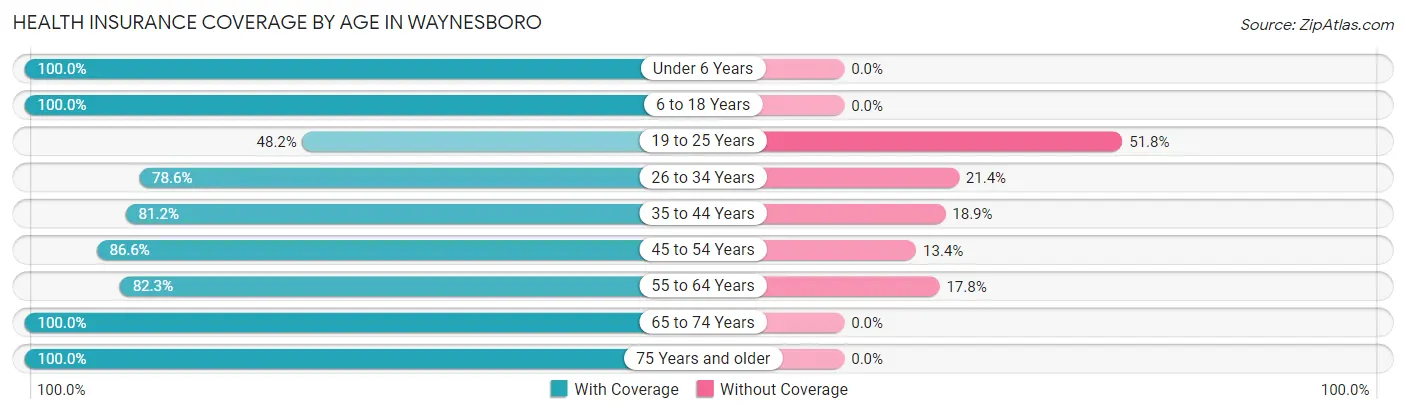
| Age Bracket | With Coverage | Without Coverage |
| Under 6 Years | 642 (100.0%) | 0 (0.0%) |
| 6 to 18 Years | 1,306 (100.0%) | 0 (0.0%) |
| 19 to 25 Years | 341 (48.2%) | 367 (51.8%) |
| 26 to 34 Years | 298 (78.6%) | 81 (21.4%) |
| 35 to 44 Years | 762 (81.1%) | 177 (18.9%) |
| 45 to 54 Years | 433 (86.6%) | 67 (13.4%) |
| 55 to 64 Years | 417 (82.3%) | 90 (17.7%) |
| 65 to 74 Years | 393 (100.0%) | 0 (0.0%) |
| 75 Years and older | 260 (100.0%) | 0 (0.0%) |
| Total | 4,852 (86.1%) | 782 (13.9%) |
Health Insurance Coverage by Citizenship Status in Waynesboro
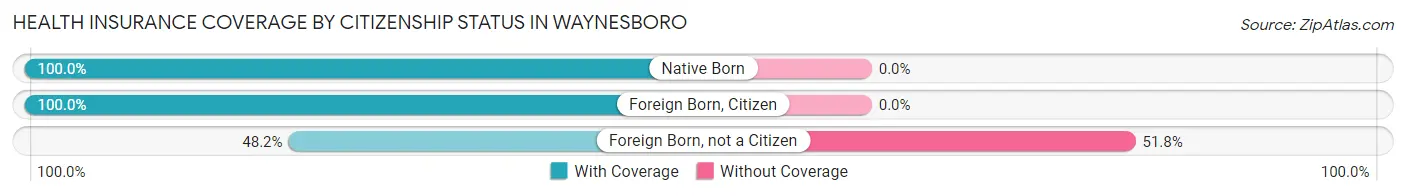
| Citizenship Status | With Coverage | Without Coverage |
| Native Born | 642 (100.0%) | 0 (0.0%) |
| Foreign Born, Citizen | 1,306 (100.0%) | 0 (0.0%) |
| Foreign Born, not a Citizen | 341 (48.2%) | 367 (51.8%) |
Health Insurance Coverage by Household Income in Waynesboro
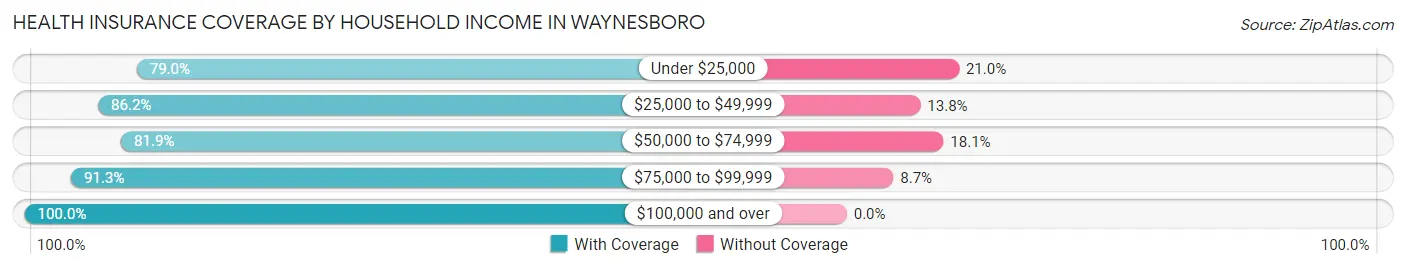
| Household Income | With Coverage | Without Coverage |
| Under $25,000 | 1,191 (79.0%) | 317 (21.0%) |
| $25,000 to $49,999 | 1,500 (86.2%) | 240 (13.8%) |
| $50,000 to $74,999 | 932 (81.9%) | 206 (18.1%) |
| $75,000 to $99,999 | 199 (91.3%) | 19 (8.7%) |
| $100,000 and over | 1,030 (100.0%) | 0 (0.0%) |
Public vs Private Health Insurance Coverage by Age in Waynesboro
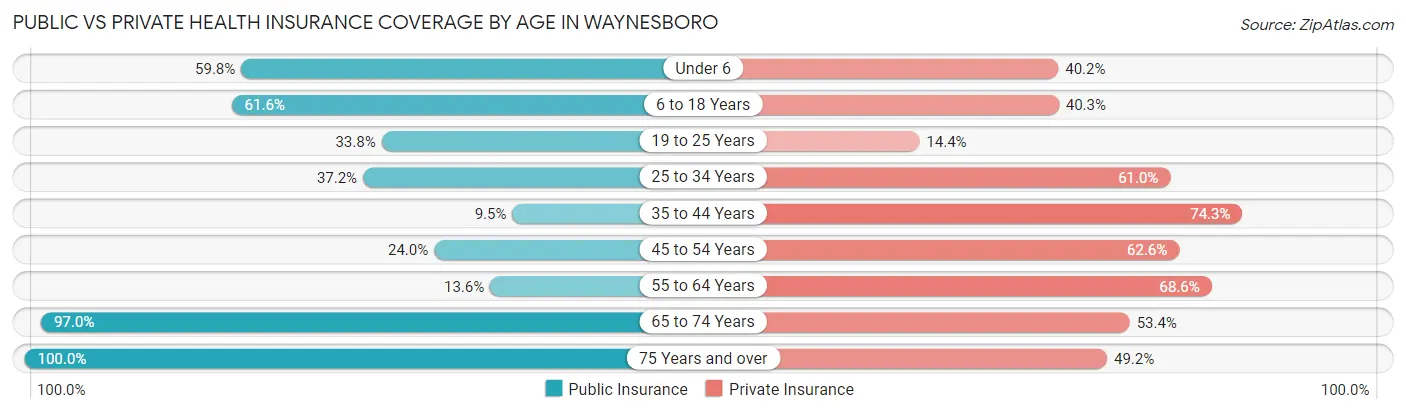
| Age Bracket | Public Insurance | Private Insurance |
| Under 6 | 384 (59.8%) | 258 (40.2%) |
| 6 to 18 Years | 804 (61.6%) | 526 (40.3%) |
| 19 to 25 Years | 239 (33.8%) | 102 (14.4%) |
| 25 to 34 Years | 141 (37.2%) | 231 (61.0%) |
| 35 to 44 Years | 89 (9.5%) | 698 (74.3%) |
| 45 to 54 Years | 120 (24.0%) | 313 (62.6%) |
| 55 to 64 Years | 69 (13.6%) | 348 (68.6%) |
| 65 to 74 Years | 381 (97.0%) | 210 (53.4%) |
| 75 Years and over | 260 (100.0%) | 128 (49.2%) |
| Total | 2,487 (44.1%) | 2,814 (49.9%) |
Disability Status by Sex by Age in Waynesboro
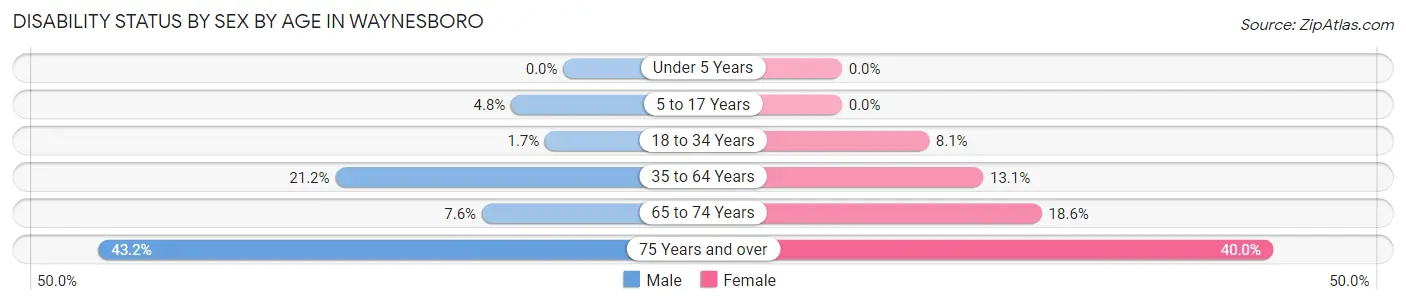
| Age Bracket | Male | Female |
| Under 5 Years | 0 (0.0%) | 0 (0.0%) |
| 5 to 17 Years | 31 (4.8%) | 0 (0.0%) |
| 18 to 34 Years | 10 (1.7%) | 46 (8.1%) |
| 35 to 64 Years | 139 (21.2%) | 169 (13.1%) |
| 65 to 74 Years | 13 (7.6%) | 41 (18.5%) |
| 75 Years and over | 41 (43.2%) | 66 (40.0%) |
Disability Class by Sex by Age in Waynesboro
Disability Class: Hearing Difficulty
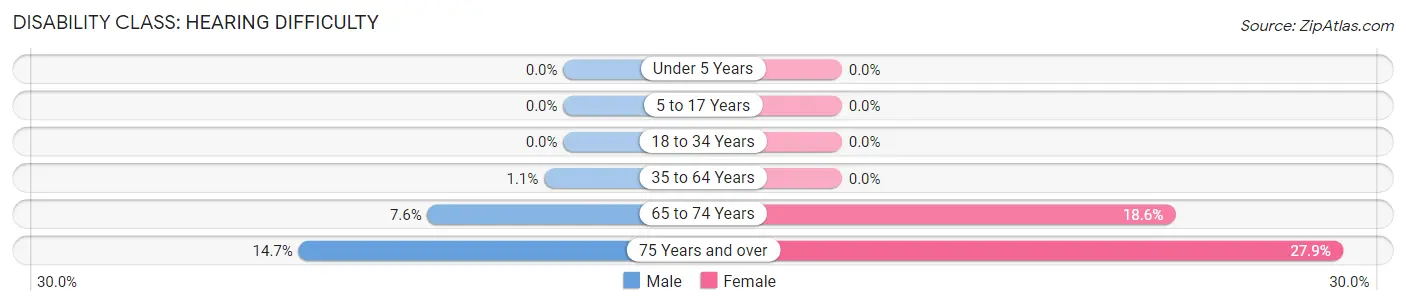
| Age Bracket | Male | Female |
| Under 5 Years | 0 (0.0%) | 0 (0.0%) |
| 5 to 17 Years | 0 (0.0%) | 0 (0.0%) |
| 18 to 34 Years | 0 (0.0%) | 0 (0.0%) |
| 35 to 64 Years | 7 (1.1%) | 0 (0.0%) |
| 65 to 74 Years | 13 (7.6%) | 41 (18.5%) |
| 75 Years and over | 14 (14.7%) | 46 (27.9%) |
Disability Class: Vision Difficulty
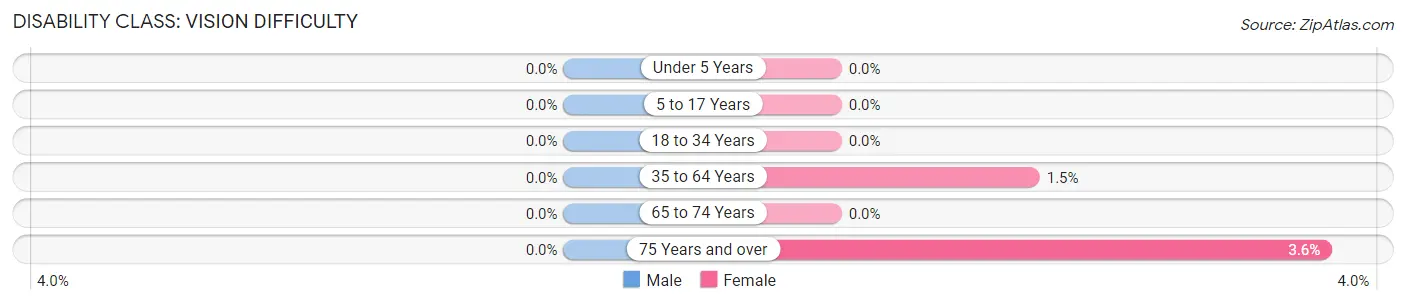
| Age Bracket | Male | Female |
| Under 5 Years | 0 (0.0%) | 0 (0.0%) |
| 5 to 17 Years | 0 (0.0%) | 0 (0.0%) |
| 18 to 34 Years | 0 (0.0%) | 0 (0.0%) |
| 35 to 64 Years | 0 (0.0%) | 19 (1.5%) |
| 65 to 74 Years | 0 (0.0%) | 0 (0.0%) |
| 75 Years and over | 0 (0.0%) | 6 (3.6%) |
Disability Class: Cognitive Difficulty
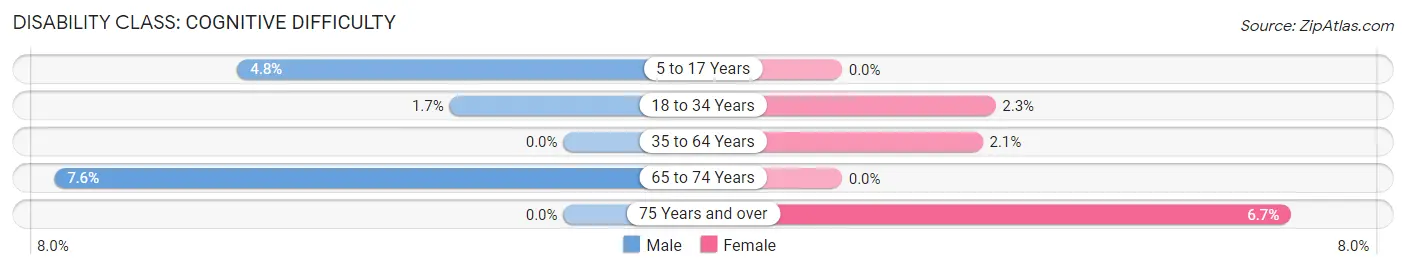
| Age Bracket | Male | Female |
| 5 to 17 Years | 31 (4.8%) | 0 (0.0%) |
| 18 to 34 Years | 10 (1.7%) | 13 (2.3%) |
| 35 to 64 Years | 0 (0.0%) | 27 (2.1%) |
| 65 to 74 Years | 13 (7.6%) | 0 (0.0%) |
| 75 Years and over | 0 (0.0%) | 11 (6.7%) |
Disability Class: Ambulatory Difficulty
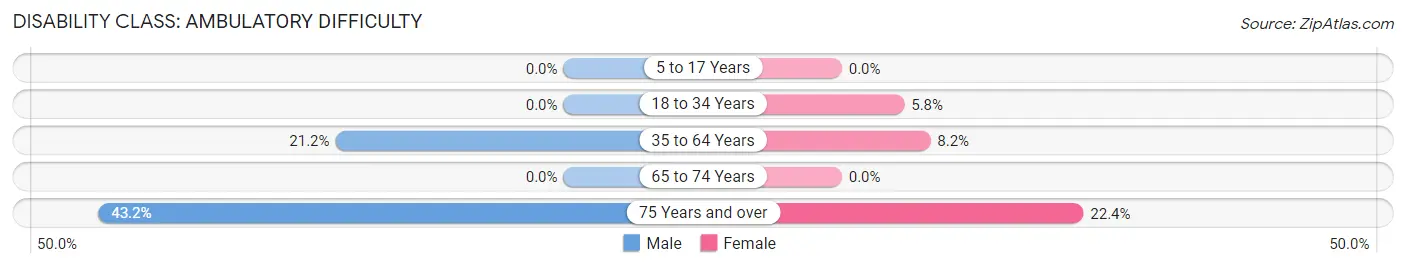
| Age Bracket | Male | Female |
| 5 to 17 Years | 0 (0.0%) | 0 (0.0%) |
| 18 to 34 Years | 0 (0.0%) | 33 (5.8%) |
| 35 to 64 Years | 139 (21.2%) | 106 (8.2%) |
| 65 to 74 Years | 0 (0.0%) | 0 (0.0%) |
| 75 Years and over | 41 (43.2%) | 37 (22.4%) |
Disability Class: Self-Care Difficulty
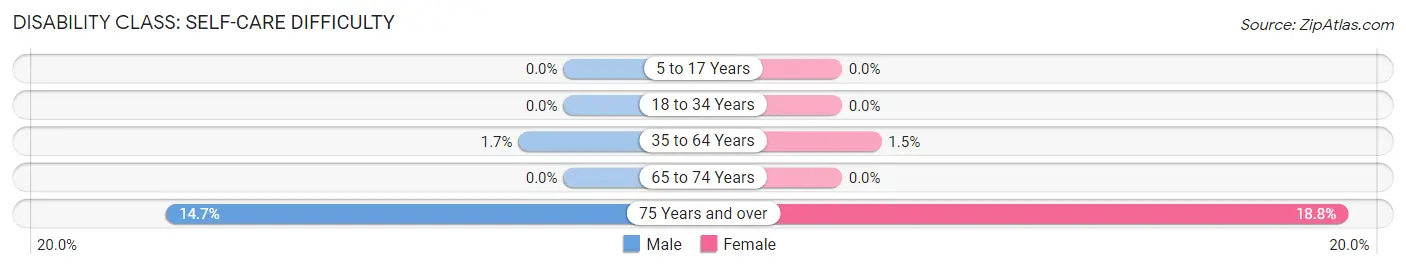
| Age Bracket | Male | Female |
| 5 to 17 Years | 0 (0.0%) | 0 (0.0%) |
| 18 to 34 Years | 0 (0.0%) | 0 (0.0%) |
| 35 to 64 Years | 11 (1.7%) | 19 (1.5%) |
| 65 to 74 Years | 0 (0.0%) | 0 (0.0%) |
| 75 Years and over | 14 (14.7%) | 31 (18.8%) |
Technology Access in Waynesboro
Computing Device Access in Waynesboro
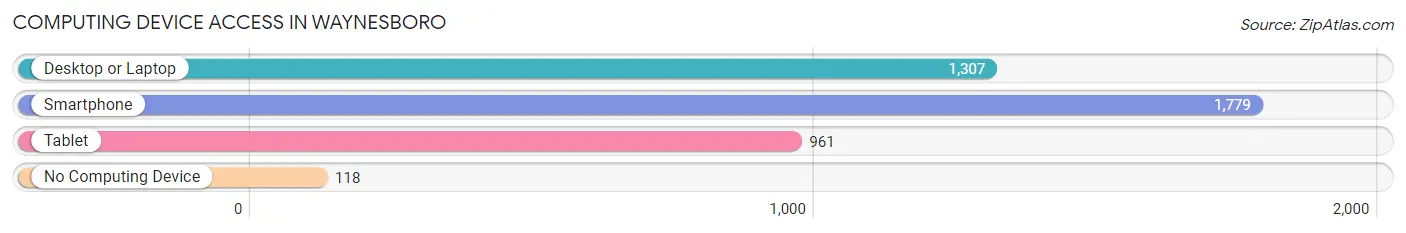
| Device Type | # Households | % Households |
| Desktop or Laptop | 1,307 | 64.5% |
| Smartphone | 1,779 | 87.8% |
| Tablet | 961 | 47.4% |
| No Computing Device | 118 | 5.8% |
| Total | 2,027 | 100.0% |
Internet Access in Waynesboro
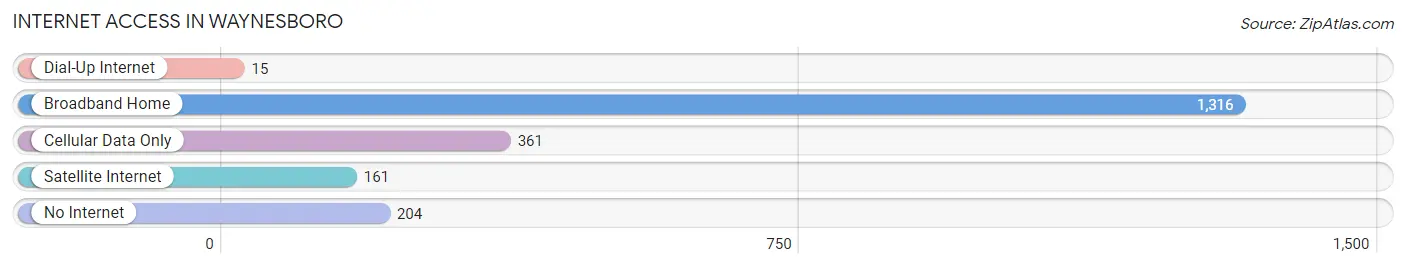
| Internet Type | # Households | % Households |
| Dial-Up Internet | 15 | 0.7% |
| Broadband Home | 1,316 | 64.9% |
| Cellular Data Only | 361 | 17.8% |
| Satellite Internet | 161 | 7.9% |
| No Internet | 204 | 10.1% |
| Total | 2,027 | 100.0% |
Waynesboro Summary
Waynesboro, Georgia is a small city located in Burke County, Georgia. It is the county seat of Burke County and is located about 30 miles south of Augusta. The city has a population of 5,719 people, according to the 2010 census.
History
Waynesboro was founded in 1783 by James Wayne, a Revolutionary War hero. The city was named after him and was incorporated in 1883. The city was originally a trading post and was a major stop on the stagecoach route between Augusta and Savannah. During the Civil War, Waynesboro was a major supply center for the Confederate Army. After the war, the city became a major center for cotton production and processing.
Geography
Waynesboro is located in the Piedmont region of Georgia. The city is situated on the Ogeechee River and is surrounded by rolling hills and forests. The city has a total area of 8.2 square miles, of which 8.1 square miles is land and 0.1 square miles is water.
Economy
Waynesboro’s economy is largely based on agriculture and manufacturing. The city is home to several large manufacturing plants, including a paper mill, a textile mill, and a furniture factory. The city also has a thriving agricultural sector, with crops such as cotton, corn, soybeans, and peanuts being grown in the area.
Demographics
According to the 2010 census, the population of Waynesboro was 5,719. The racial makeup of the city was 57.3% African American, 37.2% White, 0.3% Native American, 0.2% Asian, 0.1% Pacific Islander, and 4.9% from other races. The median household income was $25,945 and the median family income was $31,944.
Conclusion
Waynesboro, Georgia is a small city located in Burke County, Georgia. It is the county seat of Burke County and is located about 30 miles south of Augusta. The city has a population of 5,719 people, according to the 2010 census. Waynesboro was founded in 1783 by James Wayne, a Revolutionary War hero. The city was originally a trading post and was a major stop on the stagecoach route between Augusta and Savannah. The city’s economy is largely based on agriculture and manufacturing. The racial makeup of the city was 57.3% African American, 37.2% White, 0.3% Native American, 0.2% Asian, 0.1% Pacific Islander, and 4.9% from other races. The median household income was $25,945 and the median family income was $31,944.
Common Questions
What is Per Capita Income in Waynesboro?
Per Capita income in Waynesboro is $18,132.
What is the Median Family Income in Waynesboro?
Median Family Income in Waynesboro is $42,661.
What is the Median Household income in Waynesboro?
Median Household Income in Waynesboro is $41,932.
What is Income or Wage Gap in Waynesboro?
Income or Wage Gap in Waynesboro is 31.2%.
Women in Waynesboro earn 68.8 cents for every dollar earned by a man.
What is Inequality or Gini Index in Waynesboro?
Inequality or Gini Index in Waynesboro is 0.44.
What is the Total Population of Waynesboro?
Total Population of Waynesboro is 5,720.
What is the Total Male Population of Waynesboro?
Total Male Population of Waynesboro is 2,614.
What is the Total Female Population of Waynesboro?
Total Female Population of Waynesboro is 3,106.
What is the Ratio of Males per 100 Females in Waynesboro?
There are 84.16 Males per 100 Females in Waynesboro.
What is the Ratio of Females per 100 Males in Waynesboro?
There are 118.82 Females per 100 Males in Waynesboro.
What is the Median Population Age in Waynesboro?
Median Population Age in Waynesboro is 30.0 Years.
What is the Average Family Size in Waynesboro
Average Family Size in Waynesboro is 3.6 People.
What is the Average Household Size in Waynesboro
Average Household Size in Waynesboro is 2.8 People.
How Large is the Labor Force in Waynesboro?
There are 2,682 People in the Labor Forcein in Waynesboro.
What is the Percentage of People in the Labor Force in Waynesboro?
65.5% of People are in the Labor Force in Waynesboro.
What is the Unemployment Rate in Waynesboro?
Unemployment Rate in Waynesboro is 4.8%.