Donalsonville, GA Map & Demographics
Donalsonville Map
Donalsonville Overview
$21,557
PER CAPITA INCOME
$42,875
AVG FAMILY INCOME
$37,433
AVG HOUSEHOLD INCOME
16.9%
WAGE / INCOME GAP [ % ]
83.1¢/ $1
WAGE / INCOME GAP [ $ ]
0.47
INEQUALITY / GINI INDEX
2,824
TOTAL POPULATION
1,387
MALE POPULATION
1,437
FEMALE POPULATION
96.52
MALES / 100 FEMALES
103.60
FEMALES / 100 MALES
35.8
MEDIAN AGE
3.0
AVG FAMILY SIZE
2.6
AVG HOUSEHOLD SIZE
1,125
LABOR FORCE [ PEOPLE ]
52.7%
PERCENT IN LABOR FORCE
6.0%
UNEMPLOYMENT RATE
Donalsonville Zip Codes
Donalsonville Area Codes
Income in Donalsonville
Income Overview in Donalsonville
Per Capita Income in Donalsonville is $21,557, while median incomes of families and households are $42,875 and $37,433 respectively.
| Characteristic | Number | Measure |
| Per Capita Income | 2,824 | $21,557 |
| Median Family Income | 758 | $42,875 |
| Mean Family Income | 758 | $63,764 |
| Median Household Income | 1,040 | $37,433 |
| Mean Household Income | 1,040 | $55,366 |
| Income Deficit | 758 | $0 |
| Wage / Income Gap (%) | 2,824 | 16.85% |
| Wage / Income Gap ($) | 2,824 | 83.15¢ per $1 |
| Gini / Inequality Index | 2,824 | 0.47 |
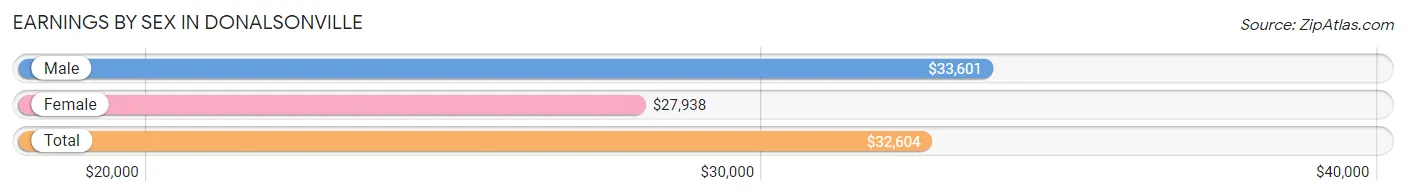
Earnings by Sex in Donalsonville
Average Earnings in Donalsonville are $32,604, $33,601 for men and $27,938 for women, a difference of 16.9%.
| Sex | Number | Average Earnings |
| Male | 603 (53.3%) | $33,601 |
| Female | 529 (46.7%) | $27,938 |
| Total | 1,132 (100.0%) | $32,604 |
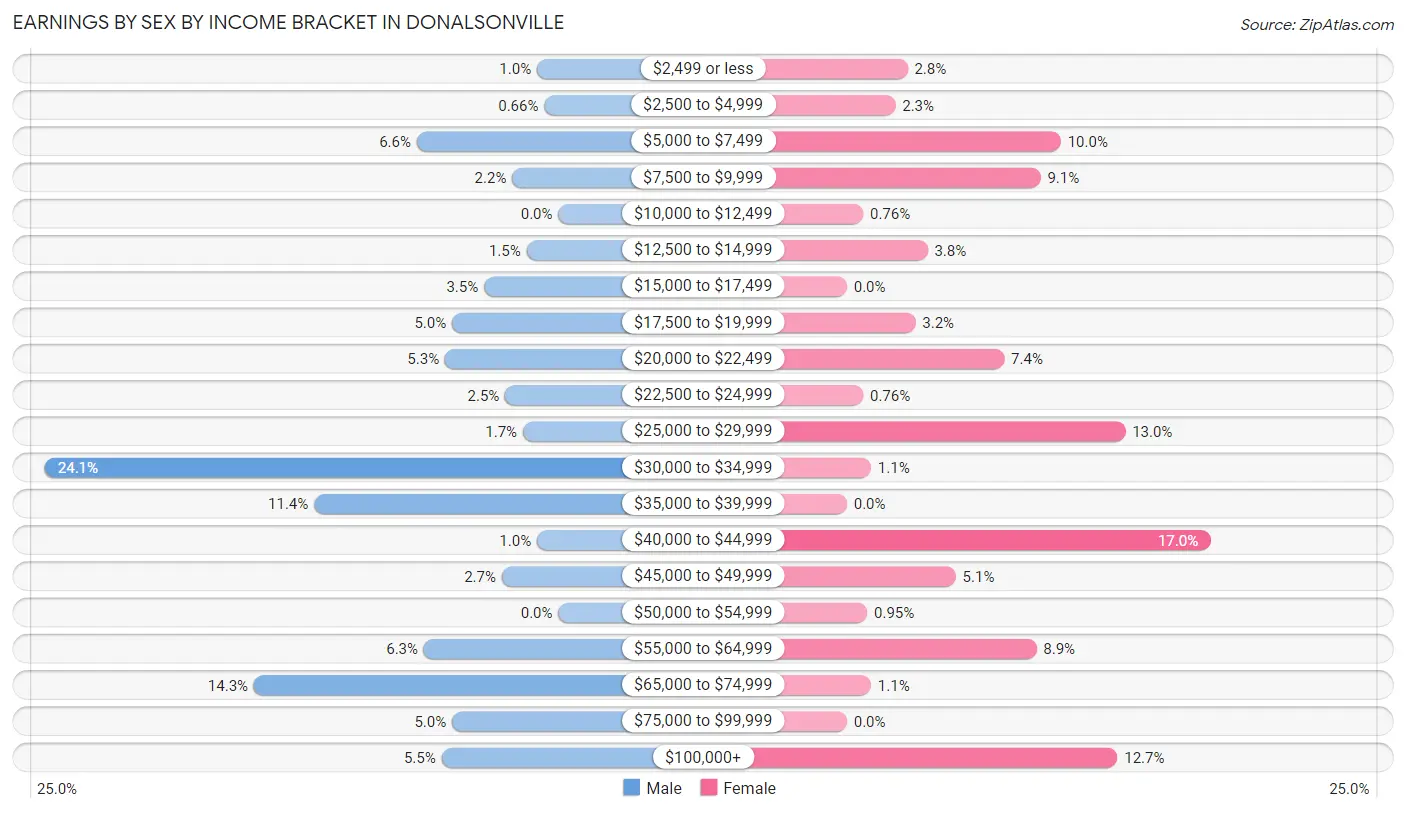
Earnings by Sex by Income Bracket in Donalsonville
The most common earnings brackets in Donalsonville are $30,000 to $34,999 for men (145 | 24.0%) and $40,000 to $44,999 for women (90 | 17.0%).
| Income | Male | Female |
| $2,499 or less | 6 (1.0%) | 15 (2.8%) |
| $2,500 to $4,999 | 4 (0.7%) | 12 (2.3%) |
| $5,000 to $7,499 | 40 (6.6%) | 53 (10.0%) |
| $7,500 to $9,999 | 13 (2.2%) | 48 (9.1%) |
| $10,000 to $12,499 | 0 (0.0%) | 4 (0.8%) |
| $12,500 to $14,999 | 9 (1.5%) | 20 (3.8%) |
| $15,000 to $17,499 | 21 (3.5%) | 0 (0.0%) |
| $17,500 to $19,999 | 30 (5.0%) | 17 (3.2%) |
| $20,000 to $22,499 | 32 (5.3%) | 39 (7.4%) |
| $22,500 to $24,999 | 15 (2.5%) | 4 (0.8%) |
| $25,000 to $29,999 | 10 (1.7%) | 69 (13.0%) |
| $30,000 to $34,999 | 145 (24.0%) | 6 (1.1%) |
| $35,000 to $39,999 | 69 (11.4%) | 0 (0.0%) |
| $40,000 to $44,999 | 6 (1.0%) | 90 (17.0%) |
| $45,000 to $49,999 | 16 (2.6%) | 27 (5.1%) |
| $50,000 to $54,999 | 0 (0.0%) | 5 (0.9%) |
| $55,000 to $64,999 | 38 (6.3%) | 47 (8.9%) |
| $65,000 to $74,999 | 86 (14.3%) | 6 (1.1%) |
| $75,000 to $99,999 | 30 (5.0%) | 0 (0.0%) |
| $100,000+ | 33 (5.5%) | 67 (12.7%) |
| Total | 603 (100.0%) | 529 (100.0%) |
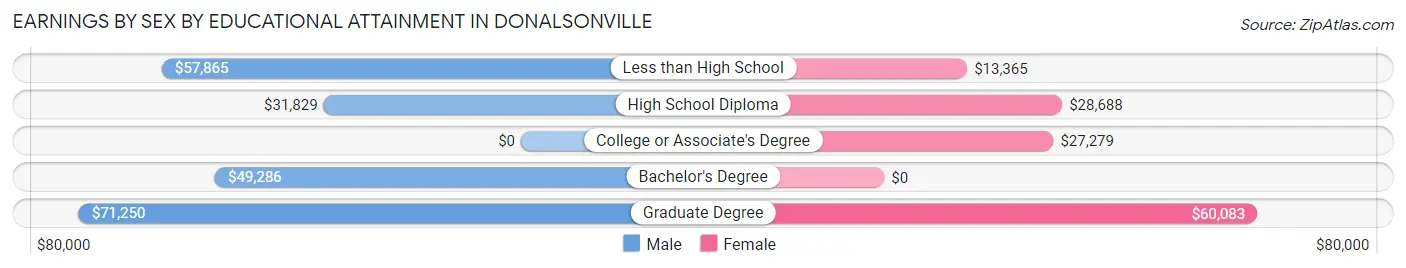
Earnings by Sex by Educational Attainment in Donalsonville
Average earnings in Donalsonville are $35,980 for men and $29,563 for women, a difference of 17.8%. Men with an educational attainment of graduate degree enjoy the highest average annual earnings of $71,250, while those with high school diploma education earn the least with $31,829. Women with an educational attainment of graduate degree earn the most with the average annual earnings of $60,083, while those with less than high school education have the smallest earnings of $13,365.
| Educational Attainment | Male Income | Female Income |
| Less than High School | $57,865 | $13,365 |
| High School Diploma | $31,829 | $28,688 |
| College or Associate's Degree | - | - |
| Bachelor's Degree | $49,286 | $0 |
| Graduate Degree | $71,250 | $60,083 |
| Total | $35,980 | $29,563 |
Family Income in Donalsonville
Family Income Brackets in Donalsonville
According to the Donalsonville family income data, there are 156 families falling into the $100,000 to $149,999 income range, which is the most common income bracket and makes up 20.6% of all families. Conversely, the $200,000+ income bracket is the least frequent group with only 9 families (1.2%) belonging to this category.
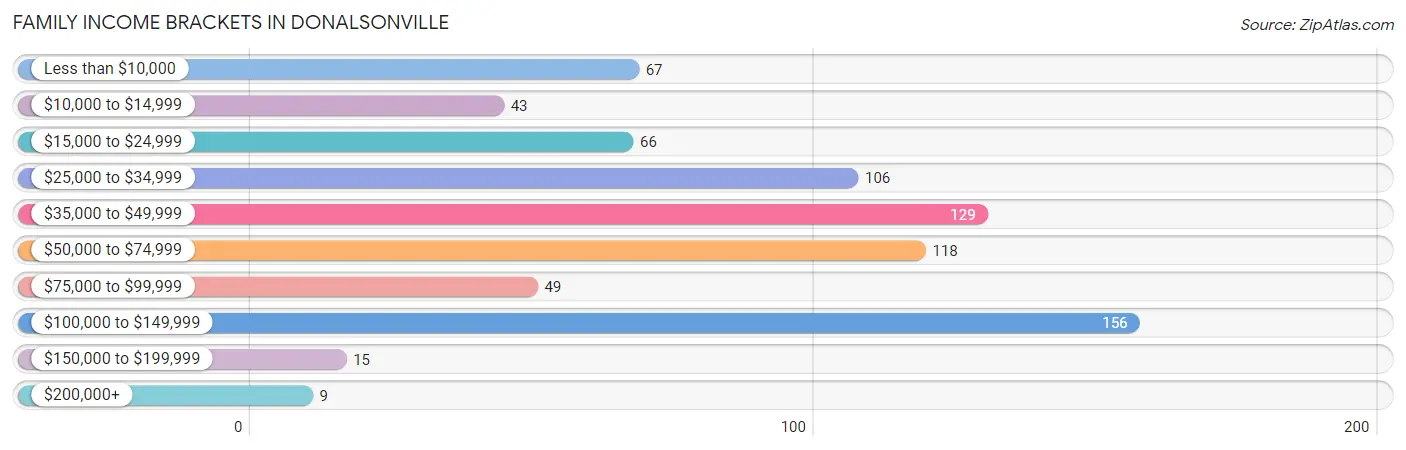
| Income Bracket | # Families | % Families |
| Less than $10,000 | 67 | 8.8% |
| $10,000 to $14,999 | 43 | 5.7% |
| $15,000 to $24,999 | 66 | 8.7% |
| $25,000 to $34,999 | 106 | 14.0% |
| $35,000 to $49,999 | 129 | 17.0% |
| $50,000 to $74,999 | 118 | 15.6% |
| $75,000 to $99,999 | 49 | 6.5% |
| $100,000 to $149,999 | 156 | 20.6% |
| $150,000 to $199,999 | 15 | 2.0% |
| $200,000+ | 9 | 1.2% |
Family Income by Famaliy Size in Donalsonville
5-person families (42 | 5.5%) account for the highest median family income in Donalsonville with $135,385 per family, while 5-person families (42 | 5.5%) have the highest median income of $27,077 per family member.
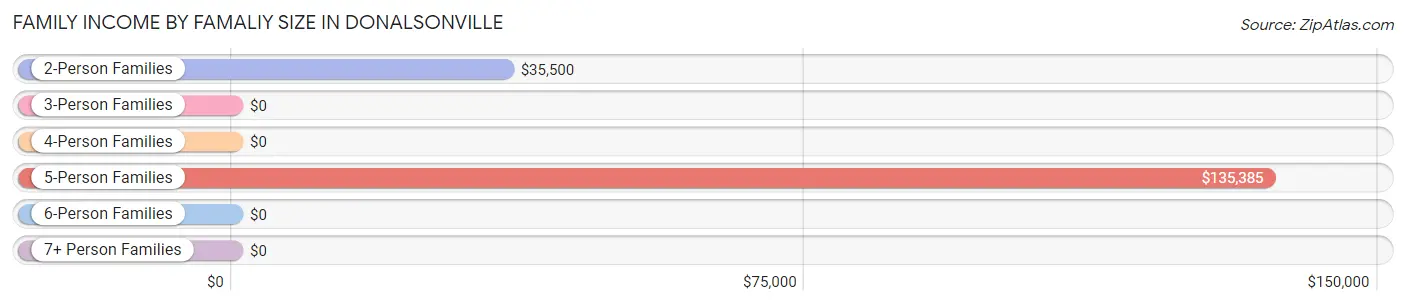
| Income Bracket | # Families | Median Income |
| 2-Person Families | 406 (53.6%) | $35,500 |
| 3-Person Families | 186 (24.5%) | $0 |
| 4-Person Families | 121 (16.0%) | $0 |
| 5-Person Families | 42 (5.5%) | $135,385 |
| 6-Person Families | 0 (0.0%) | $0 |
| 7+ Person Families | 3 (0.4%) | $0 |
| Total | 758 (100.0%) | $42,875 |
Family Income by Number of Earners in Donalsonville
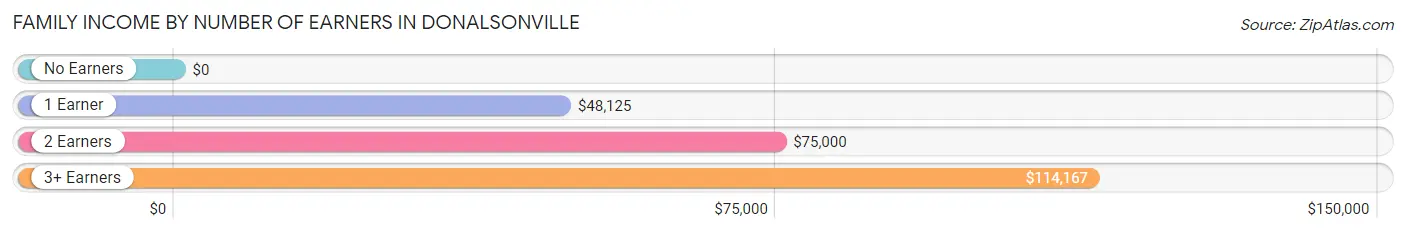
| Number of Earners | # Families | Median Income |
| No Earners | 156 (20.6%) | $0 |
| 1 Earner | 414 (54.6%) | $48,125 |
| 2 Earners | 158 (20.8%) | $75,000 |
| 3+ Earners | 30 (4.0%) | $114,167 |
| Total | 758 (100.0%) | $42,875 |
Household Income in Donalsonville
Household Income Brackets in Donalsonville
With 180 households falling in the category, the $35,000 to $49,999 income range is the most frequent in Donalsonville, accounting for 17.3% of all households. In contrast, only 9 households (0.9%) fall into the $200,000+ income bracket, making it the least populous group.
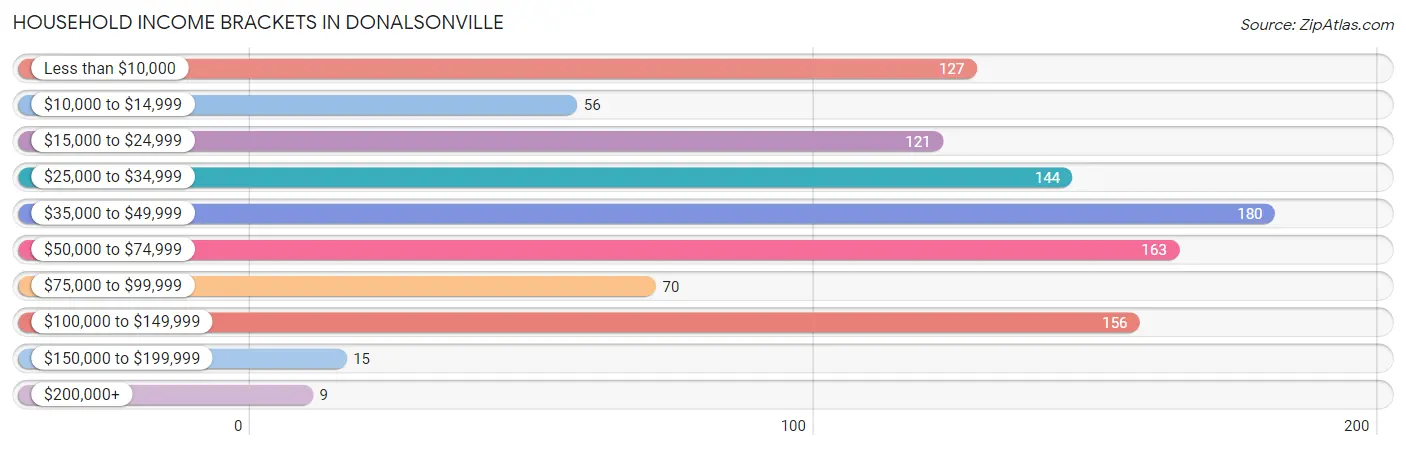
| Income Bracket | # Households | % Households |
| Less than $10,000 | 127 | 12.2% |
| $10,000 to $14,999 | 56 | 5.4% |
| $15,000 to $24,999 | 121 | 11.6% |
| $25,000 to $34,999 | 144 | 13.8% |
| $35,000 to $49,999 | 180 | 17.3% |
| $50,000 to $74,999 | 163 | 15.7% |
| $75,000 to $99,999 | 70 | 6.7% |
| $100,000 to $149,999 | 156 | 15.0% |
| $150,000 to $199,999 | 15 | 1.4% |
| $200,000+ | 9 | 0.9% |
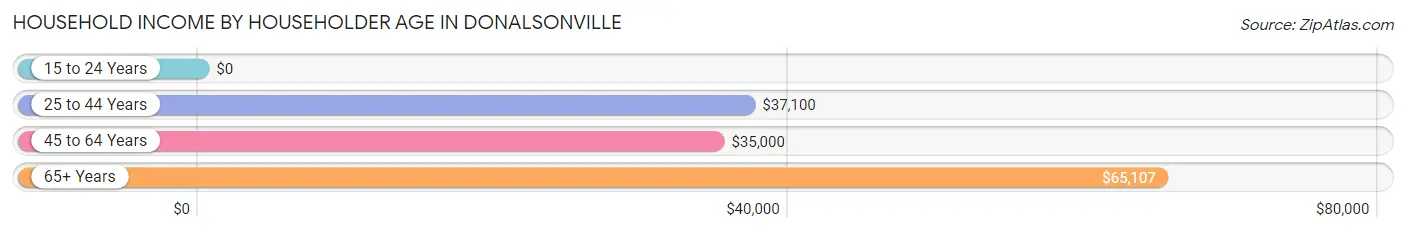
Household Income by Householder Age in Donalsonville
The median household income in Donalsonville is $37,433, with the highest median household income of $65,107 found in the 65+ years age bracket for the primary householder. A total of 271 households (26.1%) fall into this category. Meanwhile, the 15 to 24 years age bracket for the primary householder has the lowest median household income of $0, with 21 households (2.0%) in this group.
| Income Bracket | # Households | Median Income |
| 15 to 24 Years | 21 (2.0%) | $0 |
| 25 to 44 Years | 398 (38.3%) | $37,100 |
| 45 to 64 Years | 350 (33.7%) | $35,000 |
| 65+ Years | 271 (26.1%) | $65,107 |
| Total | 1,040 (100.0%) | $37,433 |
Poverty in Donalsonville
Income Below Poverty by Sex and Age in Donalsonville
With 12.8% poverty level for males and 27.4% for females among the residents of Donalsonville, 16 and 17 year old males and 18 to 24 year old females are the most vulnerable to poverty, with 25 males (80.6%) and 99 females (65.6%) in their respective age groups living below the poverty level.
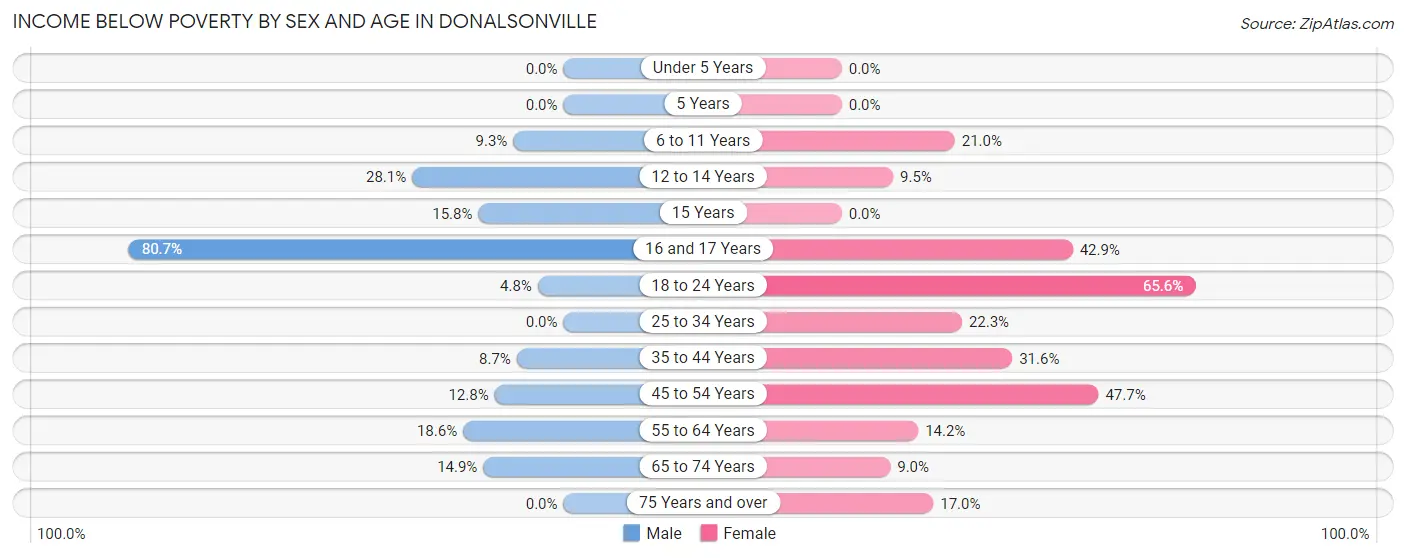
| Age Bracket | Male | Female |
| Under 5 Years | 0 (0.0%) | 0 (0.0%) |
| 5 Years | 0 (0.0%) | 0 (0.0%) |
| 6 to 11 Years | 15 (9.3%) | 26 (21.0%) |
| 12 to 14 Years | 41 (28.1%) | 4 (9.5%) |
| 15 Years | 9 (15.8%) | 0 (0.0%) |
| 16 and 17 Years | 25 (80.6%) | 24 (42.9%) |
| 18 to 24 Years | 6 (4.8%) | 99 (65.6%) |
| 25 to 34 Years | 0 (0.0%) | 33 (22.3%) |
| 35 to 44 Years | 11 (8.7%) | 56 (31.6%) |
| 45 to 54 Years | 17 (12.8%) | 81 (47.6%) |
| 55 to 64 Years | 19 (18.6%) | 20 (14.2%) |
| 65 to 74 Years | 25 (14.9%) | 18 (9.0%) |
| 75 Years and over | 0 (0.0%) | 18 (17.0%) |
| Total | 168 (12.8%) | 379 (27.4%) |
Income Above Poverty by Sex and Age in Donalsonville
According to the poverty statistics in Donalsonville, males aged under 5 years and females aged under 5 years are the age groups that are most secure financially, with 100.0% of males and 100.0% of females in these age groups living above the poverty line.
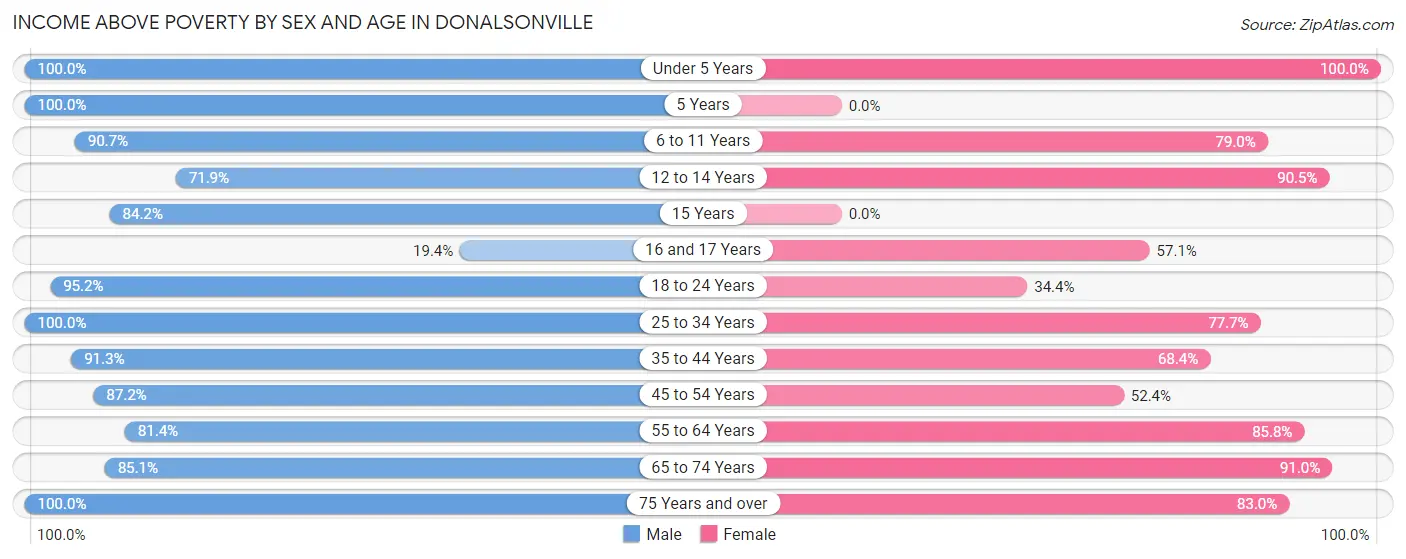
| Age Bracket | Male | Female |
| Under 5 Years | 67 (100.0%) | 66 (100.0%) |
| 5 Years | 13 (100.0%) | 0 (0.0%) |
| 6 to 11 Years | 146 (90.7%) | 98 (79.0%) |
| 12 to 14 Years | 105 (71.9%) | 38 (90.5%) |
| 15 Years | 48 (84.2%) | 0 (0.0%) |
| 16 and 17 Years | 6 (19.4%) | 32 (57.1%) |
| 18 to 24 Years | 120 (95.2%) | 52 (34.4%) |
| 25 to 34 Years | 171 (100.0%) | 115 (77.7%) |
| 35 to 44 Years | 116 (91.3%) | 121 (68.4%) |
| 45 to 54 Years | 116 (87.2%) | 89 (52.3%) |
| 55 to 64 Years | 83 (81.4%) | 121 (85.8%) |
| 65 to 74 Years | 143 (85.1%) | 182 (91.0%) |
| 75 Years and over | 14 (100.0%) | 88 (83.0%) |
| Total | 1,148 (87.2%) | 1,002 (72.6%) |
Income Below Poverty Among Married-Couple Families in Donalsonville
The poverty statistics for married-couple families in Donalsonville show that 6.2% or 19 of the total 305 families live below the poverty line. Families with no children have the highest poverty rate of 9.7%, comprising of 19 families. On the other hand, families with 1 or 2 children have the lowest poverty rate of 0.0%, which includes 0 families.
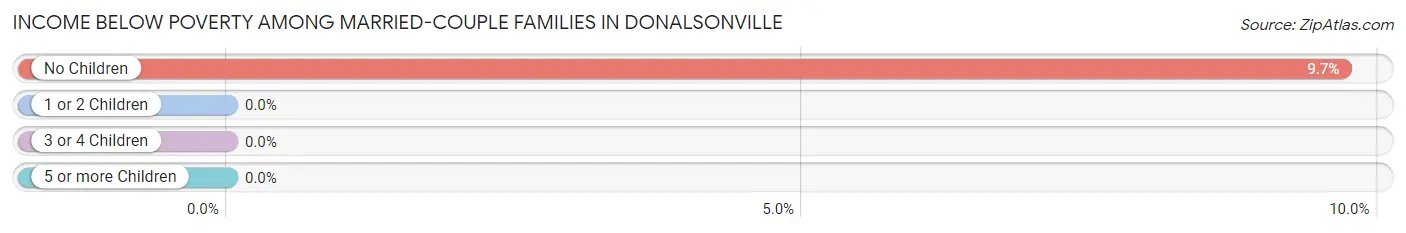
| Children | Above Poverty | Below Poverty |
| No Children | 177 (90.3%) | 19 (9.7%) |
| 1 or 2 Children | 90 (100.0%) | 0 (0.0%) |
| 3 or 4 Children | 19 (100.0%) | 0 (0.0%) |
| 5 or more Children | 0 (0.0%) | 0 (0.0%) |
| Total | 286 (93.8%) | 19 (6.2%) |
Income Below Poverty Among Single-Parent Households in Donalsonville
According to the poverty data in Donalsonville, 12.1% or 17 single-father households and 32.1% or 100 single-mother households are living below the poverty line. Among single-father households, those with no children have the highest poverty rate, with 17 households (19.3%) experiencing poverty. Likewise, among single-mother households, those with 1 or 2 children have the highest poverty rate, with 87 households (47.5%) falling below the poverty line.
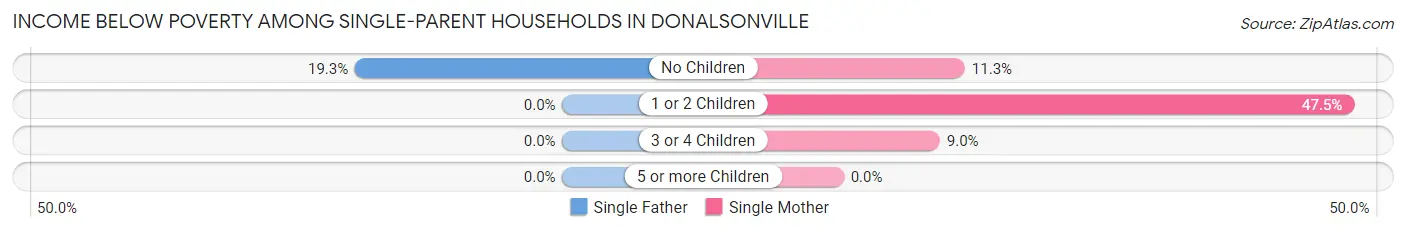
| Children | Single Father | Single Mother |
| No Children | 17 (19.3%) | 7 (11.3%) |
| 1 or 2 Children | 0 (0.0%) | 87 (47.5%) |
| 3 or 4 Children | 0 (0.0%) | 6 (9.0%) |
| 5 or more Children | 0 (0.0%) | 0 (0.0%) |
| Total | 17 (12.1%) | 100 (32.1%) |
Income Below Poverty Among Married-Couple vs Single-Parent Households in Donalsonville
The poverty data for Donalsonville shows that 19 of the married-couple family households (6.2%) and 117 of the single-parent households (25.8%) are living below the poverty level. Within the married-couple family households, those with no children have the highest poverty rate, with 19 households (9.7%) falling below the poverty line. Among the single-parent households, those with 1 or 2 children have the highest poverty rate, with 87 household (36.9%) living below poverty.
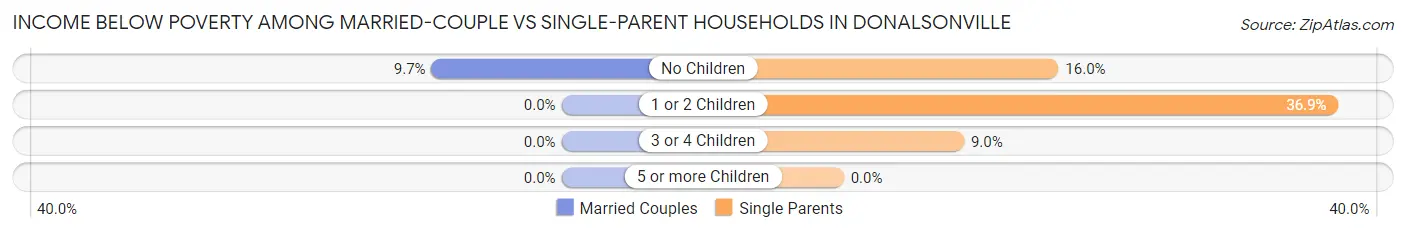
| Children | Married-Couple Families | Single-Parent Households |
| No Children | 19 (9.7%) | 24 (16.0%) |
| 1 or 2 Children | 0 (0.0%) | 87 (36.9%) |
| 3 or 4 Children | 0 (0.0%) | 6 (9.0%) |
| 5 or more Children | 0 (0.0%) | 0 (0.0%) |
| Total | 19 (6.2%) | 117 (25.8%) |
Race in Donalsonville
The most populous races in Donalsonville are Black / African American (1,944 | 68.8%), White / Caucasian (727 | 25.7%), and Two or more Races (109 | 3.9%).
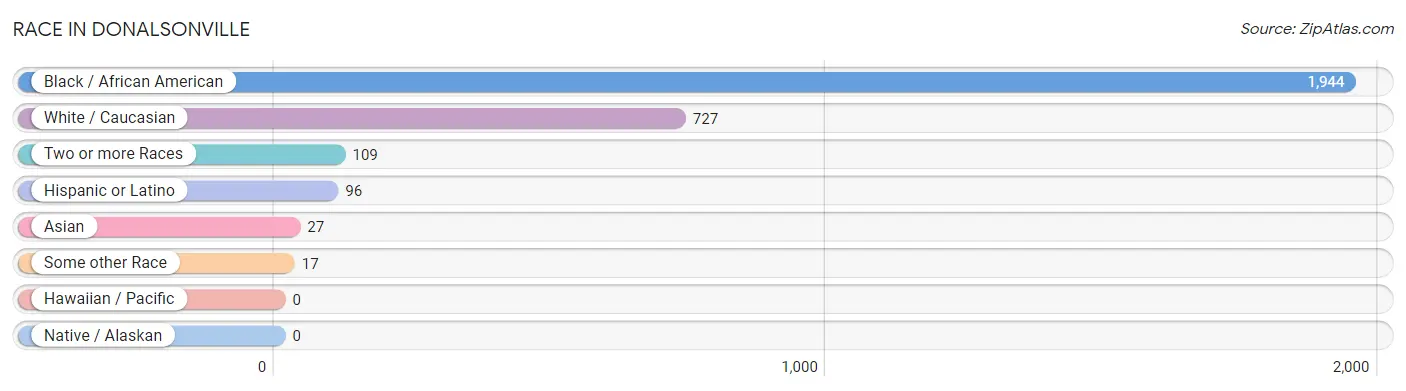
| Race | # Population | % Population |
| Asian | 27 | 1.0% |
| Black / African American | 1,944 | 68.8% |
| Hawaiian / Pacific | 0 | 0.0% |
| Hispanic or Latino | 96 | 3.4% |
| Native / Alaskan | 0 | 0.0% |
| White / Caucasian | 727 | 25.7% |
| Two or more Races | 109 | 3.9% |
| Some other Race | 17 | 0.6% |
| Total | 2,824 | 100.0% |
Ancestry in Donalsonville
The most populous ancestries reported in Donalsonville are American (228 | 8.1%), English (87 | 3.1%), German (54 | 1.9%), Dominican (51 | 1.8%), and Scottish (33 | 1.2%), together accounting for 16.0% of all Donalsonville residents.
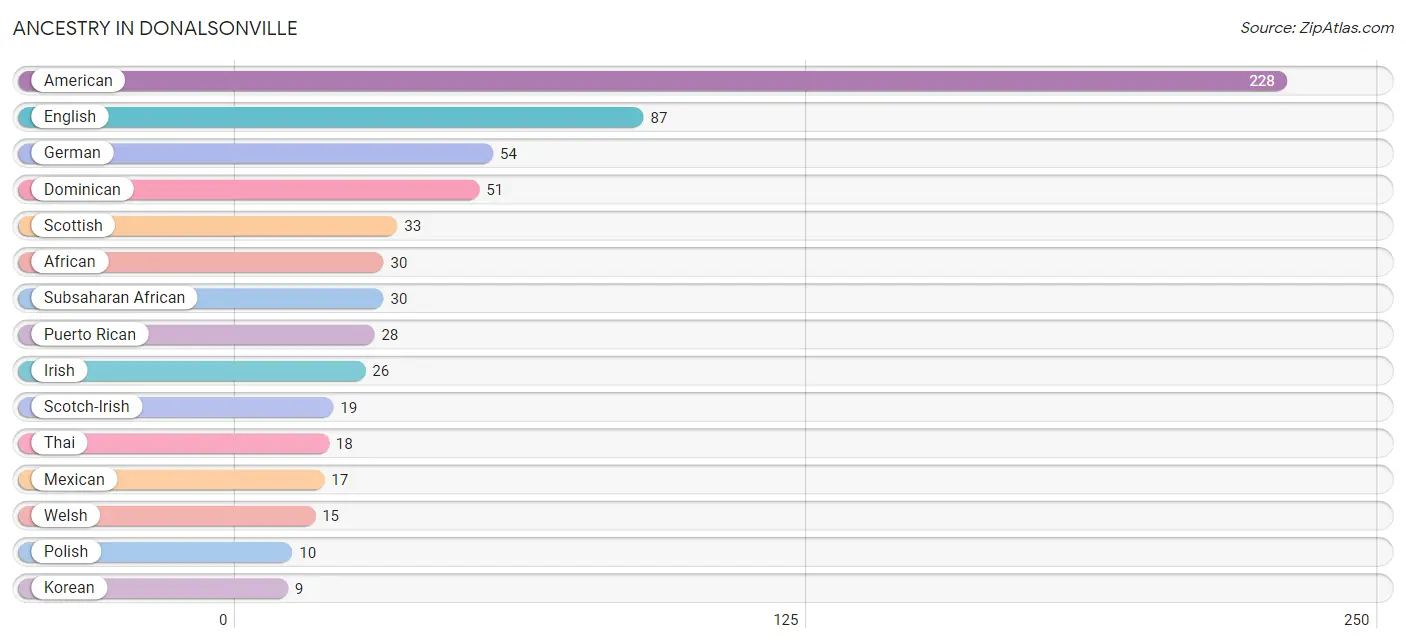
| Ancestry | # Population | % Population |
| African | 30 | 1.1% |
| American | 228 | 8.1% |
| Dominican | 51 | 1.8% |
| English | 87 | 3.1% |
| European | 4 | 0.1% |
| French | 4 | 0.1% |
| German | 54 | 1.9% |
| Greek | 3 | 0.1% |
| Irish | 26 | 0.9% |
| Italian | 7 | 0.3% |
| Korean | 9 | 0.3% |
| Mexican | 17 | 0.6% |
| Polish | 10 | 0.4% |
| Puerto Rican | 28 | 1.0% |
| Scotch-Irish | 19 | 0.7% |
| Scottish | 33 | 1.2% |
| Subsaharan African | 30 | 1.1% |
| Thai | 18 | 0.6% |
| Welsh | 15 | 0.5% | View All 19 Rows |
Immigrants in Donalsonville
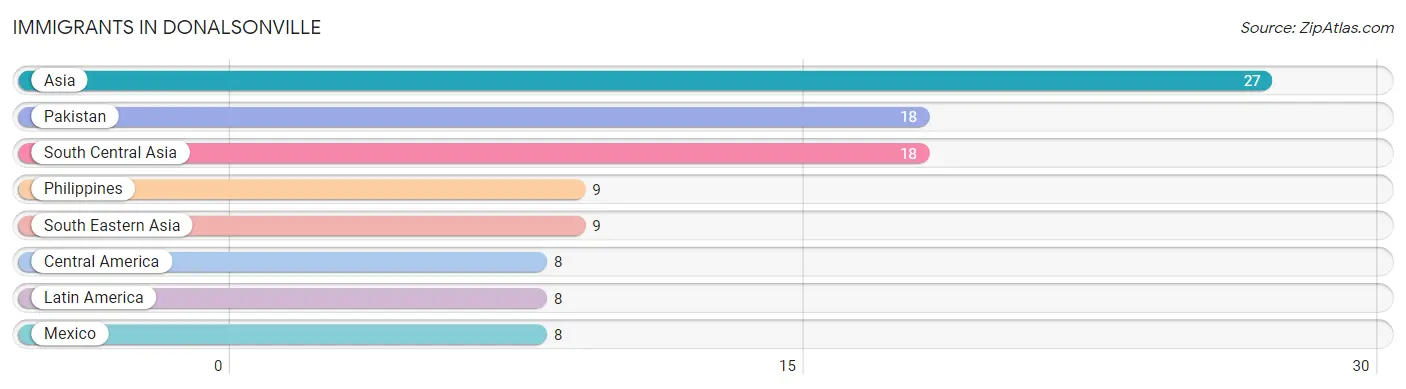
The most numerous immigrant groups reported in Donalsonville came from Asia (27 | 1.0%), Pakistan (18 | 0.6%), South Central Asia (18 | 0.6%), Philippines (9 | 0.3%), and South Eastern Asia (9 | 0.3%), together accounting for 2.9% of all Donalsonville residents.
| Immigration Origin | # Population | % Population |
| Asia | 27 | 1.0% |
| Central America | 8 | 0.3% |
| Latin America | 8 | 0.3% |
| Mexico | 8 | 0.3% |
| Pakistan | 18 | 0.6% |
| Philippines | 9 | 0.3% |
| South Central Asia | 18 | 0.6% |
| South Eastern Asia | 9 | 0.3% | View All 8 Rows |
Sex and Age in Donalsonville
Sex and Age in Donalsonville
The most populous age groups in Donalsonville are 5 to 9 Years (174 | 12.6%) for men and 65 to 69 Years (149 | 10.4%) for women.
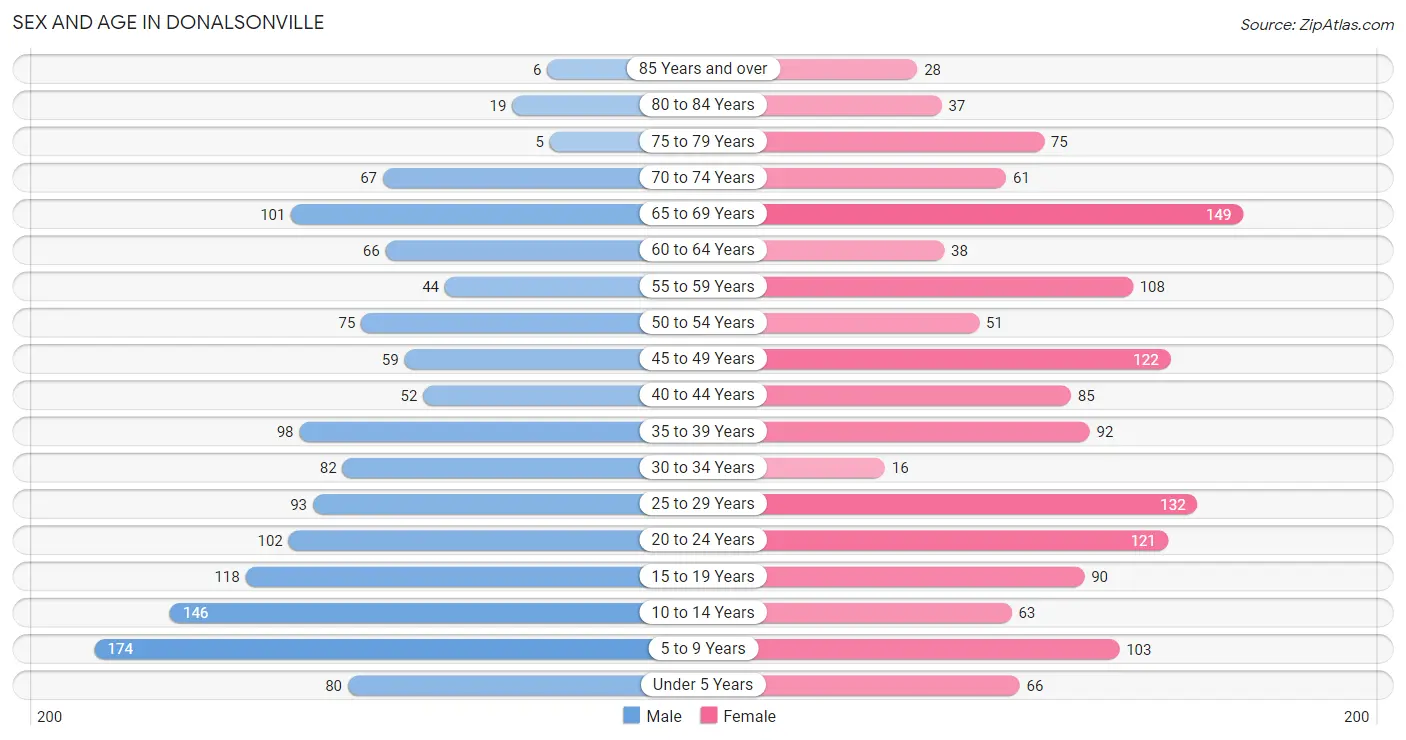
| Age Bracket | Male | Female |
| Under 5 Years | 80 (5.8%) | 66 (4.6%) |
| 5 to 9 Years | 174 (12.6%) | 103 (7.2%) |
| 10 to 14 Years | 146 (10.5%) | 63 (4.4%) |
| 15 to 19 Years | 118 (8.5%) | 90 (6.3%) |
| 20 to 24 Years | 102 (7.3%) | 121 (8.4%) |
| 25 to 29 Years | 93 (6.7%) | 132 (9.2%) |
| 30 to 34 Years | 82 (5.9%) | 16 (1.1%) |
| 35 to 39 Years | 98 (7.1%) | 92 (6.4%) |
| 40 to 44 Years | 52 (3.7%) | 85 (5.9%) |
| 45 to 49 Years | 59 (4.3%) | 122 (8.5%) |
| 50 to 54 Years | 75 (5.4%) | 51 (3.5%) |
| 55 to 59 Years | 44 (3.2%) | 108 (7.5%) |
| 60 to 64 Years | 66 (4.8%) | 38 (2.6%) |
| 65 to 69 Years | 101 (7.3%) | 149 (10.4%) |
| 70 to 74 Years | 67 (4.8%) | 61 (4.2%) |
| 75 to 79 Years | 5 (0.4%) | 75 (5.2%) |
| 80 to 84 Years | 19 (1.4%) | 37 (2.6%) |
| 85 Years and over | 6 (0.4%) | 28 (1.9%) |
| Total | 1,387 (100.0%) | 1,437 (100.0%) |
Families and Households in Donalsonville
Median Family Size in Donalsonville
The median family size in Donalsonville is 2.97 persons per family, with married-couple families (305 | 40.2%) accounting for the largest median family size of 3.13 persons per family. On the other hand, single male/father families (141 | 18.6%) represent the smallest median family size with 2.60 persons per family.
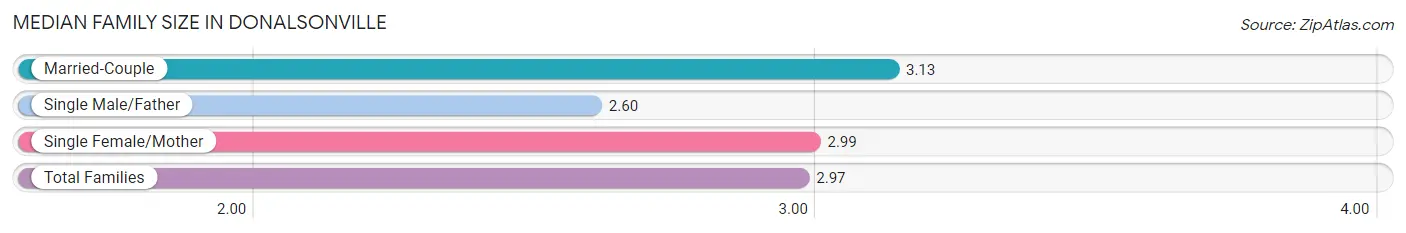
| Family Type | # Families | Family Size |
| Married-Couple | 305 (40.2%) | 3.13 |
| Single Male/Father | 141 (18.6%) | 2.60 |
| Single Female/Mother | 312 (41.2%) | 2.99 |
| Total Families | 758 (100.0%) | 2.97 |
Median Household Size in Donalsonville
The median household size in Donalsonville is 2.61 persons per household, with single female/mother households (312 | 30.0%) accounting for the largest median household size of 3.29 persons per household. non-family households (282 | 27.1%) represent the smallest median household size with 1.18 persons per household.
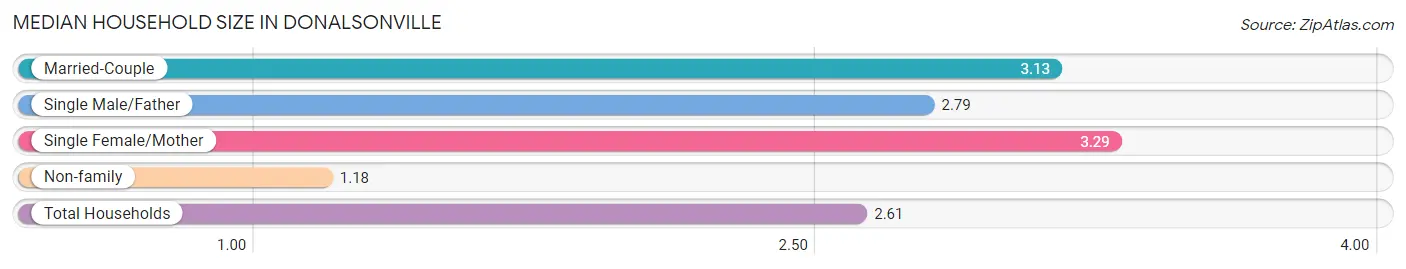
| Household Type | # Households | Household Size |
| Married-Couple | 305 (29.3%) | 3.13 |
| Single Male/Father | 141 (13.6%) | 2.79 |
| Single Female/Mother | 312 (30.0%) | 3.29 |
| Non-family | 282 (27.1%) | 1.18 |
| Total Households | 1,040 (100.0%) | 2.61 |
Household Size by Marriage Status in Donalsonville
Out of a total of 1,040 households in Donalsonville, 758 (72.9%) are family households, while 282 (27.1%) are nonfamily households. The most numerous type of family households are 2-person households, comprising 337, and the most common type of nonfamily households are 1-person households, comprising 216.
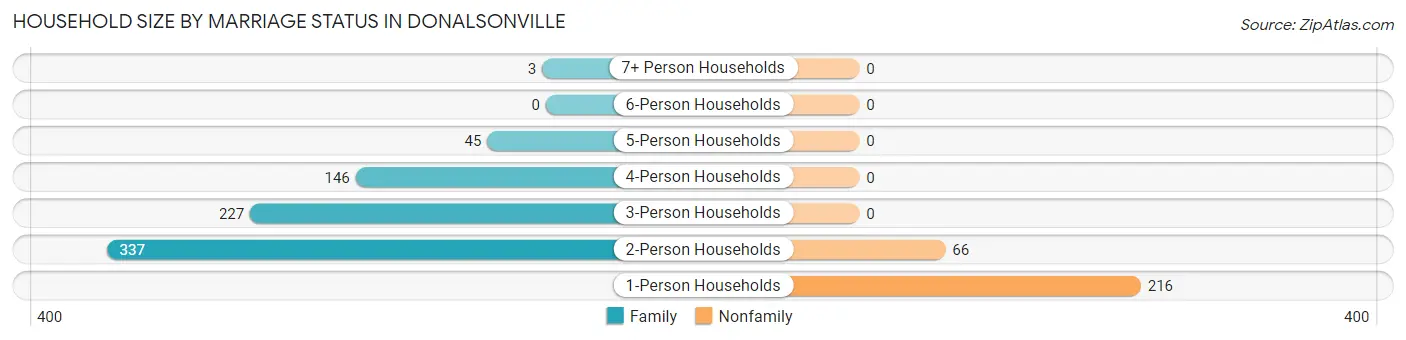
| Household Size | Family Households | Nonfamily Households |
| 1-Person Households | - | 216 (20.8%) |
| 2-Person Households | 337 (32.4%) | 66 (6.4%) |
| 3-Person Households | 227 (21.8%) | 0 (0.0%) |
| 4-Person Households | 146 (14.0%) | 0 (0.0%) |
| 5-Person Households | 45 (4.3%) | 0 (0.0%) |
| 6-Person Households | 0 (0.0%) | 0 (0.0%) |
| 7+ Person Households | 3 (0.3%) | 0 (0.0%) |
| Total | 758 (72.9%) | 282 (27.1%) |
Female Fertility in Donalsonville
Fertility by Age in Donalsonville
Average fertility rate in Donalsonville is 23.0 births per 1,000 women. Women in the age bracket of 20 to 34 years have the highest fertility rate with 56.0 births per 1,000 women. Women in the age bracket of 20 to 34 years acount for 100.0% of all women with births.
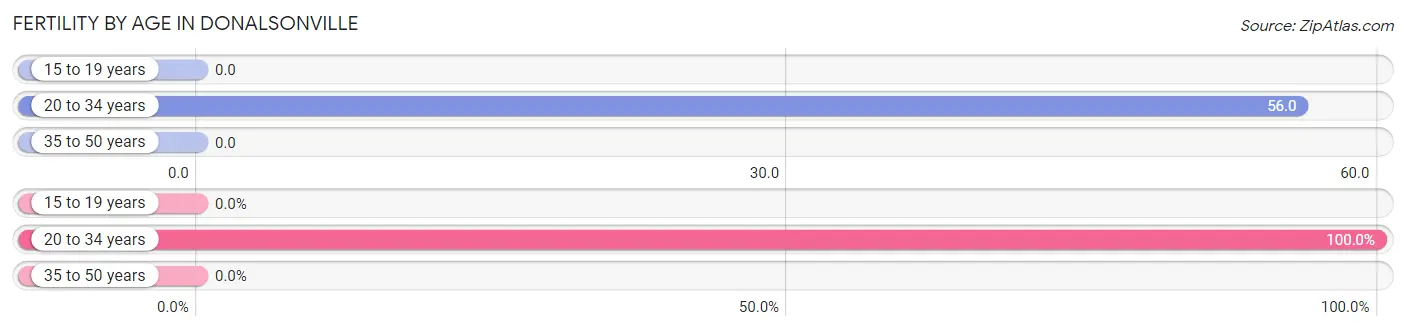
| Age Bracket | Women with Births | Births / 1,000 Women |
| 15 to 19 years | 0 (0.0%) | 0.0 |
| 20 to 34 years | 15 (100.0%) | 56.0 |
| 35 to 50 years | 0 (0.0%) | 0.0 |
| Total | 15 (100.0%) | 23.0 |
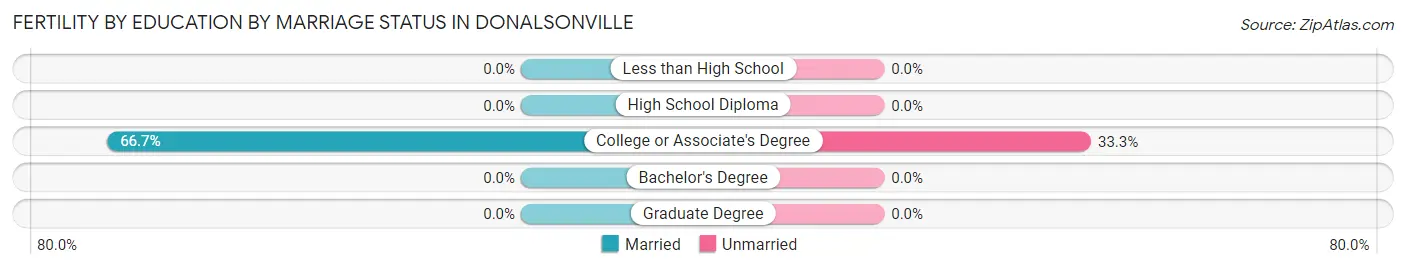
Fertility by Age by Marriage Status in Donalsonville
66.7% of women with births (15) in Donalsonville are married. The highest percentage of unmarried women with births falls into 20 to 34 years age bracket with 33.3% of them unmarried at the time of birth, while the lowest percentage of unmarried women with births belong to 20 to 34 years age bracket with 33.3% of them unmarried.
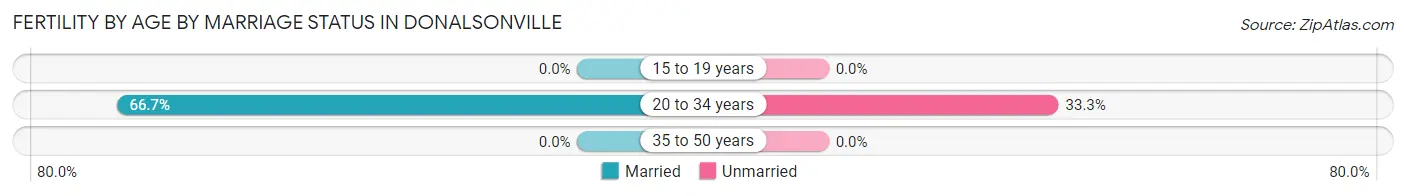
| Age Bracket | Married | Unmarried |
| 15 to 19 years | 0 (0.0%) | 0 (0.0%) |
| 20 to 34 years | 10 (66.7%) | 5 (33.3%) |
| 35 to 50 years | 0 (0.0%) | 0 (0.0%) |
| Total | 10 (66.7%) | 5 (33.3%) |
Fertility by Education in Donalsonville
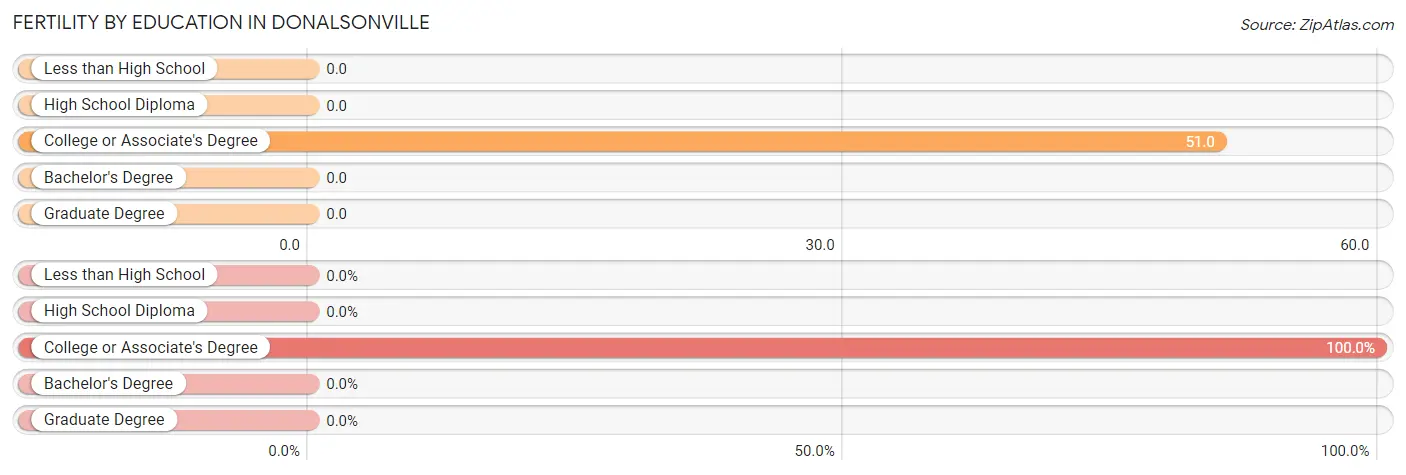
| Educational Attainment | Women with Births | Births / 1,000 Women |
| Less than High School | 0 (0.0%) | 0.0 |
| High School Diploma | 0 (0.0%) | 0.0 |
| College or Associate's Degree | 15 (100.0%) | 51.0 |
| Bachelor's Degree | 0 (0.0%) | 0.0 |
| Graduate Degree | 0 (0.0%) | 0.0 |
| Total | 15 (100.0%) | 23.0 |
Fertility by Education by Marriage Status in Donalsonville
33.3% of women with births in Donalsonville are unmarried. Women with the educational attainment of college or associate's degree are most likely to be married with 66.7% of them married at childbirth, while women with the educational attainment of college or associate's degree are least likely to be married with 33.3% of them unmarried at childbirth.
| Educational Attainment | Married | Unmarried |
| Less than High School | 0 (0.0%) | 0 (0.0%) |
| High School Diploma | 0 (0.0%) | 0 (0.0%) |
| College or Associate's Degree | 10 (66.7%) | 5 (33.3%) |
| Bachelor's Degree | 0 (0.0%) | 0 (0.0%) |
| Graduate Degree | 0 (0.0%) | 0 (0.0%) |
| Total | 10 (66.7%) | 5 (33.3%) |
Employment Characteristics in Donalsonville
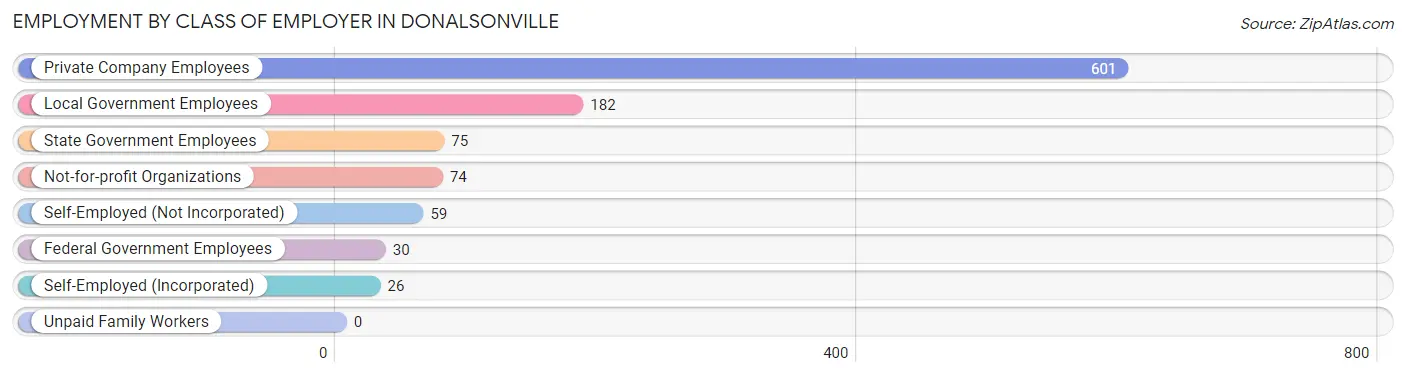
Employment by Class of Employer in Donalsonville
Among the 1,047 employed individuals in Donalsonville, private company employees (601 | 57.4%), local government employees (182 | 17.4%), and state government employees (75 | 7.2%) make up the most common classes of employment.
| Employer Class | # Employees | % Employees |
| Private Company Employees | 601 | 57.4% |
| Self-Employed (Incorporated) | 26 | 2.5% |
| Self-Employed (Not Incorporated) | 59 | 5.6% |
| Not-for-profit Organizations | 74 | 7.1% |
| Local Government Employees | 182 | 17.4% |
| State Government Employees | 75 | 7.2% |
| Federal Government Employees | 30 | 2.9% |
| Unpaid Family Workers | 0 | 0.0% |
| Total | 1,047 | 100.0% |
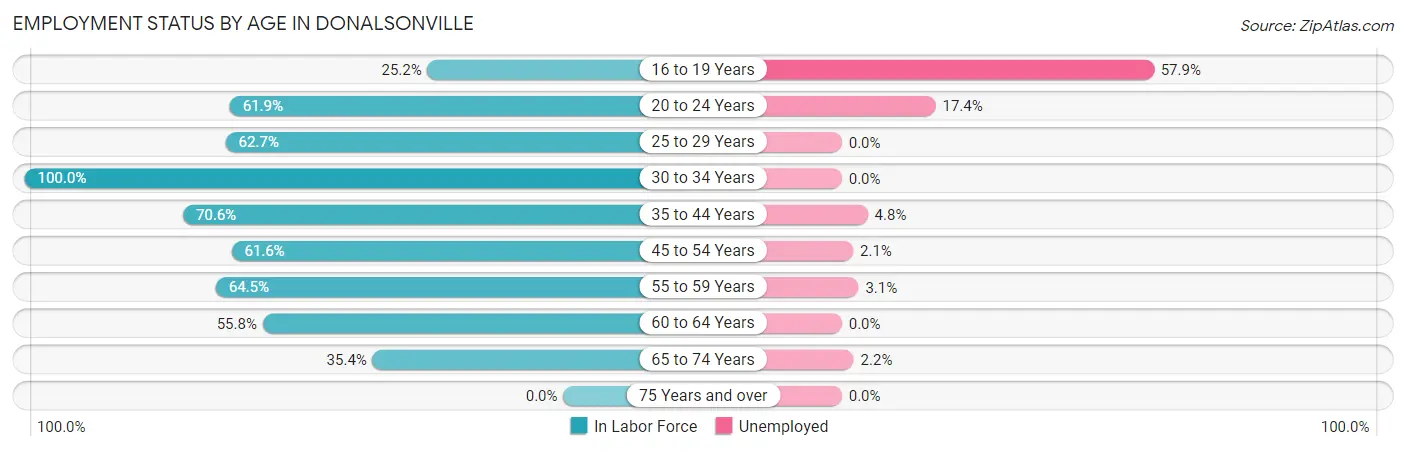
Employment Status by Age in Donalsonville
According to the labor force statistics for Donalsonville, out of the total population over 16 years of age (2,135), 52.7% or 1,125 individuals are in the labor force, with 6.0% or 68 of them unemployed. The age group with the highest labor force participation rate is 30 to 34 years, with 100.0% or 98 individuals in the labor force. Within the labor force, the 16 to 19 years age range has the highest percentage of unemployed individuals, with 57.9% or 22 of them being unemployed.
| Age Bracket | In Labor Force | Unemployed |
| 16 to 19 Years | 38 (25.2%) | 22 (57.9%) |
| 20 to 24 Years | 138 (61.9%) | 24 (17.4%) |
| 25 to 29 Years | 141 (62.7%) | 0 (0.0%) |
| 30 to 34 Years | 98 (100.0%) | 0 (0.0%) |
| 35 to 44 Years | 231 (70.6%) | 11 (4.8%) |
| 45 to 54 Years | 189 (61.6%) | 4 (2.1%) |
| 55 to 59 Years | 98 (64.5%) | 3 (3.1%) |
| 60 to 64 Years | 58 (55.8%) | 0 (0.0%) |
| 65 to 74 Years | 134 (35.4%) | 3 (2.2%) |
| 75 Years and over | 0 (0.0%) | 0 (0.0%) |
| Total | 1,125 (52.7%) | 68 (6.0%) |
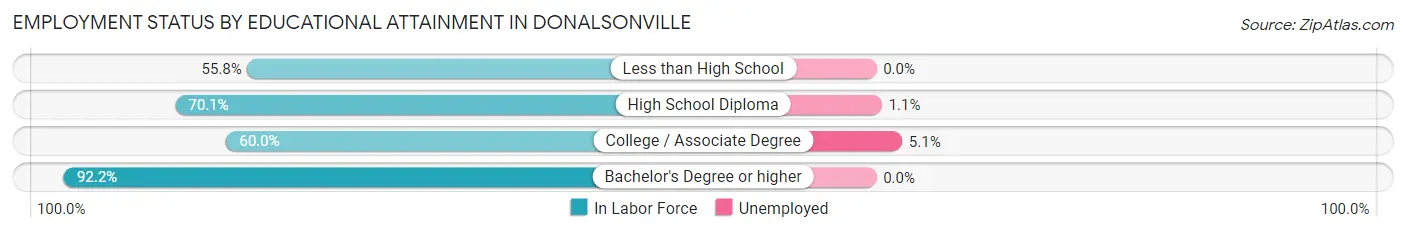
Employment Status by Educational Attainment in Donalsonville
According to labor force statistics for Donalsonville, 67.2% of individuals (815) out of the total population between 25 and 64 years of age (1,213) are in the labor force, with 2.2% or 18 of them being unemployed. The group with the highest labor force participation rate are those with the educational attainment of bachelor's degree or higher, with 92.2% or 106 individuals in the labor force. Within the labor force, individuals with college / associate degree education have the highest percentage of unemployment, with 5.1% or 14 of them being unemployed.
| Educational Attainment | In Labor Force | Unemployed |
| Less than High School | 58 (55.8%) | 0 (0.0%) |
| High School Diploma | 378 (70.1%) | 6 (1.1%) |
| College / Associate Degree | 273 (60.0%) | 23 (5.1%) |
| Bachelor's Degree or higher | 106 (92.2%) | 0 (0.0%) |
| Total | 815 (67.2%) | 27 (2.2%) |
Employment Occupations by Sex in Donalsonville
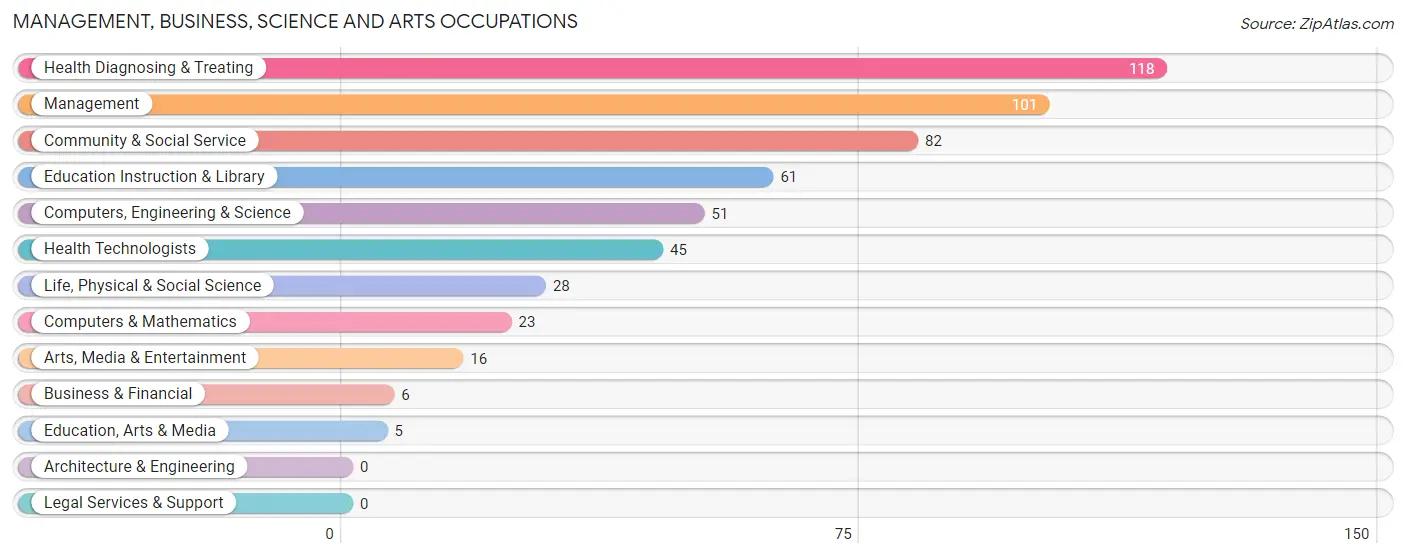
Management, Business, Science and Arts Occupations
The most common Management, Business, Science and Arts occupations in Donalsonville are Health Diagnosing & Treating (118 | 11.2%), Management (101 | 9.6%), Community & Social Service (82 | 7.7%), Education Instruction & Library (61 | 5.8%), and Computers, Engineering & Science (51 | 4.8%).
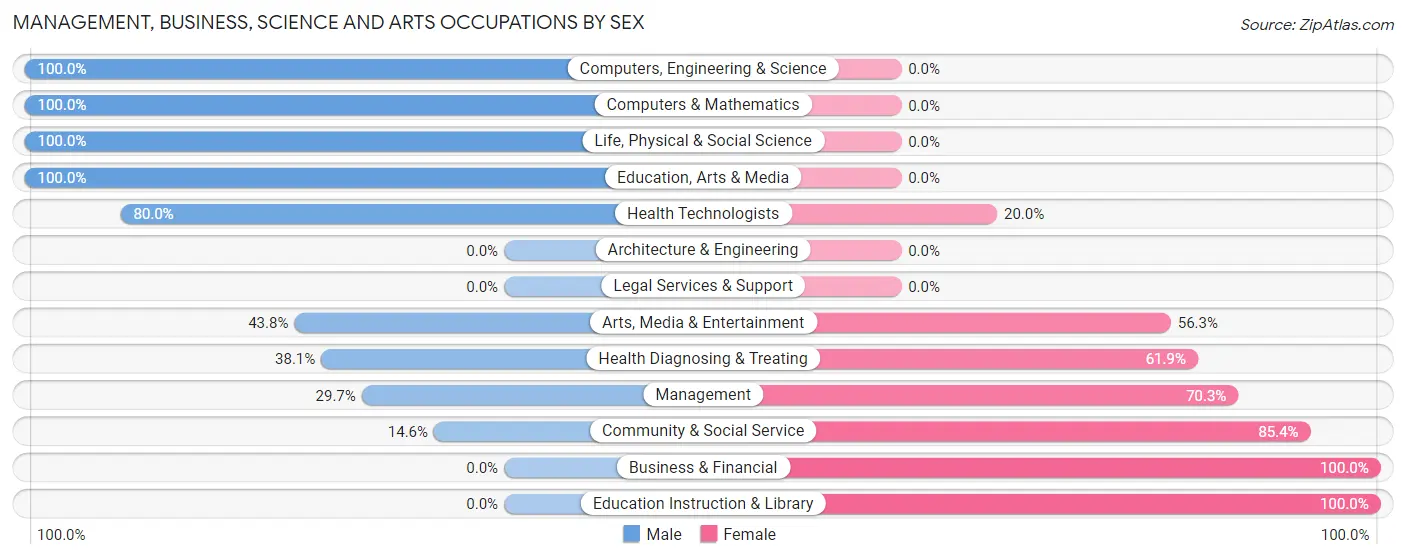
Management, Business, Science and Arts Occupations by Sex
Within the Management, Business, Science and Arts occupations in Donalsonville, the most male-oriented occupations are Computers, Engineering & Science (100.0%), Computers & Mathematics (100.0%), and Life, Physical & Social Science (100.0%), while the most female-oriented occupations are Business & Financial (100.0%), Education Instruction & Library (100.0%), and Community & Social Service (85.4%).
| Occupation | Male | Female |
| Management | 30 (29.7%) | 71 (70.3%) |
| Business & Financial | 0 (0.0%) | 6 (100.0%) |
| Computers, Engineering & Science | 51 (100.0%) | 0 (0.0%) |
| Computers & Mathematics | 23 (100.0%) | 0 (0.0%) |
| Architecture & Engineering | 0 (0.0%) | 0 (0.0%) |
| Life, Physical & Social Science | 28 (100.0%) | 0 (0.0%) |
| Community & Social Service | 12 (14.6%) | 70 (85.4%) |
| Education, Arts & Media | 5 (100.0%) | 0 (0.0%) |
| Legal Services & Support | 0 (0.0%) | 0 (0.0%) |
| Education Instruction & Library | 0 (0.0%) | 61 (100.0%) |
| Arts, Media & Entertainment | 7 (43.8%) | 9 (56.2%) |
| Health Diagnosing & Treating | 45 (38.1%) | 73 (61.9%) |
| Health Technologists | 36 (80.0%) | 9 (20.0%) |
| Total (Category) | 138 (38.6%) | 220 (61.5%) |
| Total (Overall) | 556 (52.5%) | 502 (47.4%) |
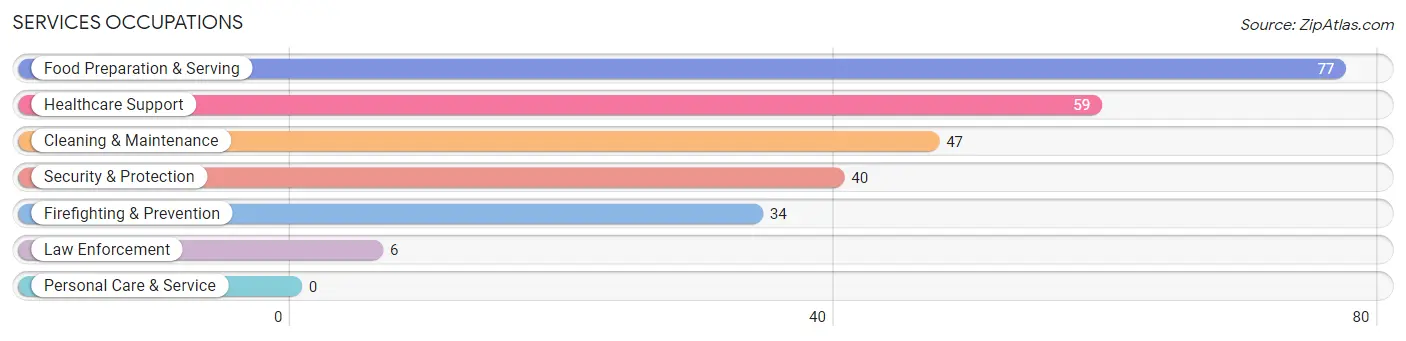
Services Occupations
The most common Services occupations in Donalsonville are Food Preparation & Serving (77 | 7.3%), Healthcare Support (59 | 5.6%), Cleaning & Maintenance (47 | 4.4%), Security & Protection (40 | 3.8%), and Firefighting & Prevention (34 | 3.2%).
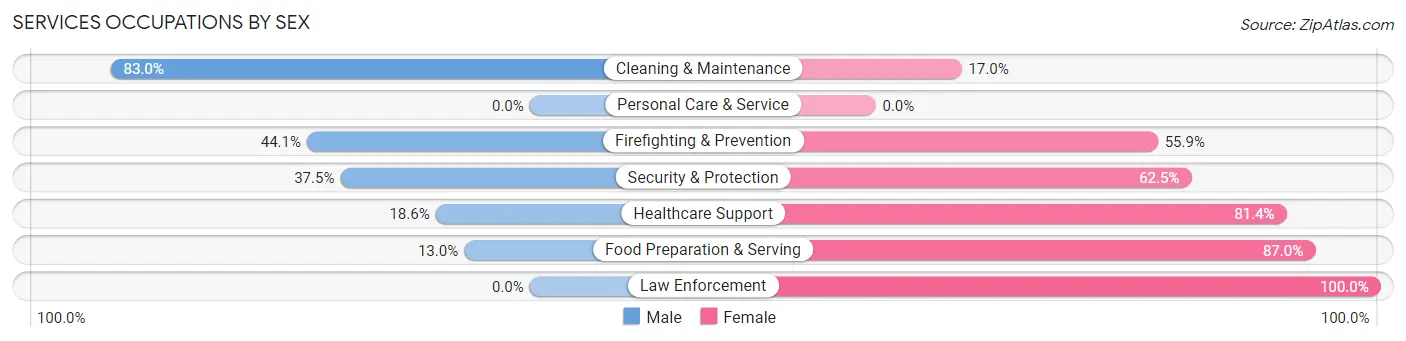
Services Occupations by Sex
Within the Services occupations in Donalsonville, the most male-oriented occupations are Cleaning & Maintenance (83.0%), Firefighting & Prevention (44.1%), and Security & Protection (37.5%), while the most female-oriented occupations are Law Enforcement (100.0%), Food Preparation & Serving (87.0%), and Healthcare Support (81.4%).
| Occupation | Male | Female |
| Healthcare Support | 11 (18.6%) | 48 (81.4%) |
| Security & Protection | 15 (37.5%) | 25 (62.5%) |
| Firefighting & Prevention | 15 (44.1%) | 19 (55.9%) |
| Law Enforcement | 0 (0.0%) | 6 (100.0%) |
| Food Preparation & Serving | 10 (13.0%) | 67 (87.0%) |
| Cleaning & Maintenance | 39 (83.0%) | 8 (17.0%) |
| Personal Care & Service | 0 (0.0%) | 0 (0.0%) |
| Total (Category) | 75 (33.6%) | 148 (66.4%) |
| Total (Overall) | 556 (52.5%) | 502 (47.4%) |
Sales and Office Occupations
The most common Sales and Office occupations in Donalsonville are Sales & Related (75 | 7.1%), and Office & Administration (52 | 4.9%).

Sales and Office Occupations by Sex

| Occupation | Male | Female |
| Sales & Related | 32 (42.7%) | 43 (57.3%) |
| Office & Administration | 6 (11.5%) | 46 (88.5%) |
| Total (Category) | 38 (29.9%) | 89 (70.1%) |
| Total (Overall) | 556 (52.5%) | 502 (47.4%) |
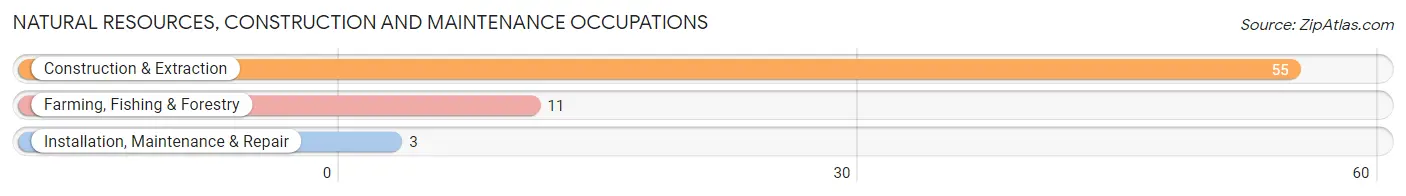
Natural Resources, Construction and Maintenance Occupations
The most common Natural Resources, Construction and Maintenance occupations in Donalsonville are Construction & Extraction (55 | 5.2%), Farming, Fishing & Forestry (11 | 1.0%), and Installation, Maintenance & Repair (3 | 0.3%).
Natural Resources, Construction and Maintenance Occupations by Sex
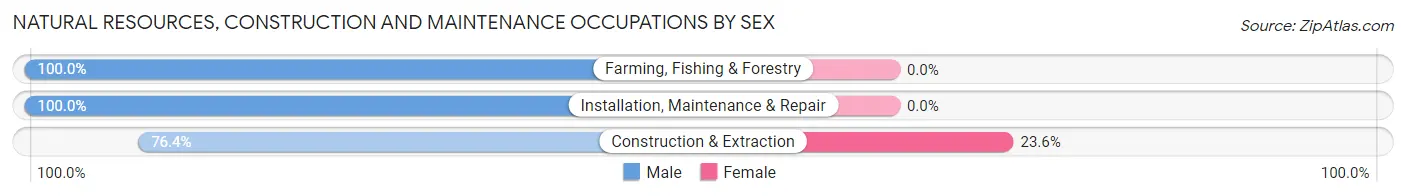
| Occupation | Male | Female |
| Farming, Fishing & Forestry | 11 (100.0%) | 0 (0.0%) |
| Construction & Extraction | 42 (76.4%) | 13 (23.6%) |
| Installation, Maintenance & Repair | 3 (100.0%) | 0 (0.0%) |
| Total (Category) | 56 (81.2%) | 13 (18.8%) |
| Total (Overall) | 556 (52.5%) | 502 (47.4%) |
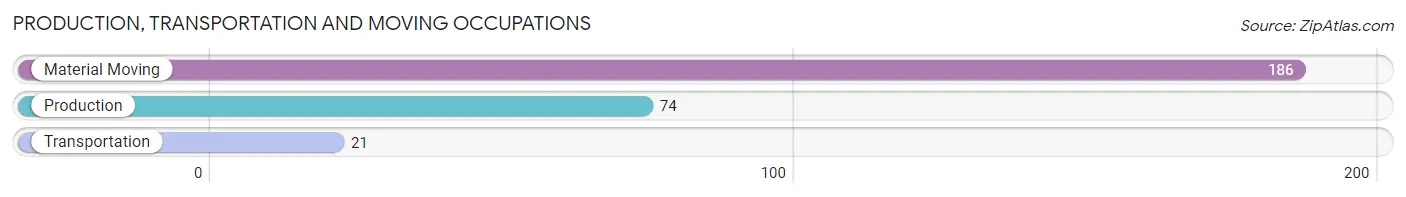
Production, Transportation and Moving Occupations
The most common Production, Transportation and Moving occupations in Donalsonville are Material Moving (186 | 17.6%), Production (74 | 7.0%), and Transportation (21 | 2.0%).
Production, Transportation and Moving Occupations by Sex
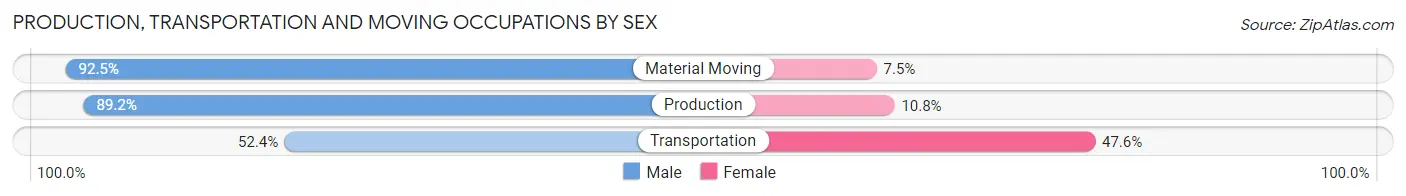
| Occupation | Male | Female |
| Production | 66 (89.2%) | 8 (10.8%) |
| Transportation | 11 (52.4%) | 10 (47.6%) |
| Material Moving | 172 (92.5%) | 14 (7.5%) |
| Total (Category) | 249 (88.6%) | 32 (11.4%) |
| Total (Overall) | 556 (52.5%) | 502 (47.4%) |
Employment Industries by Sex in Donalsonville
Employment Industries in Donalsonville
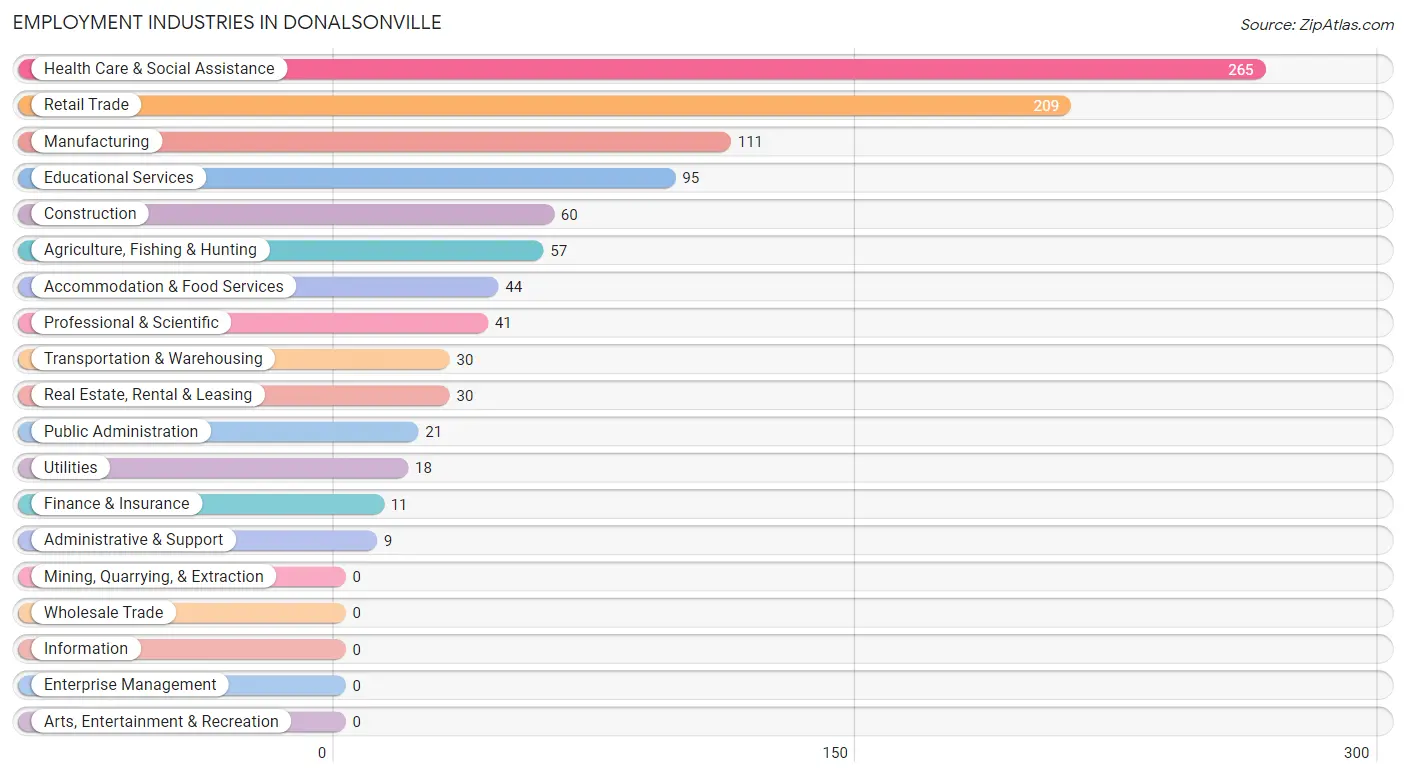
The major employment industries in Donalsonville include Health Care & Social Assistance (265 | 25.1%), Retail Trade (209 | 19.8%), Manufacturing (111 | 10.5%), Educational Services (95 | 9.0%), and Construction (60 | 5.7%).
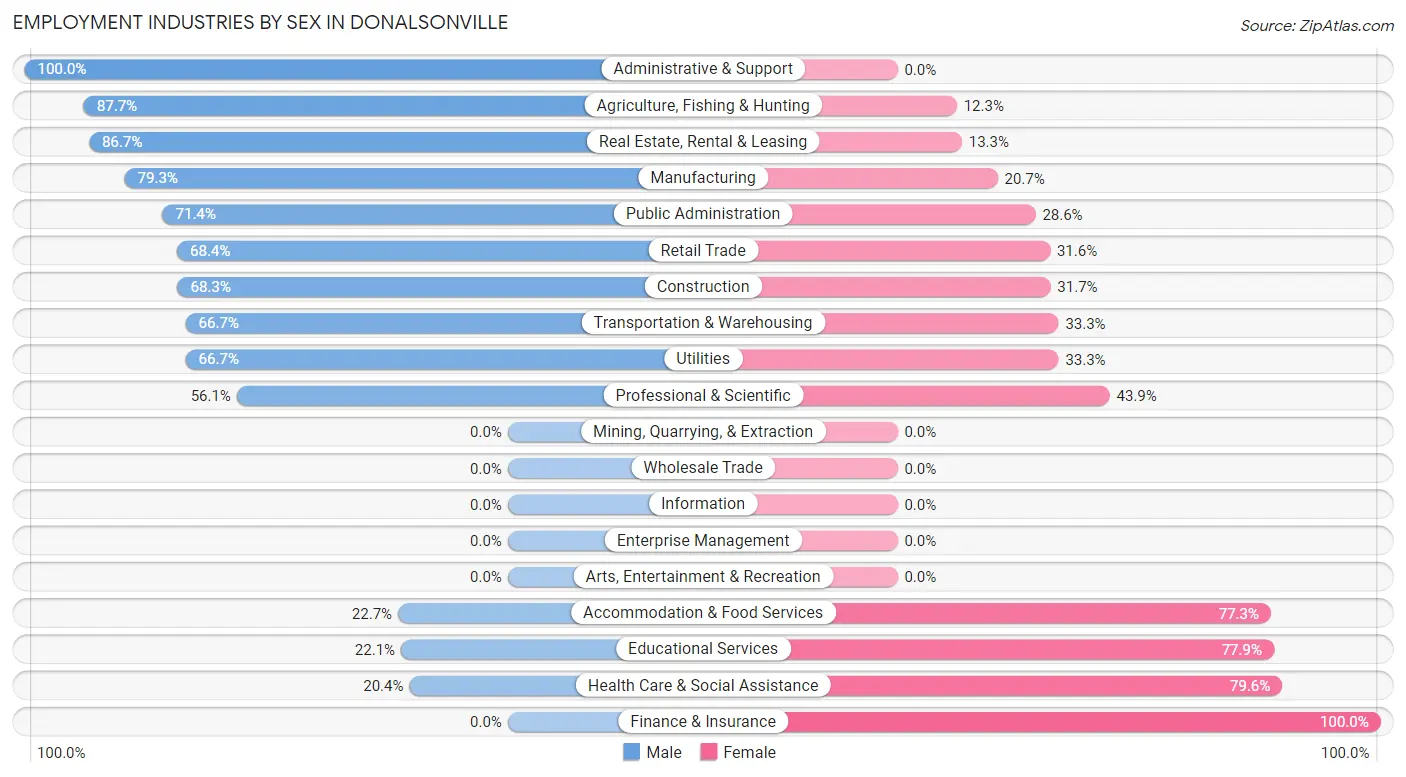
Employment Industries by Sex in Donalsonville
The Donalsonville industries that see more men than women are Administrative & Support (100.0%), Agriculture, Fishing & Hunting (87.7%), and Real Estate, Rental & Leasing (86.7%), whereas the industries that tend to have a higher number of women are Finance & Insurance (100.0%), Health Care & Social Assistance (79.6%), and Educational Services (77.9%).
| Industry | Male | Female |
| Agriculture, Fishing & Hunting | 50 (87.7%) | 7 (12.3%) |
| Mining, Quarrying, & Extraction | 0 (0.0%) | 0 (0.0%) |
| Construction | 41 (68.3%) | 19 (31.7%) |
| Manufacturing | 88 (79.3%) | 23 (20.7%) |
| Wholesale Trade | 0 (0.0%) | 0 (0.0%) |
| Retail Trade | 143 (68.4%) | 66 (31.6%) |
| Transportation & Warehousing | 20 (66.7%) | 10 (33.3%) |
| Utilities | 12 (66.7%) | 6 (33.3%) |
| Information | 0 (0.0%) | 0 (0.0%) |
| Finance & Insurance | 0 (0.0%) | 11 (100.0%) |
| Real Estate, Rental & Leasing | 26 (86.7%) | 4 (13.3%) |
| Professional & Scientific | 23 (56.1%) | 18 (43.9%) |
| Enterprise Management | 0 (0.0%) | 0 (0.0%) |
| Administrative & Support | 9 (100.0%) | 0 (0.0%) |
| Educational Services | 21 (22.1%) | 74 (77.9%) |
| Health Care & Social Assistance | 54 (20.4%) | 211 (79.6%) |
| Arts, Entertainment & Recreation | 0 (0.0%) | 0 (0.0%) |
| Accommodation & Food Services | 10 (22.7%) | 34 (77.3%) |
| Public Administration | 15 (71.4%) | 6 (28.6%) |
| Total | 556 (52.5%) | 502 (47.4%) |
Education in Donalsonville
School Enrollment in Donalsonville
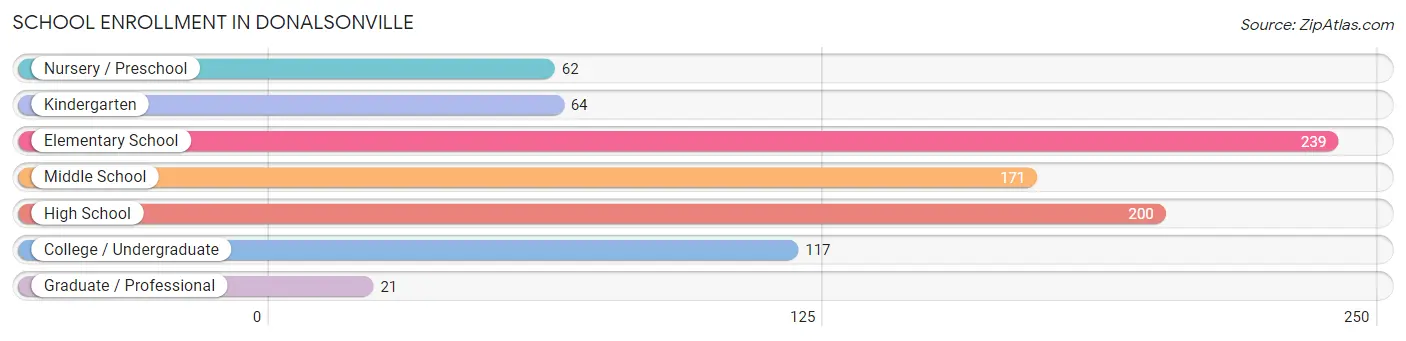
The most common levels of schooling among the 874 students in Donalsonville are elementary school (239 | 27.4%), high school (200 | 22.9%), and middle school (171 | 19.6%).
| School Level | # Students | % Students |
| Nursery / Preschool | 62 | 7.1% |
| Kindergarten | 64 | 7.3% |
| Elementary School | 239 | 27.4% |
| Middle School | 171 | 19.6% |
| High School | 200 | 22.9% |
| College / Undergraduate | 117 | 13.4% |
| Graduate / Professional | 21 | 2.4% |
| Total | 874 | 100.0% |
School Enrollment by Age by Funding Source in Donalsonville
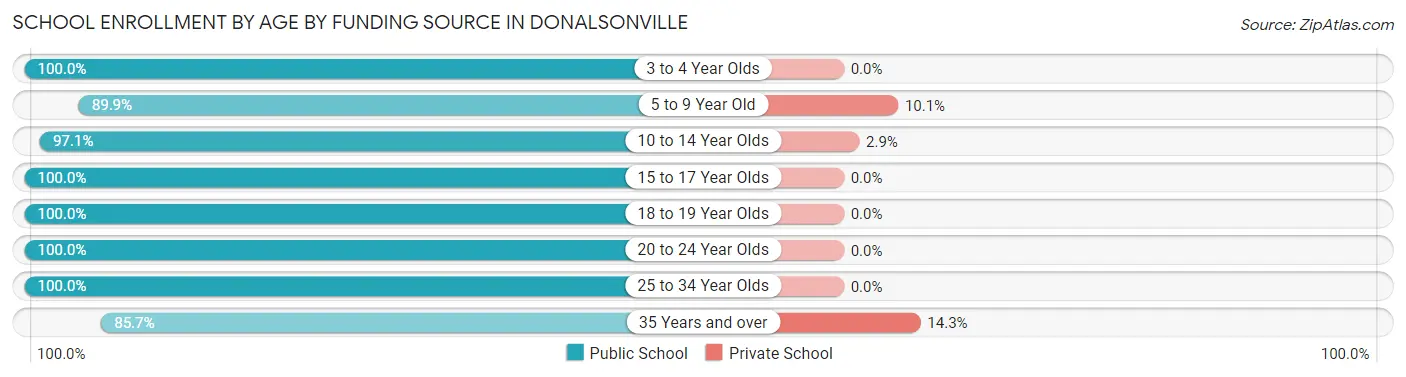
Out of a total of 874 students who are enrolled in schools in Donalsonville, 45 (5.1%) attend a private institution, while the remaining 829 (94.9%) are enrolled in public schools. The age group of 35 years and over has the highest likelihood of being enrolled in private schools, with 11 (14.3% in the age bracket) enrolled. Conversely, the age group of 3 to 4 year olds has the lowest likelihood of being enrolled in a private school, with 88 (100.0% in the age bracket) attending a public institution.
| Age Bracket | Public School | Private School |
| 3 to 4 Year Olds | 88 (100.0%) | 0 (0.0%) |
| 5 to 9 Year Old | 249 (89.9%) | 28 (10.1%) |
| 10 to 14 Year Olds | 203 (97.1%) | 6 (2.9%) |
| 15 to 17 Year Olds | 145 (100.0%) | 0 (0.0%) |
| 18 to 19 Year Olds | 17 (100.0%) | 0 (0.0%) |
| 20 to 24 Year Olds | 41 (100.0%) | 0 (0.0%) |
| 25 to 34 Year Olds | 20 (100.0%) | 0 (0.0%) |
| 35 Years and over | 66 (85.7%) | 11 (14.3%) |
| Total | 829 (94.9%) | 45 (5.1%) |
Educational Attainment by Field of Study in Donalsonville
Education (63 | 39.4%), arts & humanities (23 | 14.4%), business (20 | 12.5%), multidisciplinary studies (19 | 11.9%), and science & technology (13 | 8.1%) are the most common fields of study among 160 individuals in Donalsonville who have obtained a bachelor's degree or higher.
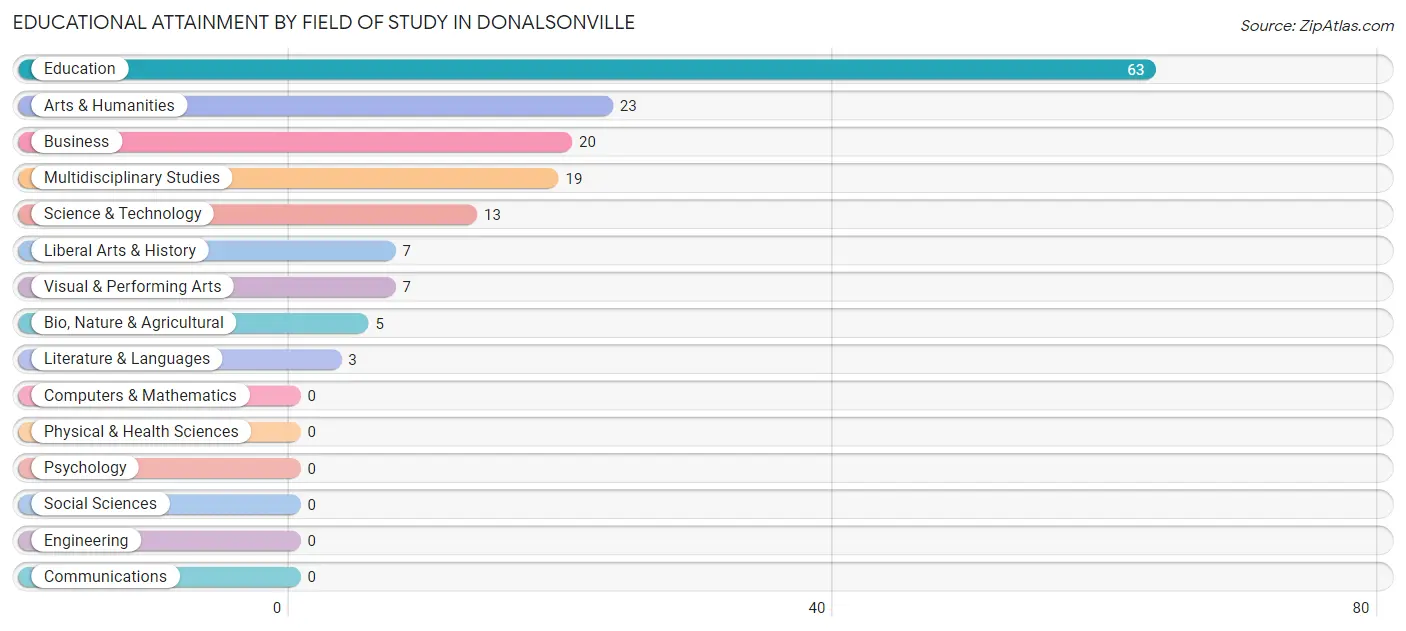
| Field of Study | # Graduates | % Graduates |
| Computers & Mathematics | 0 | 0.0% |
| Bio, Nature & Agricultural | 5 | 3.1% |
| Physical & Health Sciences | 0 | 0.0% |
| Psychology | 0 | 0.0% |
| Social Sciences | 0 | 0.0% |
| Engineering | 0 | 0.0% |
| Multidisciplinary Studies | 19 | 11.9% |
| Science & Technology | 13 | 8.1% |
| Business | 20 | 12.5% |
| Education | 63 | 39.4% |
| Literature & Languages | 3 | 1.9% |
| Liberal Arts & History | 7 | 4.4% |
| Visual & Performing Arts | 7 | 4.4% |
| Communications | 0 | 0.0% |
| Arts & Humanities | 23 | 14.4% |
| Total | 160 | 100.0% |
Transportation & Commute in Donalsonville
Vehicle Availability by Sex in Donalsonville
The most prevalent vehicle ownership categories in Donalsonville are males with 1 vehicle (179, accounting for 32.3%) and females with 1 vehicle (203, making up 36.4%).
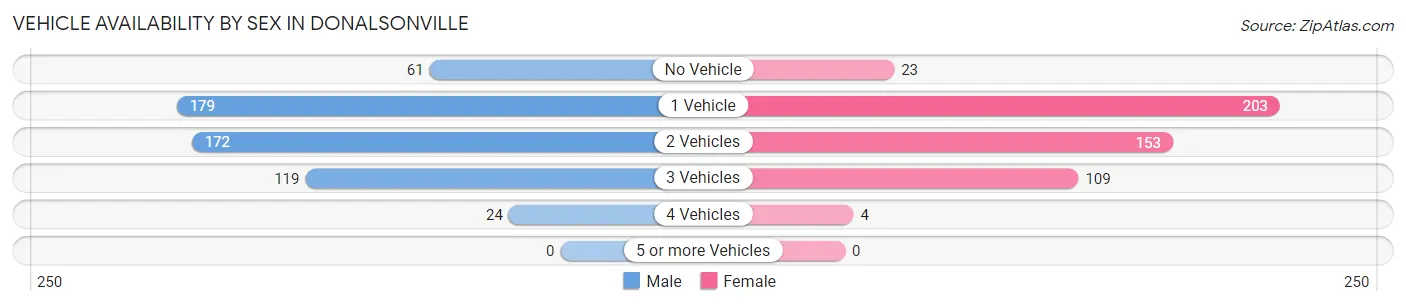
| Vehicles Available | Male | Female |
| No Vehicle | 61 (11.0%) | 23 (4.7%) |
| 1 Vehicle | 179 (32.3%) | 203 (41.3%) |
| 2 Vehicles | 172 (31.0%) | 153 (31.1%) |
| 3 Vehicles | 119 (21.4%) | 109 (22.2%) |
| 4 Vehicles | 24 (4.3%) | 4 (0.8%) |
| 5 or more Vehicles | 0 (0.0%) | 0 (0.0%) |
| Total | 555 (100.0%) | 492 (100.0%) |
Commute Time in Donalsonville
The most frequently occuring commute durations in Donalsonville are 5 to 9 minutes (241 commuters, 23.1%), 10 to 14 minutes (200 commuters, 19.2%), and 30 to 34 minutes (120 commuters, 11.5%).
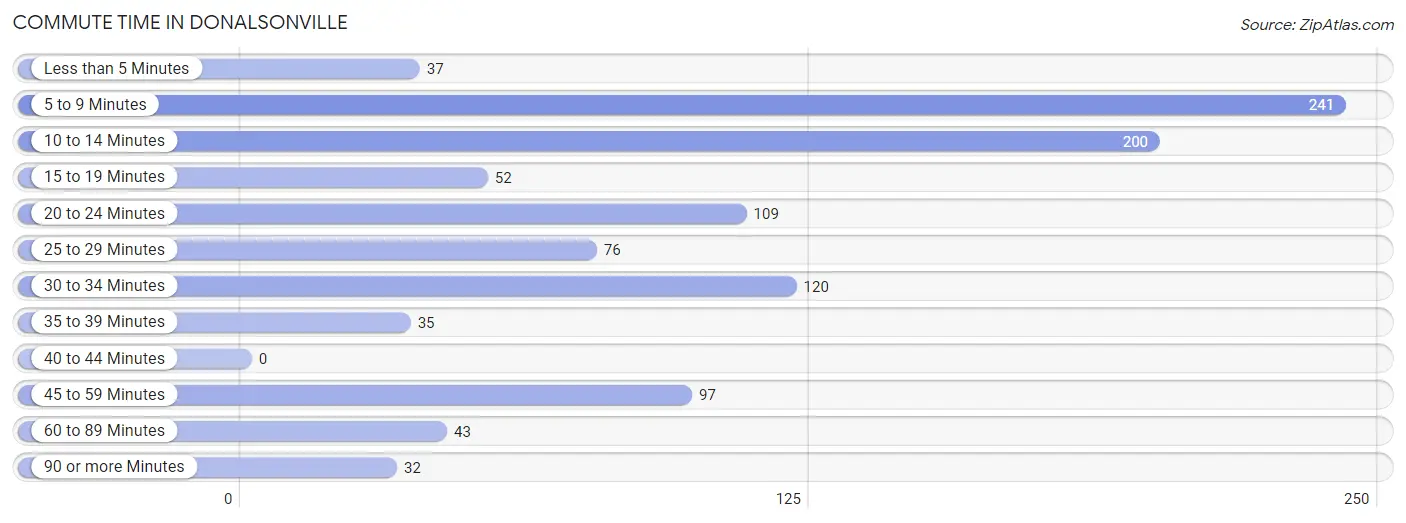
| Commute Time | # Commuters | % Commuters |
| Less than 5 Minutes | 37 | 3.5% |
| 5 to 9 Minutes | 241 | 23.1% |
| 10 to 14 Minutes | 200 | 19.2% |
| 15 to 19 Minutes | 52 | 5.0% |
| 20 to 24 Minutes | 109 | 10.5% |
| 25 to 29 Minutes | 76 | 7.3% |
| 30 to 34 Minutes | 120 | 11.5% |
| 35 to 39 Minutes | 35 | 3.4% |
| 40 to 44 Minutes | 0 | 0.0% |
| 45 to 59 Minutes | 97 | 9.3% |
| 60 to 89 Minutes | 43 | 4.1% |
| 90 or more Minutes | 32 | 3.1% |
Commute Time by Sex in Donalsonville
The most common commute times in Donalsonville are 10 to 14 minutes (139 commuters, 25.1%) for males and 5 to 9 minutes (158 commuters, 32.4%) for females.
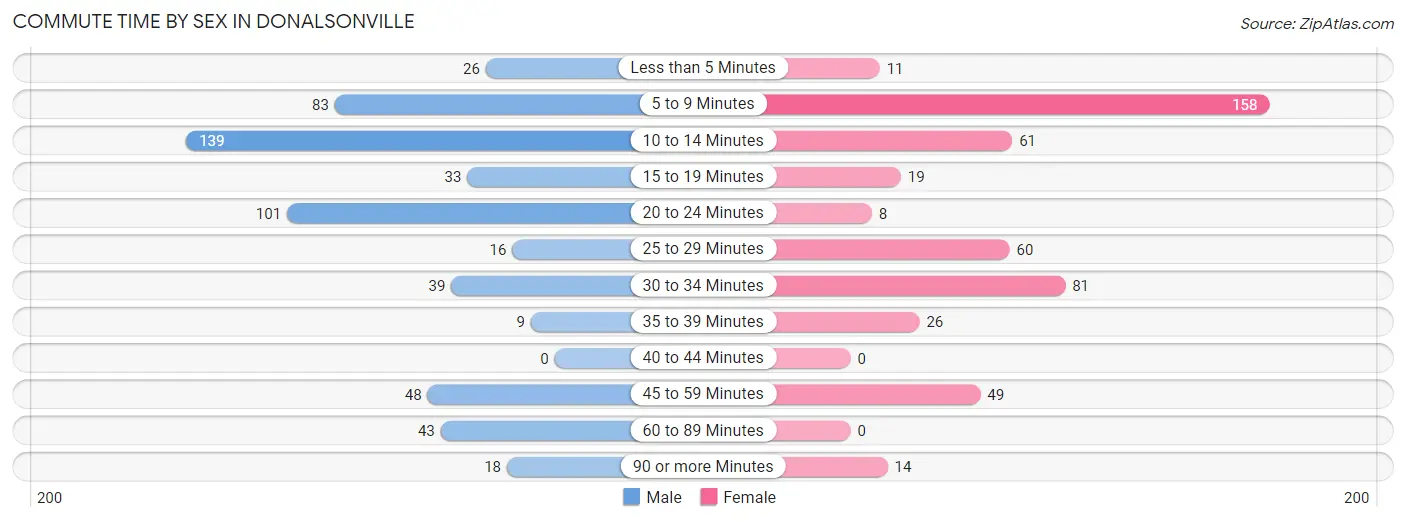
| Commute Time | Male | Female |
| Less than 5 Minutes | 26 (4.7%) | 11 (2.3%) |
| 5 to 9 Minutes | 83 (14.9%) | 158 (32.4%) |
| 10 to 14 Minutes | 139 (25.1%) | 61 (12.5%) |
| 15 to 19 Minutes | 33 (5.9%) | 19 (3.9%) |
| 20 to 24 Minutes | 101 (18.2%) | 8 (1.6%) |
| 25 to 29 Minutes | 16 (2.9%) | 60 (12.3%) |
| 30 to 34 Minutes | 39 (7.0%) | 81 (16.6%) |
| 35 to 39 Minutes | 9 (1.6%) | 26 (5.3%) |
| 40 to 44 Minutes | 0 (0.0%) | 0 (0.0%) |
| 45 to 59 Minutes | 48 (8.6%) | 49 (10.1%) |
| 60 to 89 Minutes | 43 (7.7%) | 0 (0.0%) |
| 90 or more Minutes | 18 (3.2%) | 14 (2.9%) |
Time of Departure to Work by Sex in Donalsonville
The most frequent times of departure to work in Donalsonville are 7:30 AM to 7:59 AM (92, 16.6%) for males and 8:00 AM to 8:29 AM (95, 19.5%) for females.
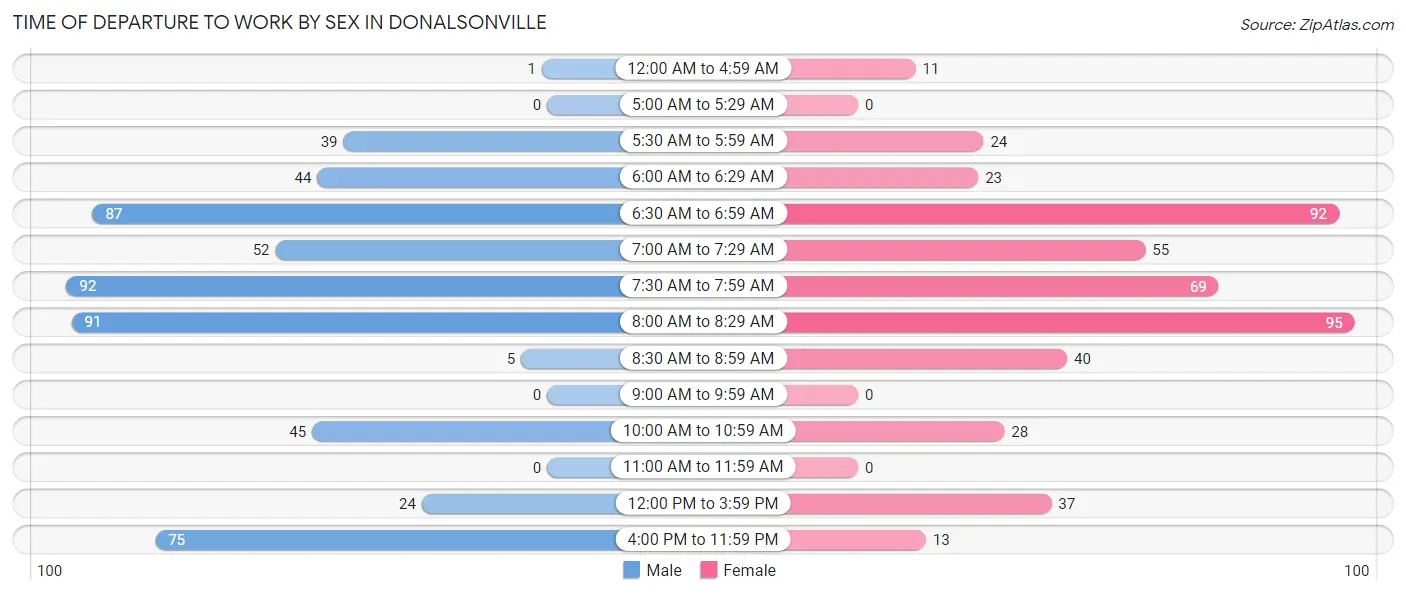
| Time of Departure | Male | Female |
| 12:00 AM to 4:59 AM | 1 (0.2%) | 11 (2.3%) |
| 5:00 AM to 5:29 AM | 0 (0.0%) | 0 (0.0%) |
| 5:30 AM to 5:59 AM | 39 (7.0%) | 24 (4.9%) |
| 6:00 AM to 6:29 AM | 44 (7.9%) | 23 (4.7%) |
| 6:30 AM to 6:59 AM | 87 (15.7%) | 92 (18.9%) |
| 7:00 AM to 7:29 AM | 52 (9.4%) | 55 (11.3%) |
| 7:30 AM to 7:59 AM | 92 (16.6%) | 69 (14.2%) |
| 8:00 AM to 8:29 AM | 91 (16.4%) | 95 (19.5%) |
| 8:30 AM to 8:59 AM | 5 (0.9%) | 40 (8.2%) |
| 9:00 AM to 9:59 AM | 0 (0.0%) | 0 (0.0%) |
| 10:00 AM to 10:59 AM | 45 (8.1%) | 28 (5.8%) |
| 11:00 AM to 11:59 AM | 0 (0.0%) | 0 (0.0%) |
| 12:00 PM to 3:59 PM | 24 (4.3%) | 37 (7.6%) |
| 4:00 PM to 11:59 PM | 75 (13.5%) | 13 (2.7%) |
| Total | 555 (100.0%) | 487 (100.0%) |
Housing Occupancy in Donalsonville
Occupancy by Ownership in Donalsonville
Of the total 1,040 dwellings in Donalsonville, owner-occupied units account for 532 (51.1%), while renter-occupied units make up 508 (48.8%).
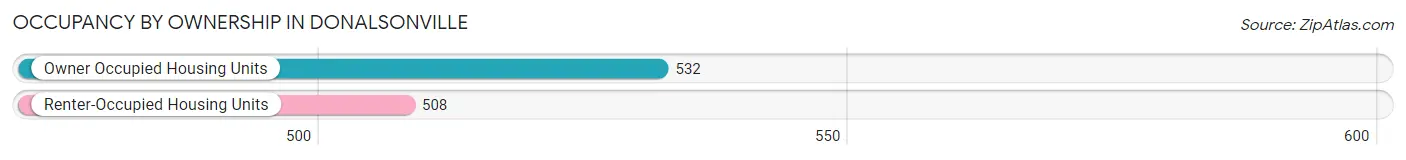
| Occupancy | # Housing Units | % Housing Units |
| Owner Occupied Housing Units | 532 | 51.1% |
| Renter-Occupied Housing Units | 508 | 48.8% |
| Total Occupied Housing Units | 1,040 | 100.0% |
Occupancy by Household Size in Donalsonville
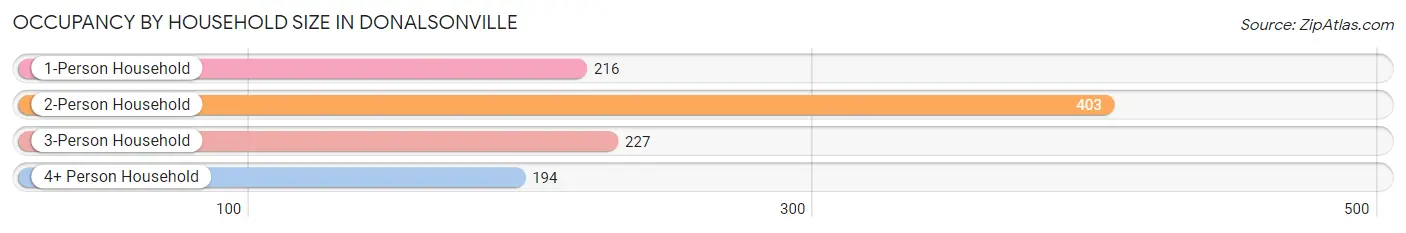
| Household Size | # Housing Units | % Housing Units |
| 1-Person Household | 216 | 20.8% |
| 2-Person Household | 403 | 38.8% |
| 3-Person Household | 227 | 21.8% |
| 4+ Person Household | 194 | 18.6% |
| Total Housing Units | 1,040 | 100.0% |
Occupancy by Ownership by Household Size in Donalsonville
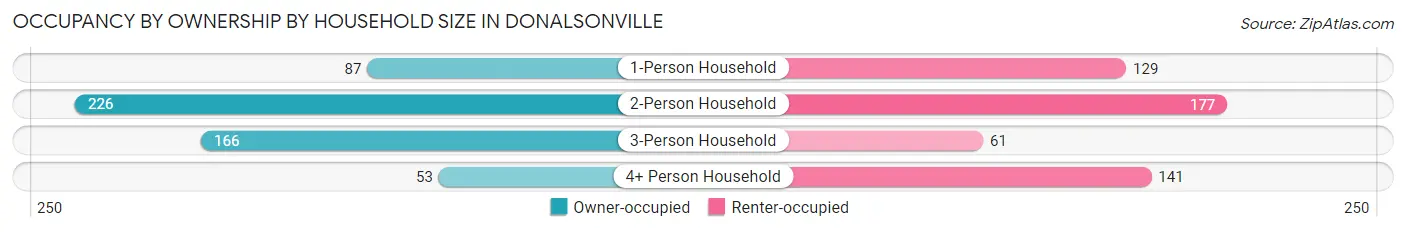
| Household Size | Owner-occupied | Renter-occupied |
| 1-Person Household | 87 (40.3%) | 129 (59.7%) |
| 2-Person Household | 226 (56.1%) | 177 (43.9%) |
| 3-Person Household | 166 (73.1%) | 61 (26.9%) |
| 4+ Person Household | 53 (27.3%) | 141 (72.7%) |
| Total Housing Units | 532 (51.1%) | 508 (48.8%) |
Occupancy by Educational Attainment in Donalsonville
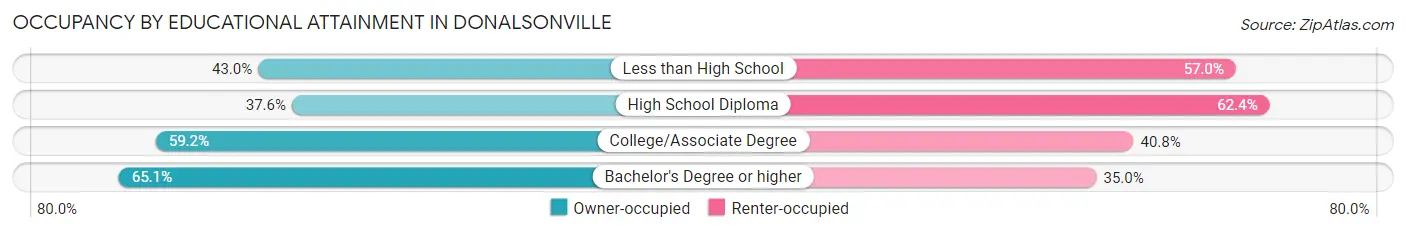
| Household Size | Owner-occupied | Renter-occupied |
| Less than High School | 55 (43.0%) | 73 (57.0%) |
| High School Diploma | 120 (37.6%) | 199 (62.4%) |
| College/Associate Degree | 290 (59.2%) | 200 (40.8%) |
| Bachelor's Degree or higher | 67 (65.0%) | 36 (34.9%) |
Occupancy by Age of Householder in Donalsonville
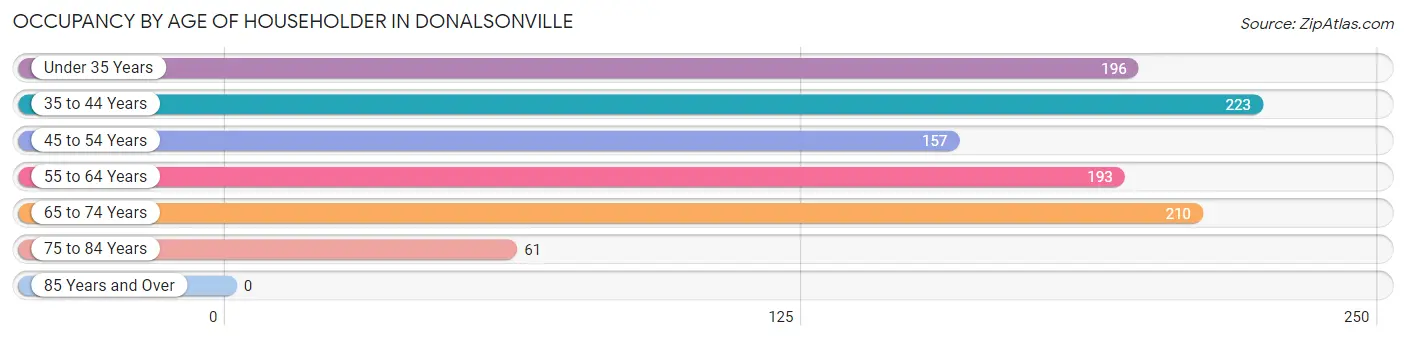
| Age Bracket | # Households | % Households |
| Under 35 Years | 196 | 18.9% |
| 35 to 44 Years | 223 | 21.4% |
| 45 to 54 Years | 157 | 15.1% |
| 55 to 64 Years | 193 | 18.6% |
| 65 to 74 Years | 210 | 20.2% |
| 75 to 84 Years | 61 | 5.9% |
| 85 Years and Over | 0 | 0.0% |
| Total | 1,040 | 100.0% |
Housing Finances in Donalsonville
Median Income by Occupancy in Donalsonville
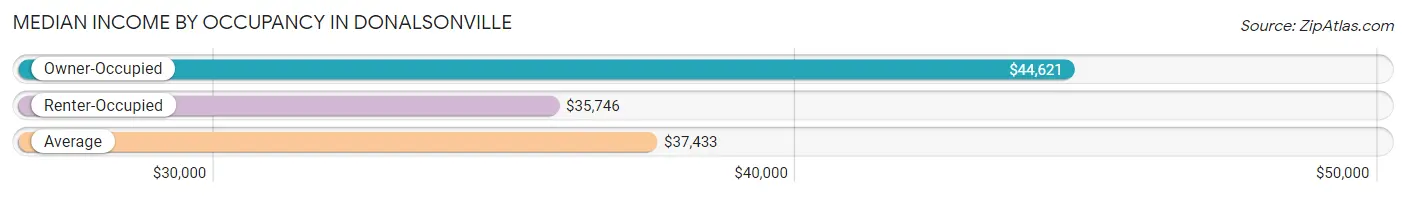
| Occupancy Type | # Households | Median Income |
| Owner-Occupied | 532 (51.1%) | $44,621 |
| Renter-Occupied | 508 (48.8%) | $35,746 |
| Average | 1,040 (100.0%) | $37,433 |
Occupancy by Householder Income Bracket in Donalsonville
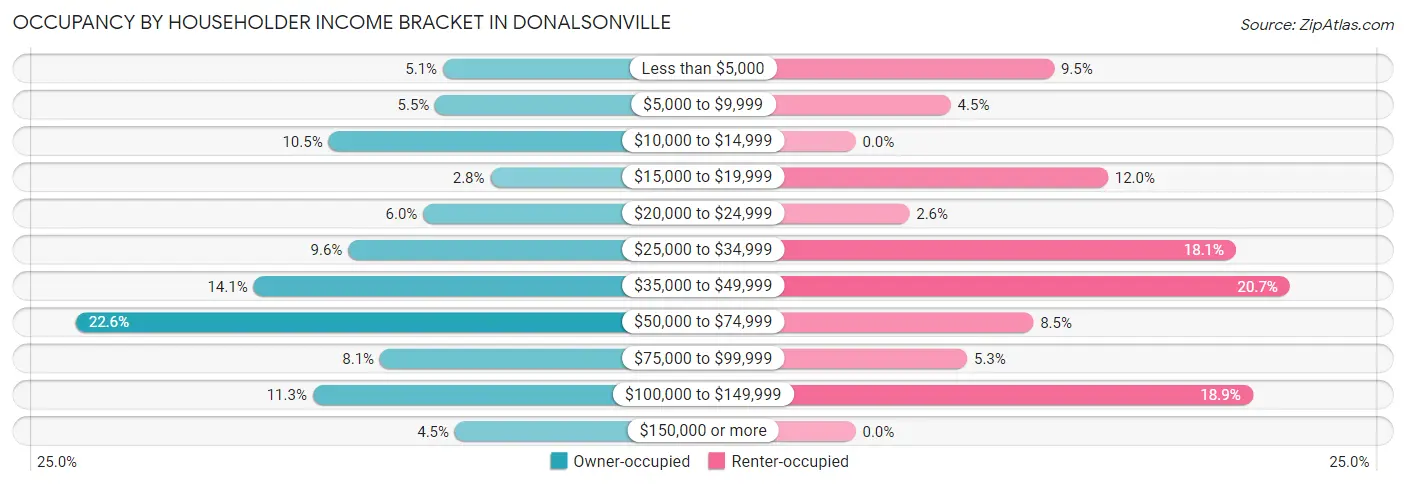
| Income Bracket | Owner-occupied | Renter-occupied |
| Less than $5,000 | 27 (5.1%) | 48 (9.5%) |
| $5,000 to $9,999 | 29 (5.4%) | 23 (4.5%) |
| $10,000 to $14,999 | 56 (10.5%) | 0 (0.0%) |
| $15,000 to $19,999 | 15 (2.8%) | 61 (12.0%) |
| $20,000 to $24,999 | 32 (6.0%) | 13 (2.6%) |
| $25,000 to $34,999 | 51 (9.6%) | 92 (18.1%) |
| $35,000 to $49,999 | 75 (14.1%) | 105 (20.7%) |
| $50,000 to $74,999 | 120 (22.6%) | 43 (8.5%) |
| $75,000 to $99,999 | 43 (8.1%) | 27 (5.3%) |
| $100,000 to $149,999 | 60 (11.3%) | 96 (18.9%) |
| $150,000 or more | 24 (4.5%) | 0 (0.0%) |
| Total | 532 (100.0%) | 508 (100.0%) |
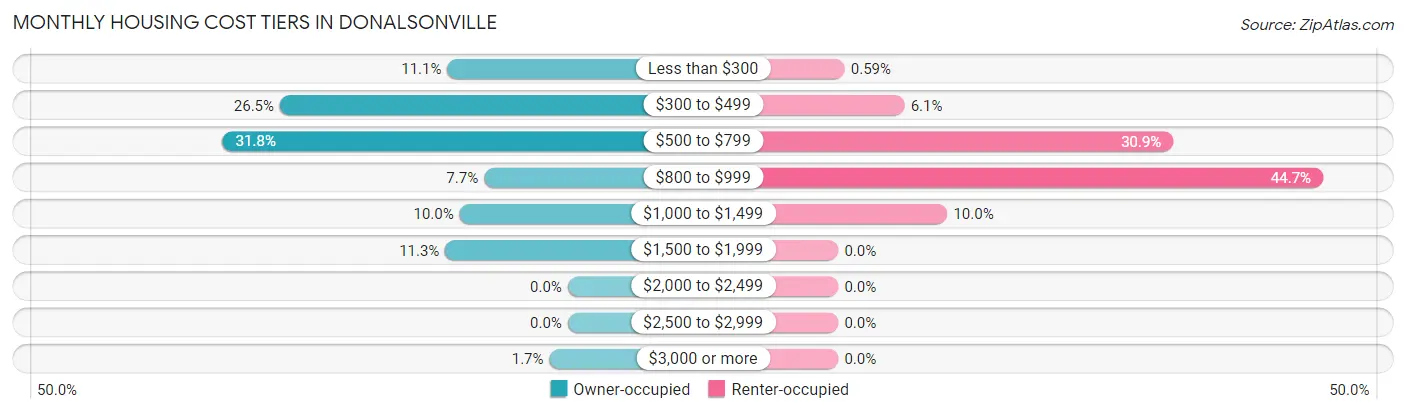
Monthly Housing Cost Tiers in Donalsonville
| Monthly Cost | Owner-occupied | Renter-occupied |
| Less than $300 | 59 (11.1%) | 3 (0.6%) |
| $300 to $499 | 141 (26.5%) | 31 (6.1%) |
| $500 to $799 | 169 (31.8%) | 157 (30.9%) |
| $800 to $999 | 41 (7.7%) | 227 (44.7%) |
| $1,000 to $1,499 | 53 (10.0%) | 51 (10.0%) |
| $1,500 to $1,999 | 60 (11.3%) | 0 (0.0%) |
| $2,000 to $2,499 | 0 (0.0%) | 0 (0.0%) |
| $2,500 to $2,999 | 0 (0.0%) | 0 (0.0%) |
| $3,000 or more | 9 (1.7%) | 0 (0.0%) |
| Total | 532 (100.0%) | 508 (100.0%) |
Physical Housing Characteristics in Donalsonville
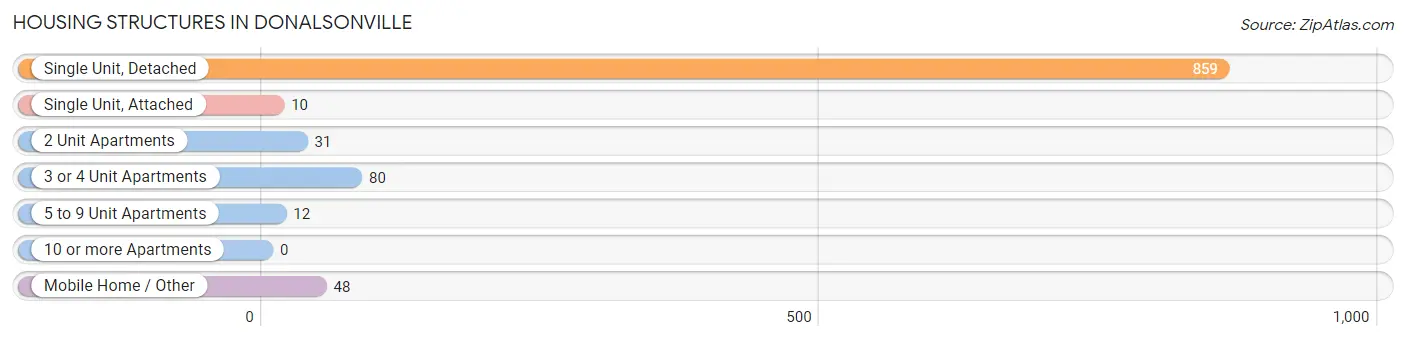
Housing Structures in Donalsonville
| Structure Type | # Housing Units | % Housing Units |
| Single Unit, Detached | 859 | 82.6% |
| Single Unit, Attached | 10 | 1.0% |
| 2 Unit Apartments | 31 | 3.0% |
| 3 or 4 Unit Apartments | 80 | 7.7% |
| 5 to 9 Unit Apartments | 12 | 1.1% |
| 10 or more Apartments | 0 | 0.0% |
| Mobile Home / Other | 48 | 4.6% |
| Total | 1,040 | 100.0% |
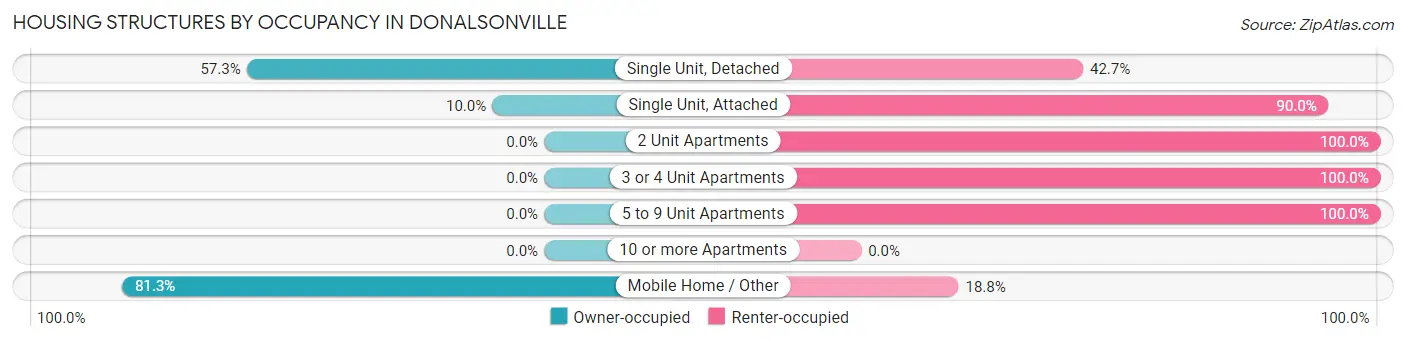
Housing Structures by Occupancy in Donalsonville
| Structure Type | Owner-occupied | Renter-occupied |
| Single Unit, Detached | 492 (57.3%) | 367 (42.7%) |
| Single Unit, Attached | 1 (10.0%) | 9 (90.0%) |
| 2 Unit Apartments | 0 (0.0%) | 31 (100.0%) |
| 3 or 4 Unit Apartments | 0 (0.0%) | 80 (100.0%) |
| 5 to 9 Unit Apartments | 0 (0.0%) | 12 (100.0%) |
| 10 or more Apartments | 0 (0.0%) | 0 (0.0%) |
| Mobile Home / Other | 39 (81.2%) | 9 (18.8%) |
| Total | 532 (51.1%) | 508 (48.8%) |
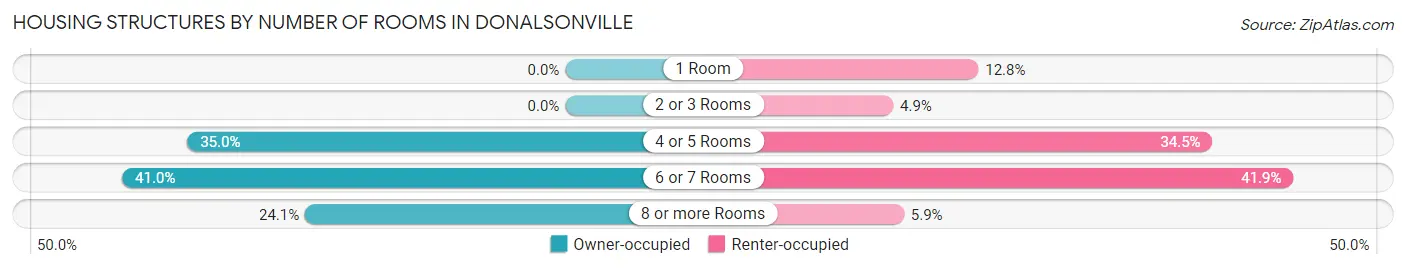
Housing Structures by Number of Rooms in Donalsonville
| Number of Rooms | Owner-occupied | Renter-occupied |
| 1 Room | 0 (0.0%) | 65 (12.8%) |
| 2 or 3 Rooms | 0 (0.0%) | 25 (4.9%) |
| 4 or 5 Rooms | 186 (35.0%) | 175 (34.4%) |
| 6 or 7 Rooms | 218 (41.0%) | 213 (41.9%) |
| 8 or more Rooms | 128 (24.1%) | 30 (5.9%) |
| Total | 532 (100.0%) | 508 (100.0%) |
Housing Structure by Heating Type in Donalsonville
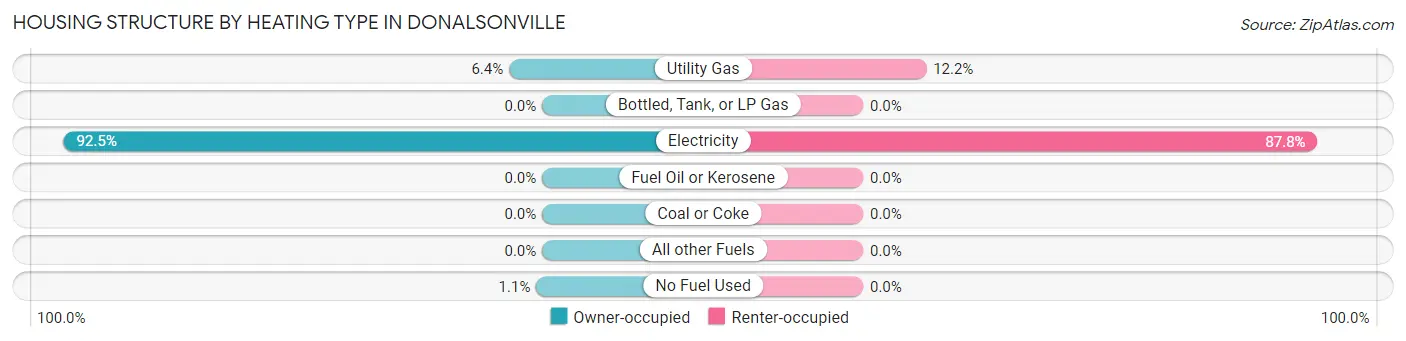
| Heating Type | Owner-occupied | Renter-occupied |
| Utility Gas | 34 (6.4%) | 62 (12.2%) |
| Bottled, Tank, or LP Gas | 0 (0.0%) | 0 (0.0%) |
| Electricity | 492 (92.5%) | 446 (87.8%) |
| Fuel Oil or Kerosene | 0 (0.0%) | 0 (0.0%) |
| Coal or Coke | 0 (0.0%) | 0 (0.0%) |
| All other Fuels | 0 (0.0%) | 0 (0.0%) |
| No Fuel Used | 6 (1.1%) | 0 (0.0%) |
| Total | 532 (100.0%) | 508 (100.0%) |
Household Vehicle Usage in Donalsonville
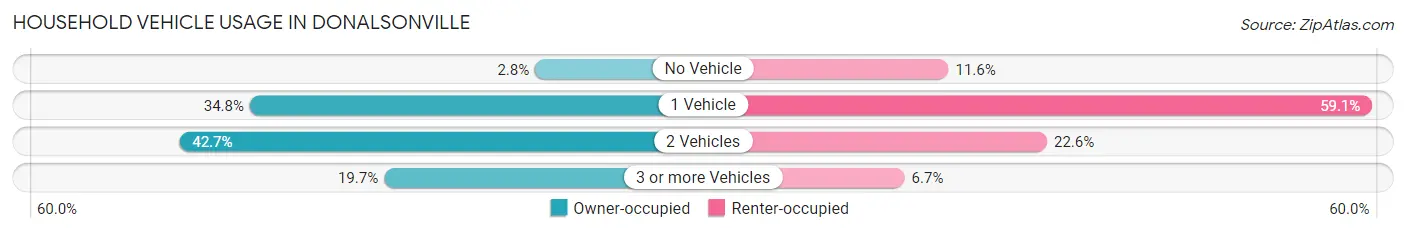
| Vehicles per Household | Owner-occupied | Renter-occupied |
| No Vehicle | 15 (2.8%) | 59 (11.6%) |
| 1 Vehicle | 185 (34.8%) | 300 (59.1%) |
| 2 Vehicles | 227 (42.7%) | 115 (22.6%) |
| 3 or more Vehicles | 105 (19.7%) | 34 (6.7%) |
| Total | 532 (100.0%) | 508 (100.0%) |
Real Estate & Mortgages in Donalsonville
Real Estate and Mortgage Overview in Donalsonville
| Characteristic | Without Mortgage | With Mortgage |
| Housing Units | 312 | 220 |
| Median Property Value | $103,300 | $108,900 |
| Median Household Income | $37,361 | $12 |
| Monthly Housing Costs | $442 | $9 |
| Real Estate Taxes | $1,744 | $0 |
Property Value by Mortgage Status in Donalsonville
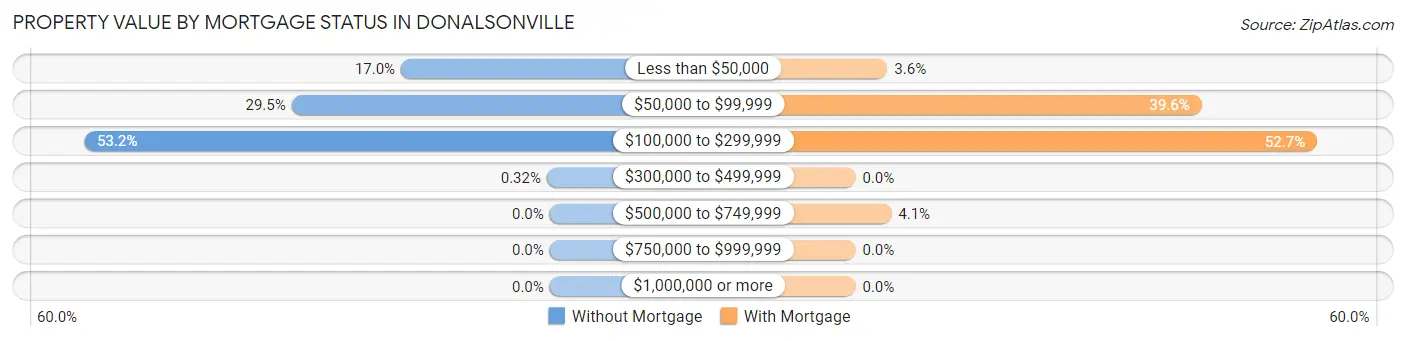
| Property Value | Without Mortgage | With Mortgage |
| Less than $50,000 | 53 (17.0%) | 8 (3.6%) |
| $50,000 to $99,999 | 92 (29.5%) | 87 (39.6%) |
| $100,000 to $299,999 | 166 (53.2%) | 116 (52.7%) |
| $300,000 to $499,999 | 1 (0.3%) | 0 (0.0%) |
| $500,000 to $749,999 | 0 (0.0%) | 9 (4.1%) |
| $750,000 to $999,999 | 0 (0.0%) | 0 (0.0%) |
| $1,000,000 or more | 0 (0.0%) | 0 (0.0%) |
| Total | 312 (100.0%) | 220 (100.0%) |
Household Income by Mortgage Status in Donalsonville
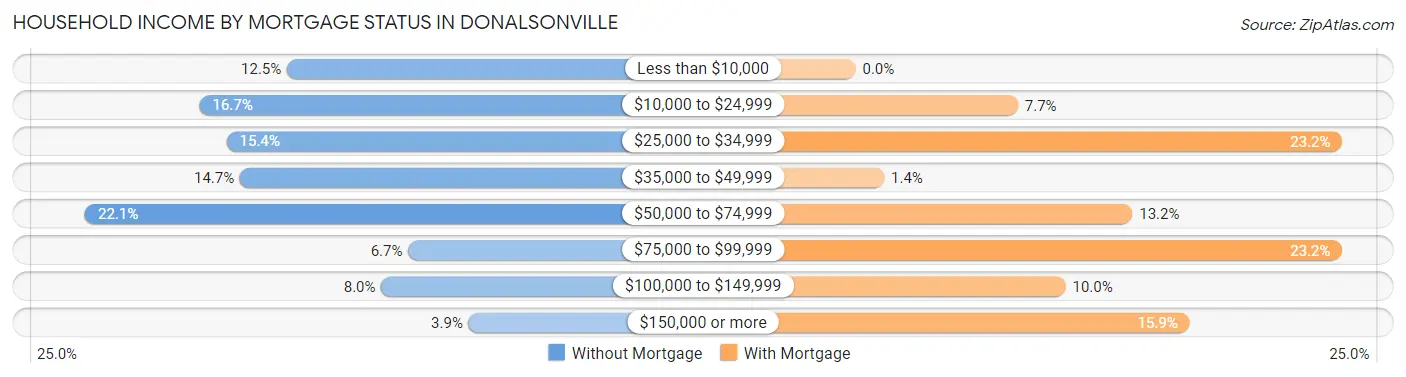
| Household Income | Without Mortgage | With Mortgage |
| Less than $10,000 | 39 (12.5%) | 0 (0.0%) |
| $10,000 to $24,999 | 52 (16.7%) | 17 (7.7%) |
| $25,000 to $34,999 | 48 (15.4%) | 51 (23.2%) |
| $35,000 to $49,999 | 46 (14.7%) | 3 (1.4%) |
| $50,000 to $74,999 | 69 (22.1%) | 29 (13.2%) |
| $75,000 to $99,999 | 21 (6.7%) | 51 (23.2%) |
| $100,000 to $149,999 | 25 (8.0%) | 22 (10.0%) |
| $150,000 or more | 12 (3.8%) | 35 (15.9%) |
| Total | 312 (100.0%) | 220 (100.0%) |
Property Value to Household Income Ratio in Donalsonville
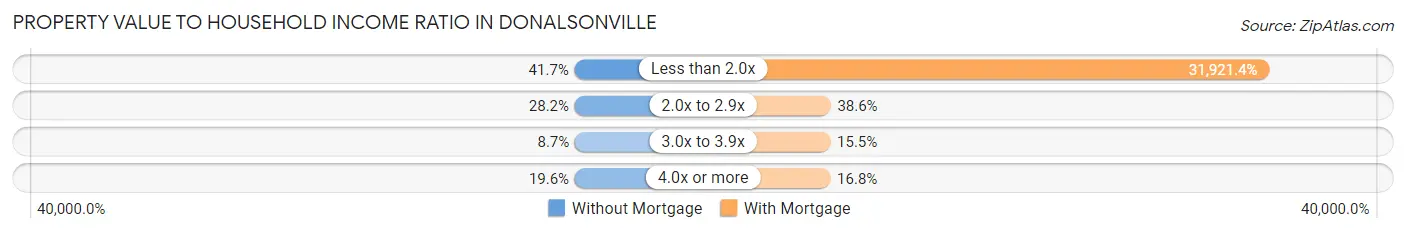
| Value-to-Income Ratio | Without Mortgage | With Mortgage |
| Less than 2.0x | 130 (41.7%) | 70,227 (31,921.4%) |
| 2.0x to 2.9x | 88 (28.2%) | 85 (38.6%) |
| 3.0x to 3.9x | 27 (8.6%) | 34 (15.4%) |
| 4.0x or more | 61 (19.6%) | 37 (16.8%) |
| Total | 312 (100.0%) | 220 (100.0%) |
Real Estate Taxes by Mortgage Status in Donalsonville
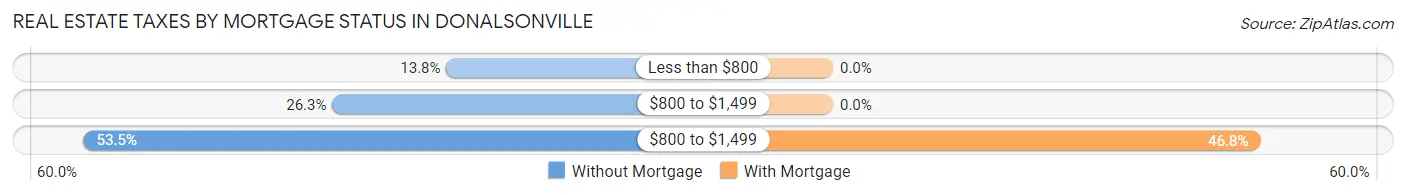
| Property Taxes | Without Mortgage | With Mortgage |
| Less than $800 | 43 (13.8%) | 0 (0.0%) |
| $800 to $1,499 | 82 (26.3%) | 0 (0.0%) |
| $800 to $1,499 | 167 (53.5%) | 103 (46.8%) |
| Total | 312 (100.0%) | 220 (100.0%) |
Health & Disability in Donalsonville
Health Insurance Coverage by Age in Donalsonville
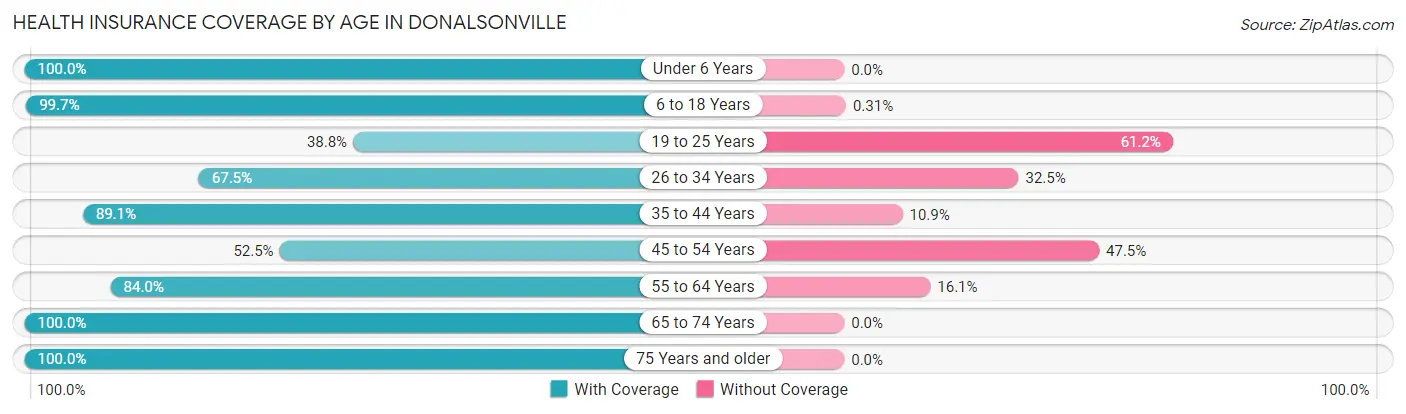
| Age Bracket | With Coverage | Without Coverage |
| Under 6 Years | 159 (100.0%) | 0 (0.0%) |
| 6 to 18 Years | 646 (99.7%) | 2 (0.3%) |
| 19 to 25 Years | 126 (38.8%) | 199 (61.2%) |
| 26 to 34 Years | 162 (67.5%) | 78 (32.5%) |
| 35 to 44 Years | 271 (89.1%) | 33 (10.9%) |
| 45 to 54 Years | 159 (52.5%) | 144 (47.5%) |
| 55 to 64 Years | 204 (84.0%) | 39 (16.1%) |
| 65 to 74 Years | 368 (100.0%) | 0 (0.0%) |
| 75 Years and older | 120 (100.0%) | 0 (0.0%) |
| Total | 2,215 (81.7%) | 495 (18.3%) |
Health Insurance Coverage by Citizenship Status in Donalsonville
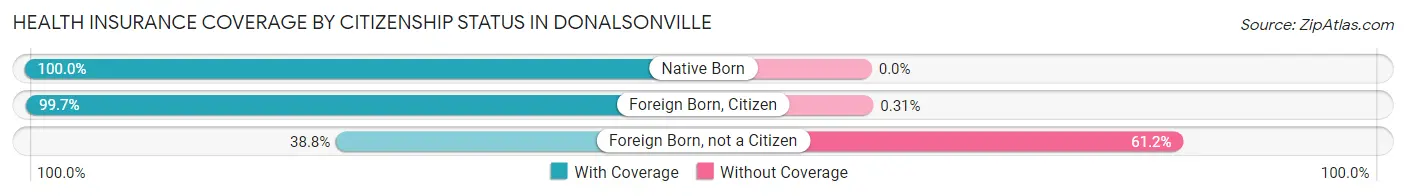
| Citizenship Status | With Coverage | Without Coverage |
| Native Born | 159 (100.0%) | 0 (0.0%) |
| Foreign Born, Citizen | 646 (99.7%) | 2 (0.3%) |
| Foreign Born, not a Citizen | 126 (38.8%) | 199 (61.2%) |
Health Insurance Coverage by Household Income in Donalsonville
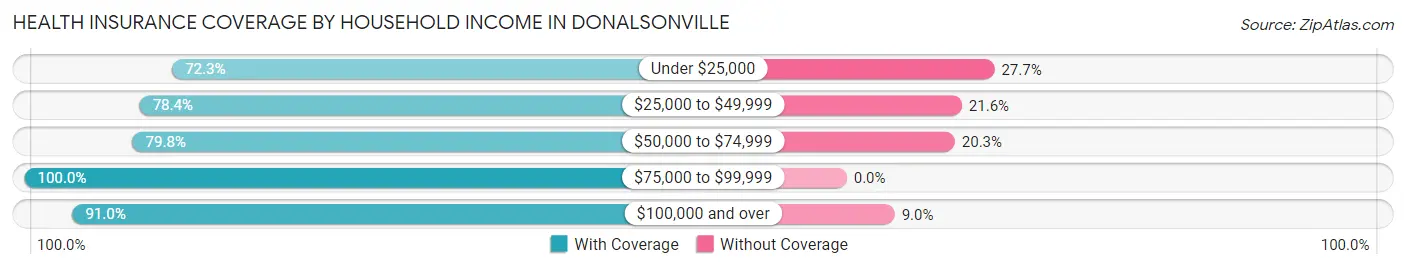
| Household Income | With Coverage | Without Coverage |
| Under $25,000 | 434 (72.3%) | 166 (27.7%) |
| $25,000 to $49,999 | 611 (78.4%) | 168 (21.6%) |
| $50,000 to $74,999 | 382 (79.7%) | 97 (20.3%) |
| $75,000 to $99,999 | 139 (100.0%) | 0 (0.0%) |
| $100,000 and over | 649 (91.0%) | 64 (9.0%) |
Public vs Private Health Insurance Coverage by Age in Donalsonville
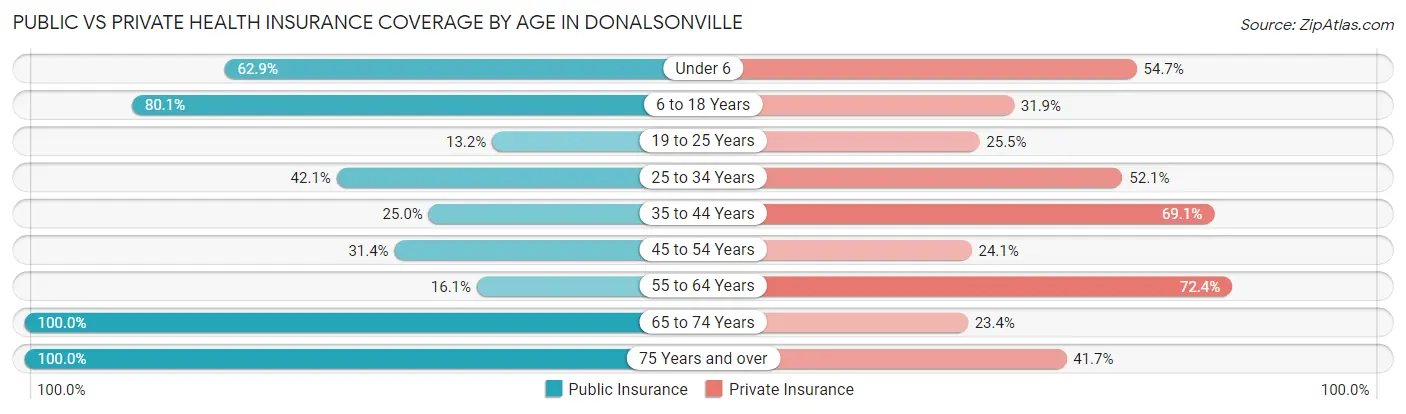
| Age Bracket | Public Insurance | Private Insurance |
| Under 6 | 100 (62.9%) | 87 (54.7%) |
| 6 to 18 Years | 519 (80.1%) | 207 (31.9%) |
| 19 to 25 Years | 43 (13.2%) | 83 (25.5%) |
| 25 to 34 Years | 101 (42.1%) | 125 (52.1%) |
| 35 to 44 Years | 76 (25.0%) | 210 (69.1%) |
| 45 to 54 Years | 95 (31.4%) | 73 (24.1%) |
| 55 to 64 Years | 39 (16.1%) | 176 (72.4%) |
| 65 to 74 Years | 368 (100.0%) | 86 (23.4%) |
| 75 Years and over | 120 (100.0%) | 50 (41.7%) |
| Total | 1,461 (53.9%) | 1,097 (40.5%) |
Disability Status by Sex by Age in Donalsonville
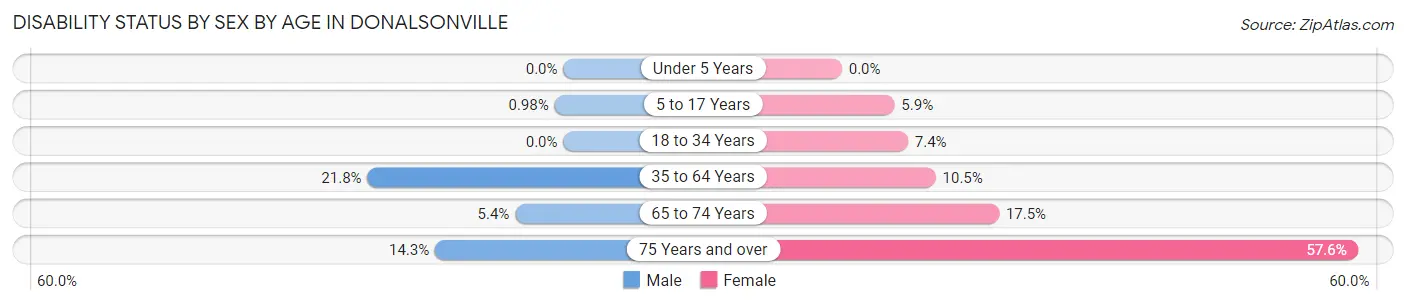
| Age Bracket | Male | Female |
| Under 5 Years | 0 (0.0%) | 0 (0.0%) |
| 5 to 17 Years | 4 (1.0%) | 13 (5.9%) |
| 18 to 34 Years | 0 (0.0%) | 22 (7.4%) |
| 35 to 64 Years | 79 (21.8%) | 51 (10.4%) |
| 65 to 74 Years | 9 (5.4%) | 35 (17.5%) |
| 75 Years and over | 2 (14.3%) | 61 (57.6%) |
Disability Class by Sex by Age in Donalsonville
Disability Class: Hearing Difficulty
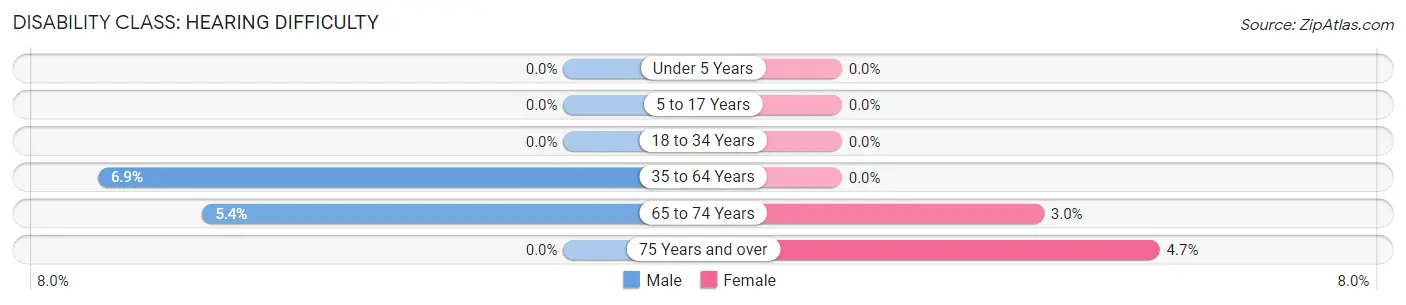
| Age Bracket | Male | Female |
| Under 5 Years | 0 (0.0%) | 0 (0.0%) |
| 5 to 17 Years | 0 (0.0%) | 0 (0.0%) |
| 18 to 34 Years | 0 (0.0%) | 0 (0.0%) |
| 35 to 64 Years | 25 (6.9%) | 0 (0.0%) |
| 65 to 74 Years | 9 (5.4%) | 6 (3.0%) |
| 75 Years and over | 0 (0.0%) | 5 (4.7%) |
Disability Class: Vision Difficulty
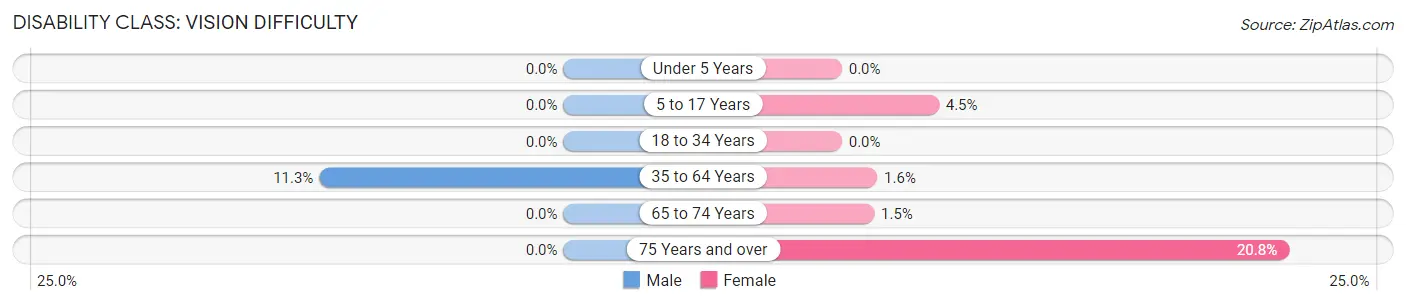
| Age Bracket | Male | Female |
| Under 5 Years | 0 (0.0%) | 0 (0.0%) |
| 5 to 17 Years | 0 (0.0%) | 10 (4.5%) |
| 18 to 34 Years | 0 (0.0%) | 0 (0.0%) |
| 35 to 64 Years | 41 (11.3%) | 8 (1.6%) |
| 65 to 74 Years | 0 (0.0%) | 3 (1.5%) |
| 75 Years and over | 0 (0.0%) | 22 (20.7%) |
Disability Class: Cognitive Difficulty
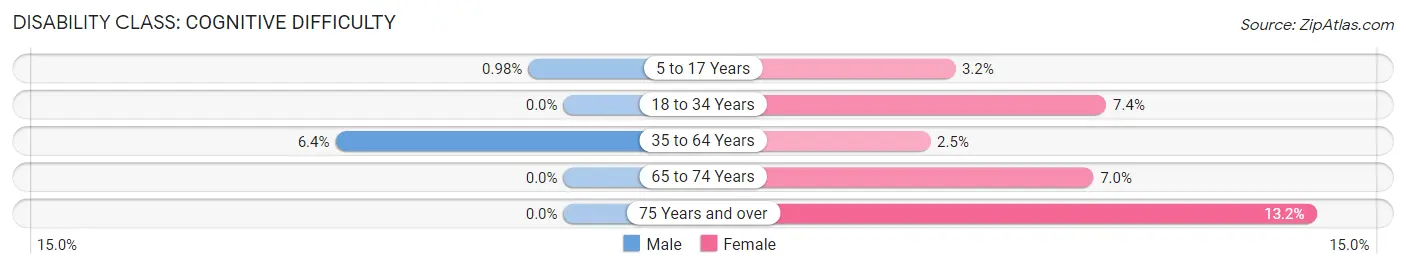
| Age Bracket | Male | Female |
| 5 to 17 Years | 4 (1.0%) | 7 (3.2%) |
| 18 to 34 Years | 0 (0.0%) | 22 (7.4%) |
| 35 to 64 Years | 23 (6.4%) | 12 (2.5%) |
| 65 to 74 Years | 0 (0.0%) | 14 (7.0%) |
| 75 Years and over | 0 (0.0%) | 14 (13.2%) |
Disability Class: Ambulatory Difficulty
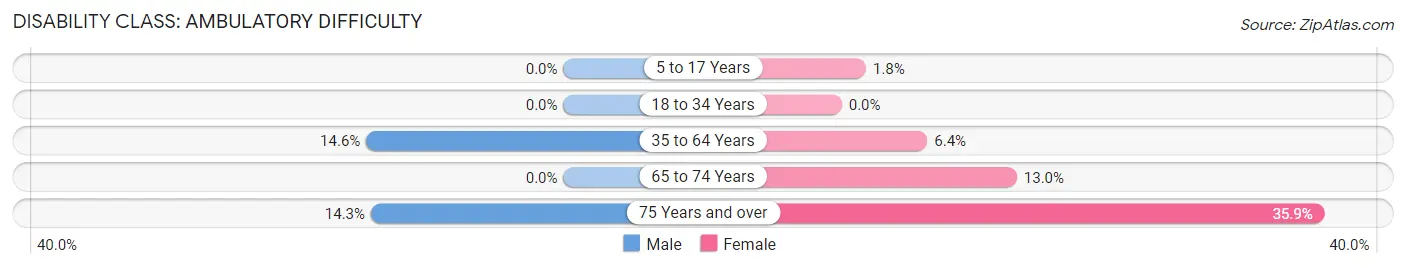
| Age Bracket | Male | Female |
| 5 to 17 Years | 0 (0.0%) | 4 (1.8%) |
| 18 to 34 Years | 0 (0.0%) | 0 (0.0%) |
| 35 to 64 Years | 53 (14.6%) | 31 (6.4%) |
| 65 to 74 Years | 0 (0.0%) | 26 (13.0%) |
| 75 Years and over | 2 (14.3%) | 38 (35.8%) |
Disability Class: Self-Care Difficulty
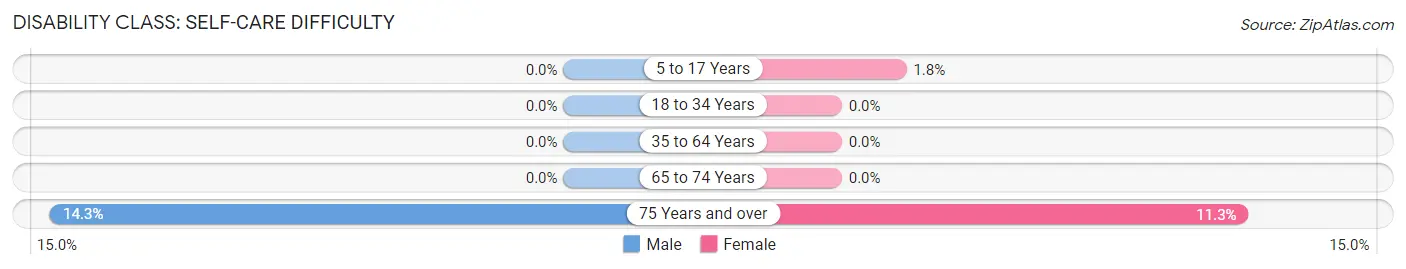
| Age Bracket | Male | Female |
| 5 to 17 Years | 0 (0.0%) | 4 (1.8%) |
| 18 to 34 Years | 0 (0.0%) | 0 (0.0%) |
| 35 to 64 Years | 0 (0.0%) | 0 (0.0%) |
| 65 to 74 Years | 0 (0.0%) | 0 (0.0%) |
| 75 Years and over | 2 (14.3%) | 12 (11.3%) |
Technology Access in Donalsonville
Computing Device Access in Donalsonville
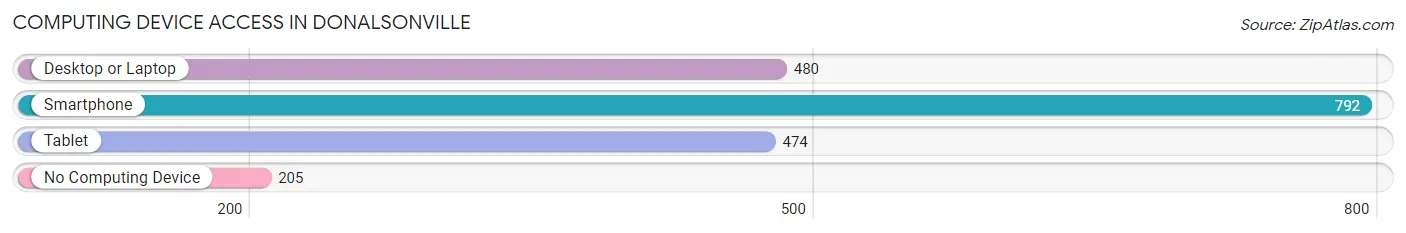
| Device Type | # Households | % Households |
| Desktop or Laptop | 480 | 46.2% |
| Smartphone | 792 | 76.1% |
| Tablet | 474 | 45.6% |
| No Computing Device | 205 | 19.7% |
| Total | 1,040 | 100.0% |
Internet Access in Donalsonville
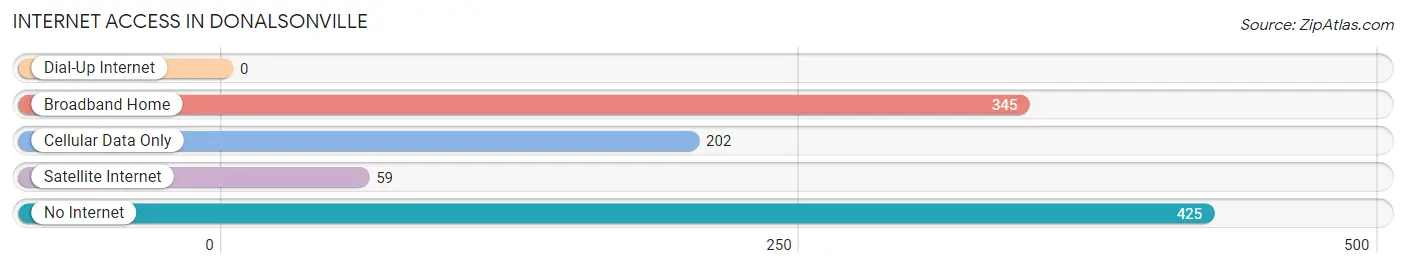
| Internet Type | # Households | % Households |
| Dial-Up Internet | 0 | 0.0% |
| Broadband Home | 345 | 33.2% |
| Cellular Data Only | 202 | 19.4% |
| Satellite Internet | 59 | 5.7% |
| No Internet | 425 | 40.9% |
| Total | 1,040 | 100.0% |
Donalsonville Summary
Donalsonville, Georgia is a small town located in the southwestern corner of the state, near the Florida border. It is the county seat of Seminole County and is part of the Tallahassee, Florida metropolitan area. The town has a population of 2,717 people, according to the 2010 census.
History
Donalsonville was founded in 1891 by William Donalson, a former Confederate soldier. The town was named after him and was incorporated in 1895. Donalsonville was originally a farming community, but it soon became a center for the timber industry. The town was also home to a number of sawmills and turpentine stills.
In the early 20th century, Donalsonville began to experience a period of growth and development. The town was connected to the rest of the state by the Georgia and Florida Railroad in 1906. This allowed for the transportation of goods and services to and from the town.
In the 1920s, Donalsonville was home to a number of businesses, including a bank, a hotel, a movie theater, and a number of stores. The town also had a number of churches, including the First Baptist Church, which was founded in 1891.
In the 1950s, Donalsonville experienced a period of decline. The timber industry began to decline, and the town’s population began to decrease. In the 1970s, the town began to experience a period of revitalization. The town was connected to the rest of the state by the Donalsonville-Seminole County Airport in 1975.
Geography
Donalsonville is located in the southwestern corner of Georgia, near the Florida border. The town is situated on the banks of the Chattahoochee River. The town is located in the flatwoods region of the state, and the terrain is mostly flat. The town is located in the humid subtropical climate zone, and the average temperature in the summer is around 90 degrees Fahrenheit.
Economy
Donalsonville’s economy is largely based on agriculture and timber. The town is home to a number of farms, and the timber industry is still a major part of the local economy. The town is also home to a number of businesses, including a bank, a hotel, a movie theater, and a number of stores.
Demographics
According to the 2010 census, Donalsonville has a population of 2,717 people. The town has a median household income of $30,938, and the median age is 39. The town is predominantly white, with African Americans making up about 20% of the population. The town also has a small Hispanic population, making up about 5% of the population.
Common Questions
What is Per Capita Income in Donalsonville?
Per Capita income in Donalsonville is $21,557.
What is the Median Family Income in Donalsonville?
Median Family Income in Donalsonville is $42,875.
What is the Median Household income in Donalsonville?
Median Household Income in Donalsonville is $37,433.
What is Income or Wage Gap in Donalsonville?
Income or Wage Gap in Donalsonville is 16.9%.
Women in Donalsonville earn 83.1 cents for every dollar earned by a man.
What is Inequality or Gini Index in Donalsonville?
Inequality or Gini Index in Donalsonville is 0.47.
What is the Total Population of Donalsonville?
Total Population of Donalsonville is 2,824.
What is the Total Male Population of Donalsonville?
Total Male Population of Donalsonville is 1,387.
What is the Total Female Population of Donalsonville?
Total Female Population of Donalsonville is 1,437.
What is the Ratio of Males per 100 Females in Donalsonville?
There are 96.52 Males per 100 Females in Donalsonville.
What is the Ratio of Females per 100 Males in Donalsonville?
There are 103.60 Females per 100 Males in Donalsonville.
What is the Median Population Age in Donalsonville?
Median Population Age in Donalsonville is 35.8 Years.
What is the Average Family Size in Donalsonville
Average Family Size in Donalsonville is 3.0 People.
What is the Average Household Size in Donalsonville
Average Household Size in Donalsonville is 2.6 People.
How Large is the Labor Force in Donalsonville?
There are 1,125 People in the Labor Forcein in Donalsonville.
What is the Percentage of People in the Labor Force in Donalsonville?
52.7% of People are in the Labor Force in Donalsonville.
What is the Unemployment Rate in Donalsonville?
Unemployment Rate in Donalsonville is 6.0%.