Harrison, GA Map & Demographics
Harrison Map
Harrison Overview
$15,253
PER CAPITA INCOME
$33,250
AVG FAMILY INCOME
$32,569
AVG HOUSEHOLD INCOME
28.8%
WAGE / INCOME GAP [ % ]
71.2¢/ $1
WAGE / INCOME GAP [ $ ]
0.43
INEQUALITY / GINI INDEX
345
TOTAL POPULATION
193
MALE POPULATION
152
FEMALE POPULATION
126.97
MALES / 100 FEMALES
78.76
FEMALES / 100 MALES
46.2
MEDIAN AGE
3.3
AVG FAMILY SIZE
2.3
AVG HOUSEHOLD SIZE
116
LABOR FORCE [ PEOPLE ]
40.8%
PERCENT IN LABOR FORCE
3.4%
UNEMPLOYMENT RATE
Harrison Zip Codes
Income in Harrison
Income Overview in Harrison
Per Capita Income in Harrison is $15,253, while median incomes of families and households are $33,250 and $32,569 respectively.
| Characteristic | Number | Measure |
| Per Capita Income | 345 | $15,253 |
| Median Family Income | 66 | $33,250 |
| Mean Family Income | 66 | $37,524 |
| Median Household Income | 150 | $32,569 |
| Mean Household Income | 150 | $30,363 |
| Income Deficit | 66 | $0 |
| Wage / Income Gap (%) | 345 | 28.78% |
| Wage / Income Gap ($) | 345 | 71.22¢ per $1 |
| Gini / Inequality Index | 345 | 0.43 |
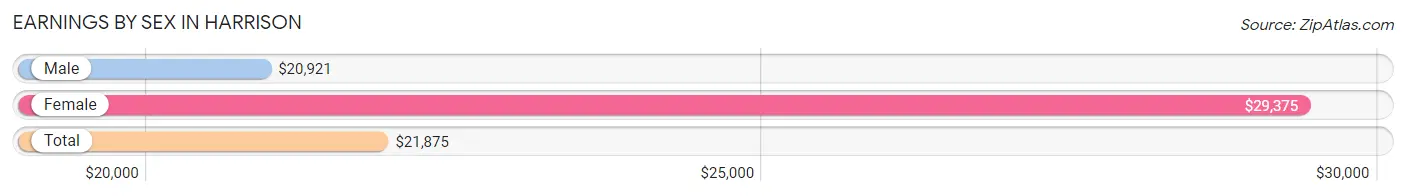
Earnings by Sex in Harrison
Average Earnings in Harrison are $21,875, $20,921 for men and $29,375 for women, a difference of 28.8%.
| Sex | Number | Average Earnings |
| Male | 94 (67.1%) | $20,921 |
| Female | 46 (32.9%) | $29,375 |
| Total | 140 (100.0%) | $21,875 |
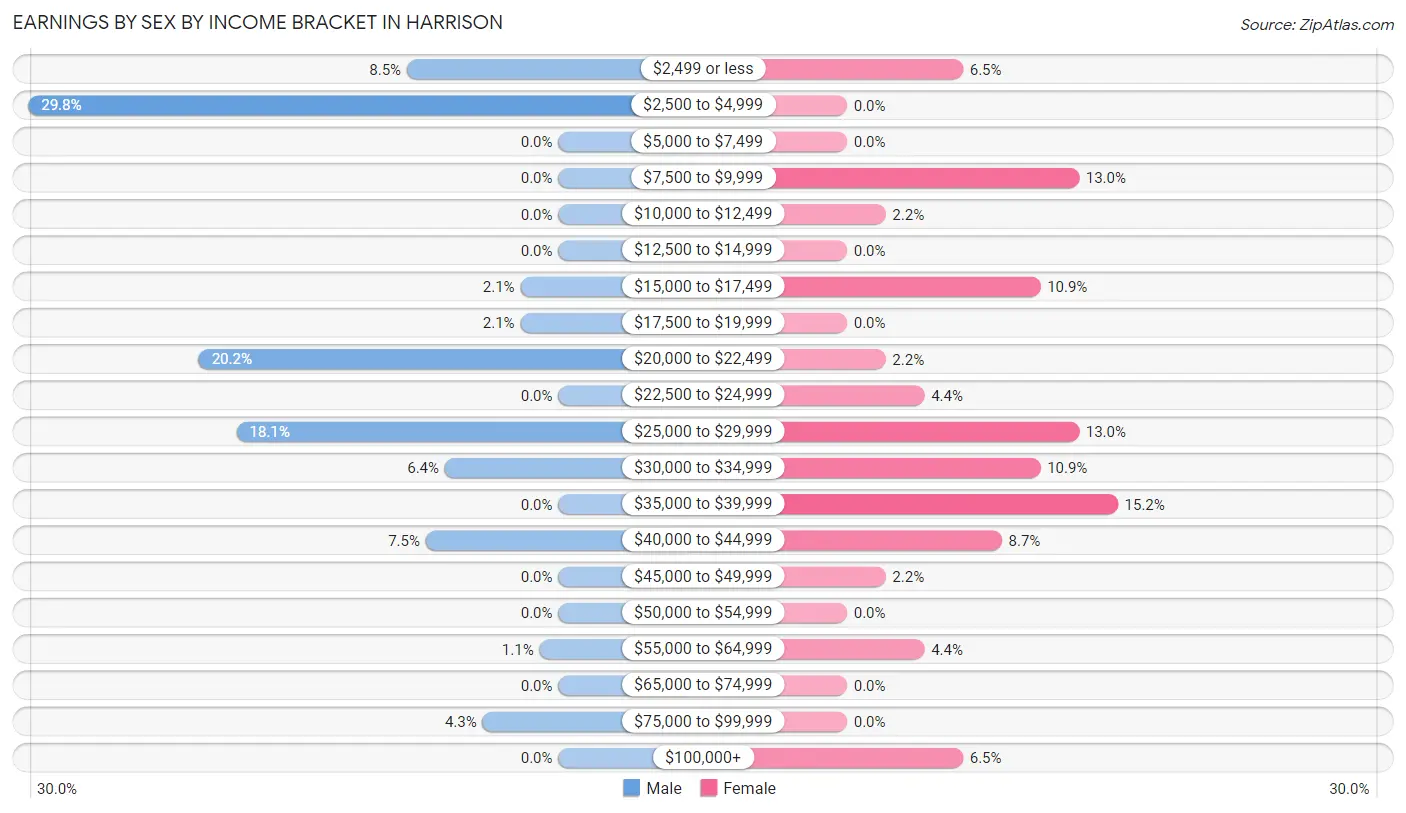
Earnings by Sex by Income Bracket in Harrison
The most common earnings brackets in Harrison are $2,500 to $4,999 for men (28 | 29.8%) and $35,000 to $39,999 for women (7 | 15.2%).
| Income | Male | Female |
| $2,499 or less | 8 (8.5%) | 3 (6.5%) |
| $2,500 to $4,999 | 28 (29.8%) | 0 (0.0%) |
| $5,000 to $7,499 | 0 (0.0%) | 0 (0.0%) |
| $7,500 to $9,999 | 0 (0.0%) | 6 (13.0%) |
| $10,000 to $12,499 | 0 (0.0%) | 1 (2.2%) |
| $12,500 to $14,999 | 0 (0.0%) | 0 (0.0%) |
| $15,000 to $17,499 | 2 (2.1%) | 5 (10.9%) |
| $17,500 to $19,999 | 2 (2.1%) | 0 (0.0%) |
| $20,000 to $22,499 | 19 (20.2%) | 1 (2.2%) |
| $22,500 to $24,999 | 0 (0.0%) | 2 (4.3%) |
| $25,000 to $29,999 | 17 (18.1%) | 6 (13.0%) |
| $30,000 to $34,999 | 6 (6.4%) | 5 (10.9%) |
| $35,000 to $39,999 | 0 (0.0%) | 7 (15.2%) |
| $40,000 to $44,999 | 7 (7.4%) | 4 (8.7%) |
| $45,000 to $49,999 | 0 (0.0%) | 1 (2.2%) |
| $50,000 to $54,999 | 0 (0.0%) | 0 (0.0%) |
| $55,000 to $64,999 | 1 (1.1%) | 2 (4.3%) |
| $65,000 to $74,999 | 0 (0.0%) | 0 (0.0%) |
| $75,000 to $99,999 | 4 (4.3%) | 0 (0.0%) |
| $100,000+ | 0 (0.0%) | 3 (6.5%) |
| Total | 94 (100.0%) | 46 (100.0%) |
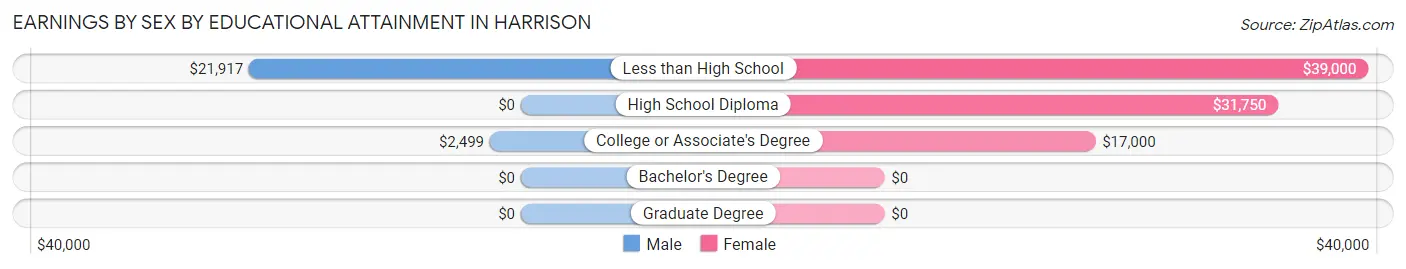
Earnings by Sex by Educational Attainment in Harrison
Average earnings in Harrison are $20,921 for men and $30,250 for women, a difference of 30.8%. Men with an educational attainment of less than high school enjoy the highest average annual earnings of $21,917, while those with college or associate's degree education earn the least with $2,499. Women with an educational attainment of less than high school earn the most with the average annual earnings of $39,000, while those with college or associate's degree education have the smallest earnings of $17,000.
| Educational Attainment | Male Income | Female Income |
| Less than High School | $21,917 | $39,000 |
| High School Diploma | - | - |
| College or Associate's Degree | $2,499 | $17,000 |
| Bachelor's Degree | - | - |
| Graduate Degree | - | - |
| Total | $20,921 | $30,250 |
Family Income in Harrison
Family Income Brackets in Harrison
According to the Harrison family income data, there are 15 families falling into the $50,000 to $74,999 income range, which is the most common income bracket and makes up 22.7% of all families.
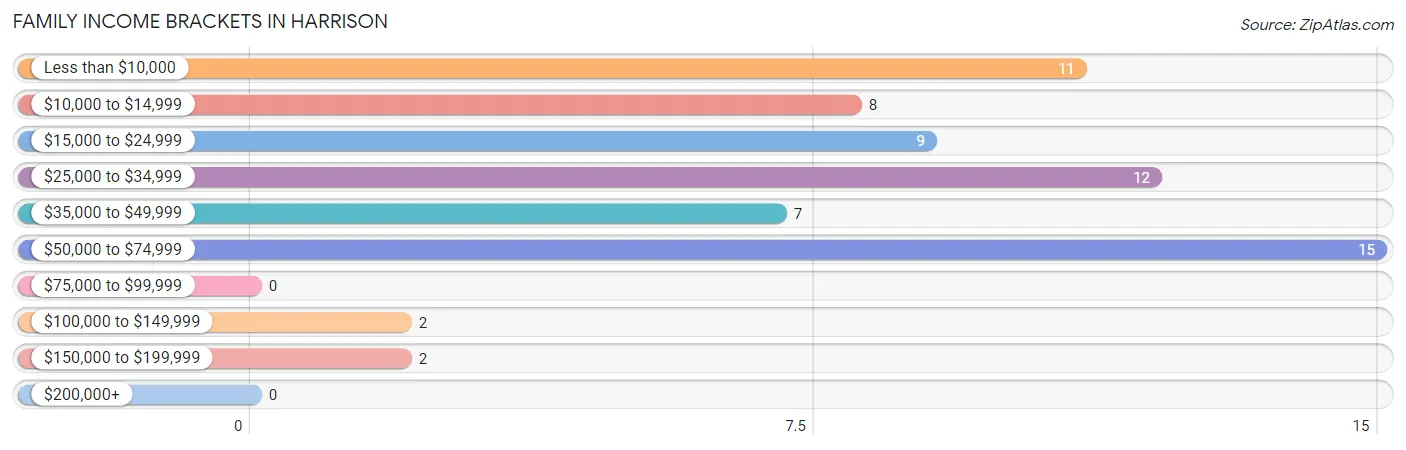
| Income Bracket | # Families | % Families |
| Less than $10,000 | 11 | 16.7% |
| $10,000 to $14,999 | 8 | 12.1% |
| $15,000 to $24,999 | 9 | 13.6% |
| $25,000 to $34,999 | 12 | 18.2% |
| $35,000 to $49,999 | 7 | 10.6% |
| $50,000 to $74,999 | 15 | 22.7% |
| $75,000 to $99,999 | 0 | 0.0% |
| $100,000 to $149,999 | 2 | 3.0% |
| $150,000 to $199,999 | 2 | 3.0% |
| $200,000+ | 0 | 0.0% |
Family Income by Famaliy Size in Harrison
4-person families (6 | 9.1%) account for the highest median family income in Harrison with $50,000 per family, while 2-person families (46 | 69.7%) have the highest median income of $14,375 per family member.
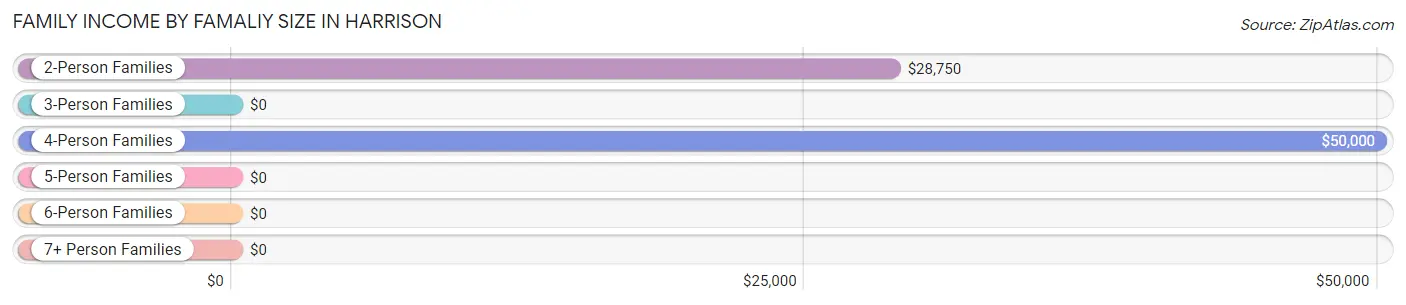
| Income Bracket | # Families | Median Income |
| 2-Person Families | 46 (69.7%) | $28,750 |
| 3-Person Families | 3 (4.5%) | $0 |
| 4-Person Families | 6 (9.1%) | $50,000 |
| 5-Person Families | 11 (16.7%) | $0 |
| 6-Person Families | 0 (0.0%) | $0 |
| 7+ Person Families | 0 (0.0%) | $0 |
| Total | 66 (100.0%) | $33,250 |
Family Income by Number of Earners in Harrison
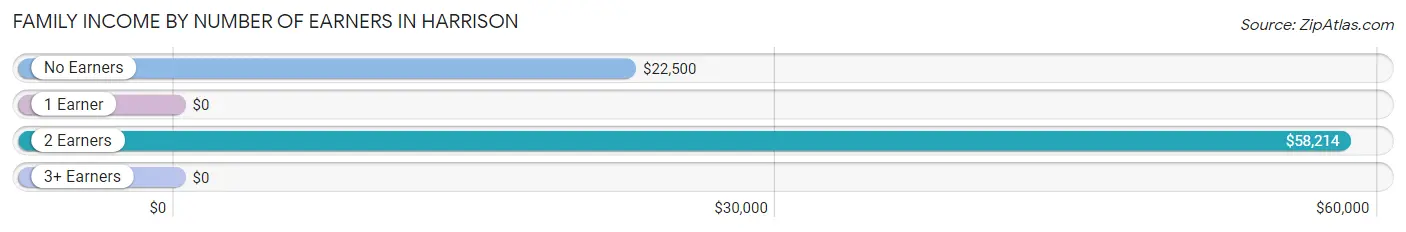
| Number of Earners | # Families | Median Income |
| No Earners | 28 (42.4%) | $22,500 |
| 1 Earner | 20 (30.3%) | $0 |
| 2 Earners | 18 (27.3%) | $58,214 |
| 3+ Earners | 0 (0.0%) | $0 |
| Total | 66 (100.0%) | $33,250 |
Household Income in Harrison
Household Income Brackets in Harrison
With 43 households falling in the category, the $25,000 to $34,999 income range is the most frequent in Harrison, accounting for 28.7% of all households.
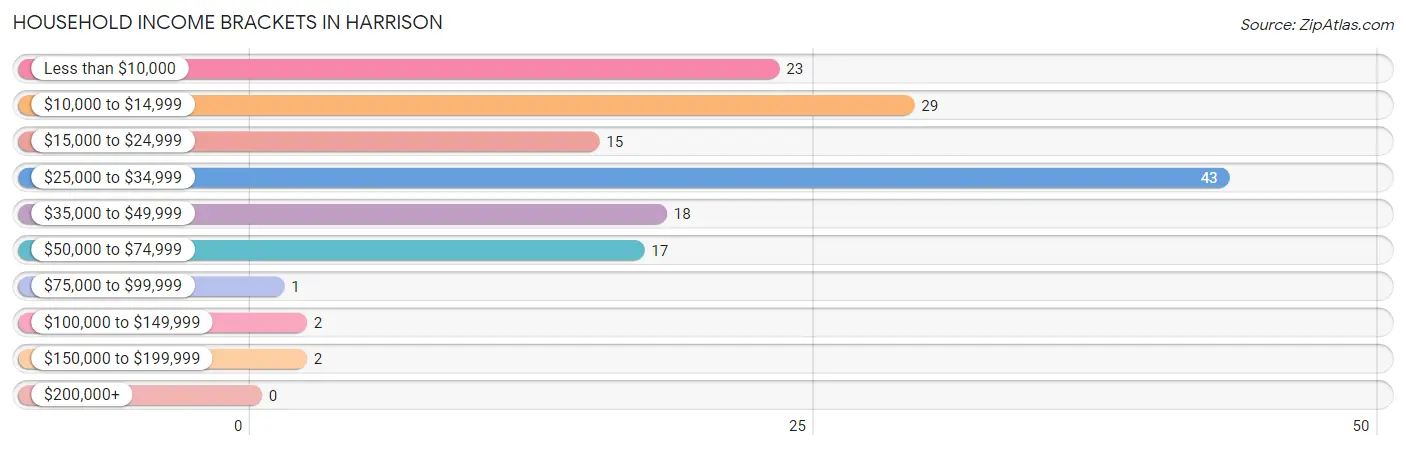
| Income Bracket | # Households | % Households |
| Less than $10,000 | 23 | 15.3% |
| $10,000 to $14,999 | 29 | 19.3% |
| $15,000 to $24,999 | 15 | 10.0% |
| $25,000 to $34,999 | 43 | 28.7% |
| $35,000 to $49,999 | 18 | 12.0% |
| $50,000 to $74,999 | 17 | 11.3% |
| $75,000 to $99,999 | 1 | 0.7% |
| $100,000 to $149,999 | 2 | 1.3% |
| $150,000 to $199,999 | 2 | 1.3% |
| $200,000+ | 0 | 0.0% |
Household Income by Householder Age in Harrison
The median household income in Harrison is $32,569, with the highest median household income of $45,625 found in the 25 to 44 years age bracket for the primary householder. A total of 18 households (12.0%) fall into this category.
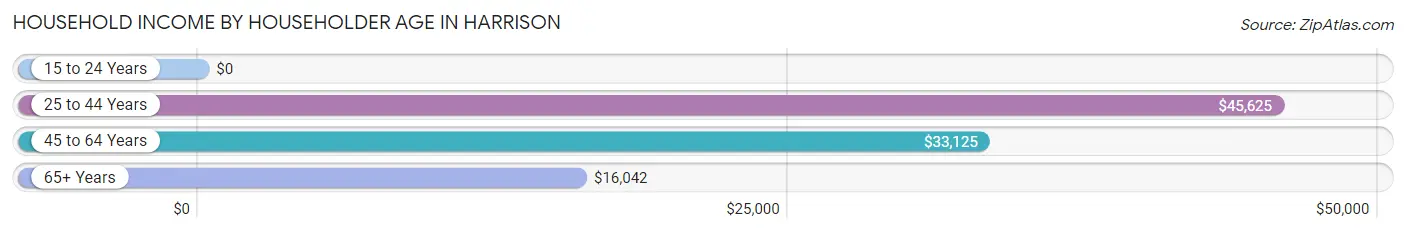
| Income Bracket | # Households | Median Income |
| 15 to 24 Years | 0 (0.0%) | $0 |
| 25 to 44 Years | 18 (12.0%) | $45,625 |
| 45 to 64 Years | 91 (60.7%) | $33,125 |
| 65+ Years | 41 (27.3%) | $16,042 |
| Total | 150 (100.0%) | $32,569 |
Poverty in Harrison
Income Below Poverty by Sex and Age in Harrison
With 39.2% poverty level for males and 43.4% for females among the residents of Harrison, 12 to 14 year old males and 16 and 17 year old females are the most vulnerable to poverty, with 6 males (100.0%) and 7 females (100.0%) in their respective age groups living below the poverty level.
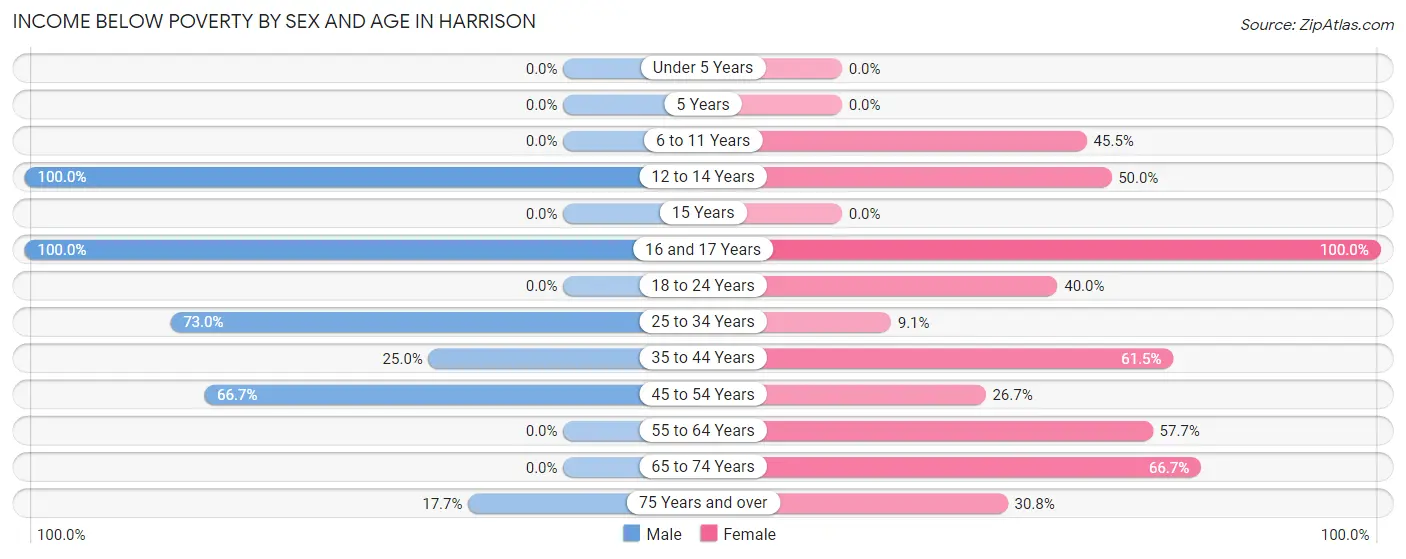
| Age Bracket | Male | Female |
| Under 5 Years | 0 (0.0%) | 0 (0.0%) |
| 5 Years | 0 (0.0%) | 0 (0.0%) |
| 6 to 11 Years | 0 (0.0%) | 5 (45.5%) |
| 12 to 14 Years | 6 (100.0%) | 5 (50.0%) |
| 15 Years | 0 (0.0%) | 0 (0.0%) |
| 16 and 17 Years | 1 (100.0%) | 7 (100.0%) |
| 18 to 24 Years | 0 (0.0%) | 2 (40.0%) |
| 25 to 34 Years | 27 (73.0%) | 2 (9.1%) |
| 35 to 44 Years | 4 (25.0%) | 8 (61.5%) |
| 45 to 54 Years | 28 (66.7%) | 4 (26.7%) |
| 55 to 64 Years | 0 (0.0%) | 15 (57.7%) |
| 65 to 74 Years | 0 (0.0%) | 10 (66.7%) |
| 75 Years and over | 3 (17.6%) | 8 (30.8%) |
| Total | 69 (39.2%) | 66 (43.4%) |
Income Above Poverty by Sex and Age in Harrison
According to the poverty statistics in Harrison, males aged under 5 years and females aged under 5 years are the age groups that are most secure financially, with 100.0% of males and 100.0% of females in these age groups living above the poverty line.
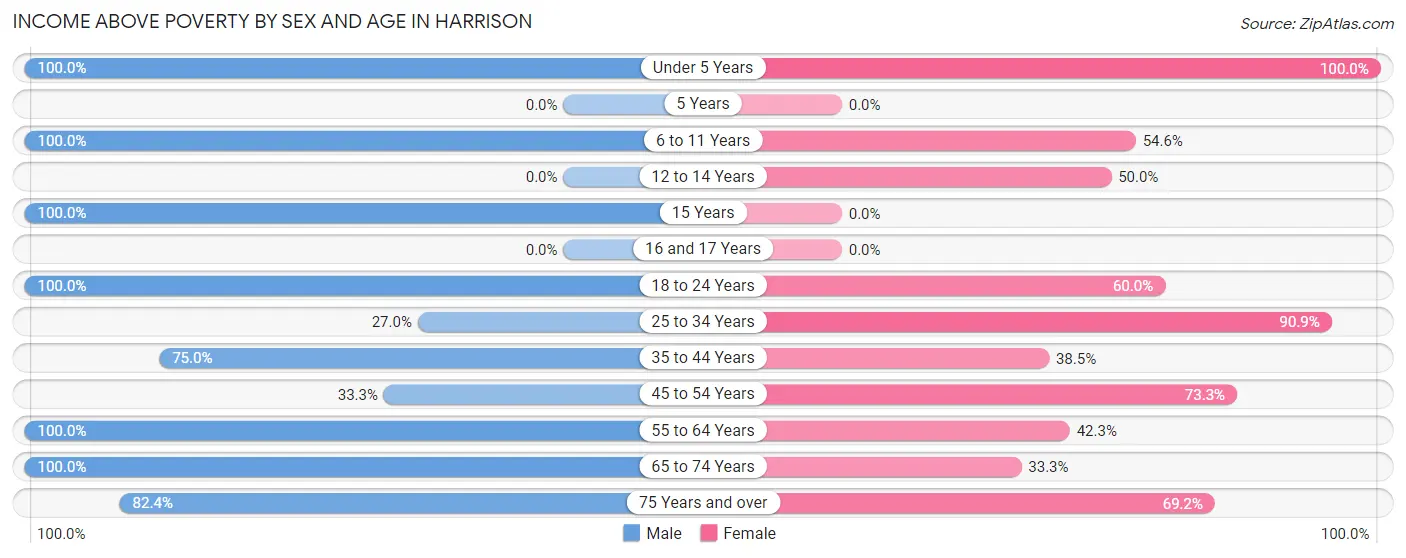
| Age Bracket | Male | Female |
| Under 5 Years | 5 (100.0%) | 2 (100.0%) |
| 5 Years | 0 (0.0%) | 0 (0.0%) |
| 6 to 11 Years | 5 (100.0%) | 6 (54.5%) |
| 12 to 14 Years | 0 (0.0%) | 5 (50.0%) |
| 15 Years | 5 (100.0%) | 0 (0.0%) |
| 16 and 17 Years | 0 (0.0%) | 0 (0.0%) |
| 18 to 24 Years | 7 (100.0%) | 3 (60.0%) |
| 25 to 34 Years | 10 (27.0%) | 20 (90.9%) |
| 35 to 44 Years | 12 (75.0%) | 5 (38.5%) |
| 45 to 54 Years | 14 (33.3%) | 11 (73.3%) |
| 55 to 64 Years | 32 (100.0%) | 11 (42.3%) |
| 65 to 74 Years | 3 (100.0%) | 5 (33.3%) |
| 75 Years and over | 14 (82.4%) | 18 (69.2%) |
| Total | 107 (60.8%) | 86 (56.6%) |
Income Below Poverty Among Married-Couple Families in Harrison
The poverty statistics for married-couple families in Harrison show that 18.8% or 6 of the total 32 families live below the poverty line. Families with 3 or 4 children have the highest poverty rate of 57.1%, comprising of 4 families. On the other hand, families with no children have the lowest poverty rate of 8.0%, which includes 2 families.
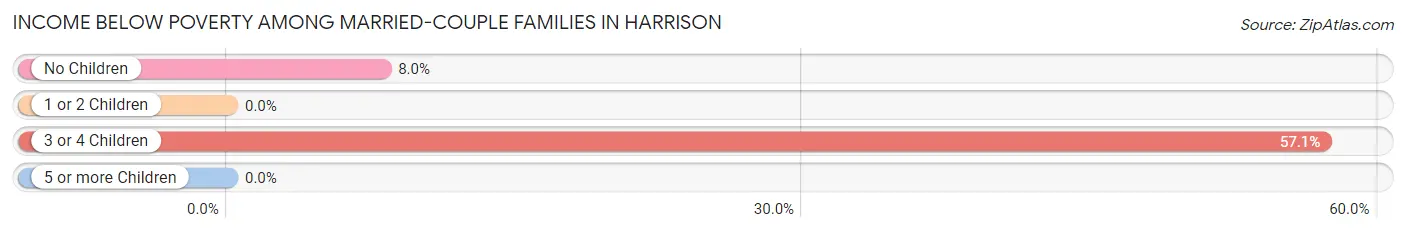
| Children | Above Poverty | Below Poverty |
| No Children | 23 (92.0%) | 2 (8.0%) |
| 1 or 2 Children | 0 (0.0%) | 0 (0.0%) |
| 3 or 4 Children | 3 (42.9%) | 4 (57.1%) |
| 5 or more Children | 0 (0.0%) | 0 (0.0%) |
| Total | 26 (81.2%) | 6 (18.8%) |
Income Below Poverty Among Single-Parent Households in Harrison
According to the poverty data in Harrison, 100.0% or 7 single-father households and 48.1% or 13 single-mother households are living below the poverty line. Among single-father households, those with 1 or 2 children have the highest poverty rate, with 7 households (100.0%) experiencing poverty. Likewise, among single-mother households, those with no children have the highest poverty rate, with 6 households (50.0%) falling below the poverty line.
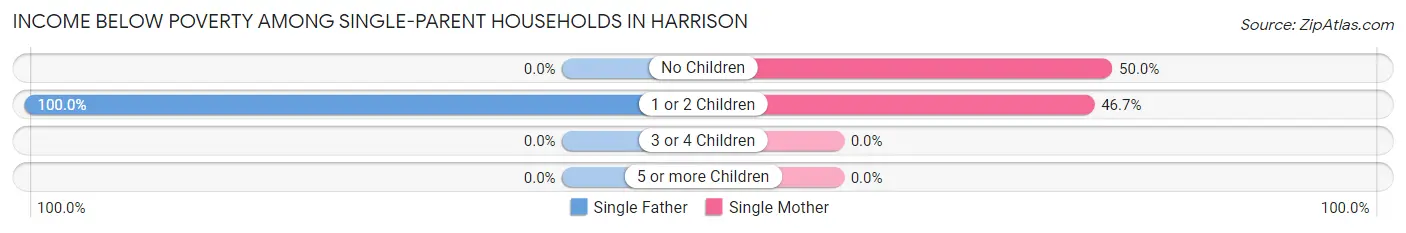
| Children | Single Father | Single Mother |
| No Children | 0 (0.0%) | 6 (50.0%) |
| 1 or 2 Children | 7 (100.0%) | 7 (46.7%) |
| 3 or 4 Children | 0 (0.0%) | 0 (0.0%) |
| 5 or more Children | 0 (0.0%) | 0 (0.0%) |
| Total | 7 (100.0%) | 13 (48.1%) |
Income Below Poverty Among Married-Couple vs Single-Parent Households in Harrison
The poverty data for Harrison shows that 6 of the married-couple family households (18.8%) and 20 of the single-parent households (58.8%) are living below the poverty level. Within the married-couple family households, those with 3 or 4 children have the highest poverty rate, with 4 households (57.1%) falling below the poverty line. Among the single-parent households, those with 1 or 2 children have the highest poverty rate, with 14 household (63.6%) living below poverty.
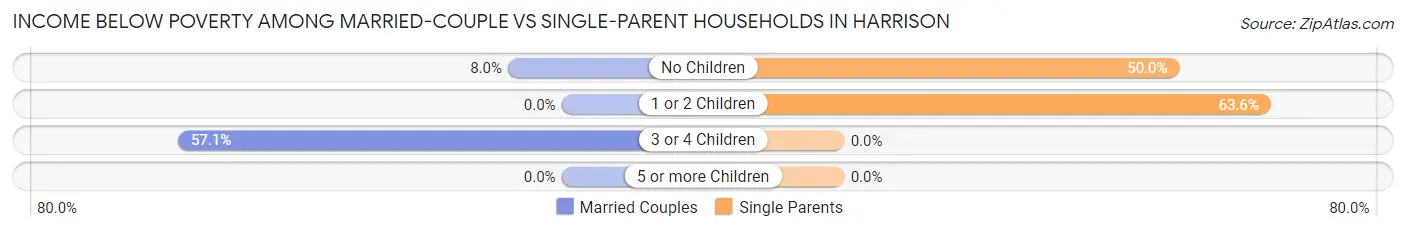
| Children | Married-Couple Families | Single-Parent Households |
| No Children | 2 (8.0%) | 6 (50.0%) |
| 1 or 2 Children | 0 (0.0%) | 14 (63.6%) |
| 3 or 4 Children | 4 (57.1%) | 0 (0.0%) |
| 5 or more Children | 0 (0.0%) | 0 (0.0%) |
| Total | 6 (18.8%) | 20 (58.8%) |
Race in Harrison
The most populous races in Harrison are Black / African American (242 | 70.1%), White / Caucasian (71 | 20.6%), and Asian (22 | 6.4%).
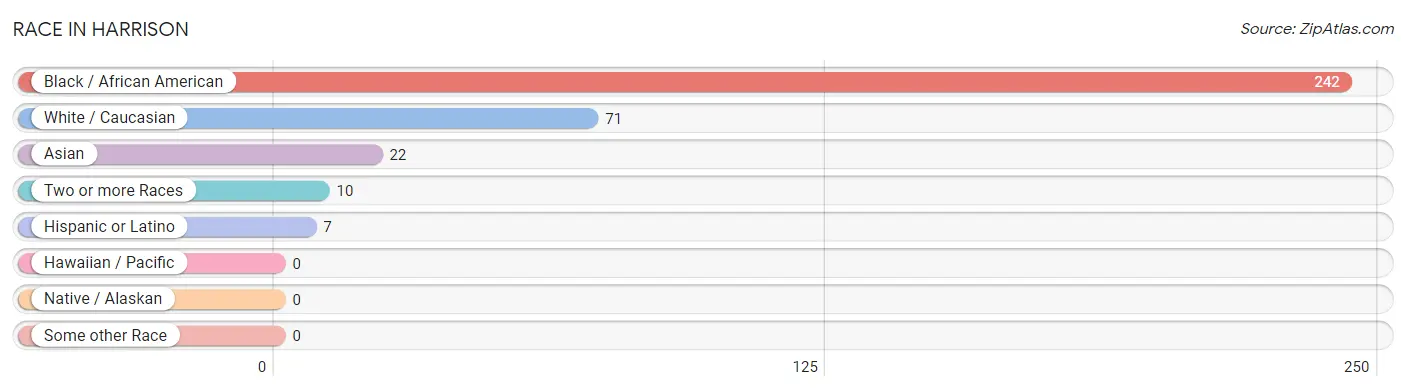
| Race | # Population | % Population |
| Asian | 22 | 6.4% |
| Black / African American | 242 | 70.1% |
| Hawaiian / Pacific | 0 | 0.0% |
| Hispanic or Latino | 7 | 2.0% |
| Native / Alaskan | 0 | 0.0% |
| White / Caucasian | 71 | 20.6% |
| Two or more Races | 10 | 2.9% |
| Some other Race | 0 | 0.0% |
| Total | 345 | 100.0% |
Ancestry in Harrison
The most populous ancestries reported in Harrison are American (18 | 5.2%), Jamaican (7 | 2.0%), English (3 | 0.9%), Irish (3 | 0.9%), and Dutch (1 | 0.3%), together accounting for 9.3% of all Harrison residents.
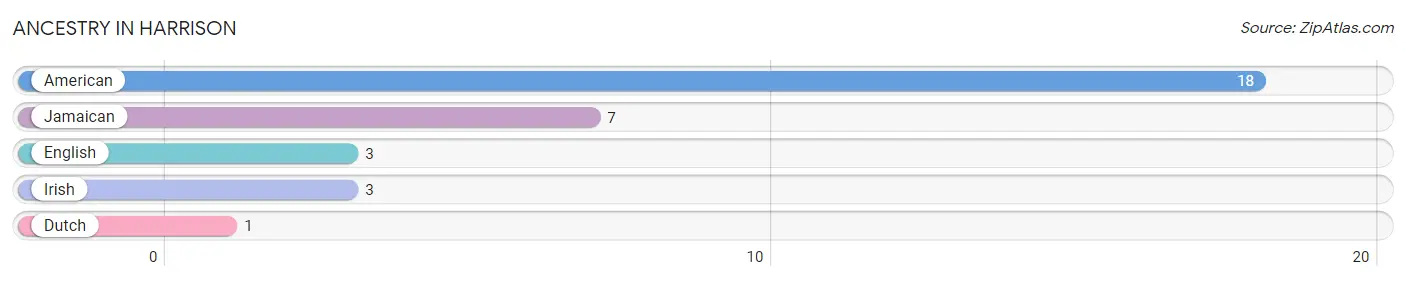
| Ancestry | # Population | % Population |
| American | 18 | 5.2% |
| Dutch | 1 | 0.3% |
| English | 3 | 0.9% |
| Irish | 3 | 0.9% |
| Jamaican | 7 | 2.0% | View All 5 Rows |
Immigrants in Harrison
The most numerous immigrant groups reported in Harrison came from Afghanistan (17 | 4.9%), Asia (17 | 4.9%), and South Central Asia (17 | 4.9%), together accounting for 14.8% of all Harrison residents.
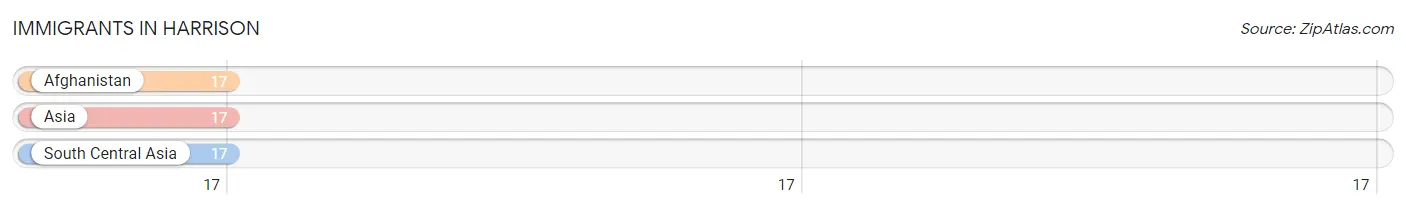
| Immigration Origin | # Population | % Population |
| Afghanistan | 17 | 4.9% |
| Asia | 17 | 4.9% |
| South Central Asia | 17 | 4.9% | View All 3 Rows |
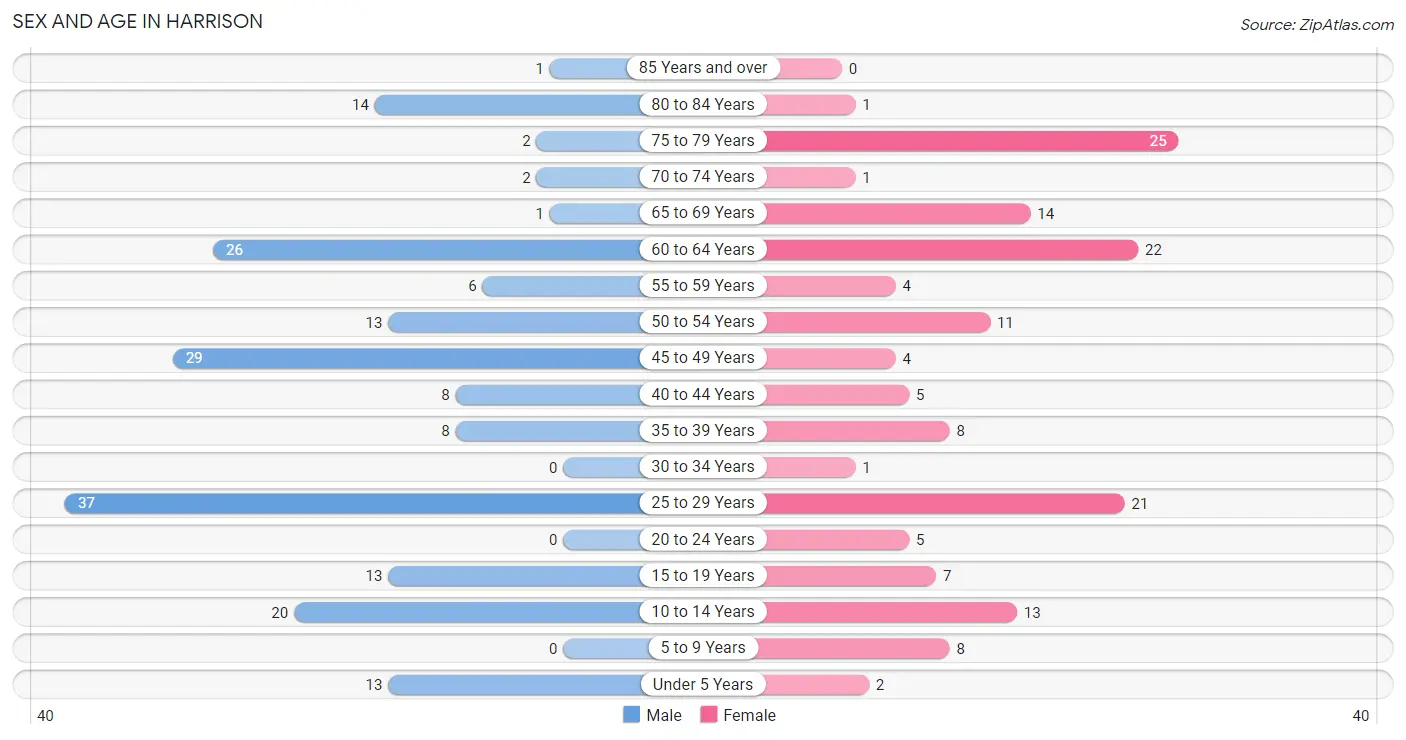
Sex and Age in Harrison
Sex and Age in Harrison
The most populous age groups in Harrison are 25 to 29 Years (37 | 19.2%) for men and 75 to 79 Years (25 | 16.5%) for women.
| Age Bracket | Male | Female |
| Under 5 Years | 13 (6.7%) | 2 (1.3%) |
| 5 to 9 Years | 0 (0.0%) | 8 (5.3%) |
| 10 to 14 Years | 20 (10.4%) | 13 (8.6%) |
| 15 to 19 Years | 13 (6.7%) | 7 (4.6%) |
| 20 to 24 Years | 0 (0.0%) | 5 (3.3%) |
| 25 to 29 Years | 37 (19.2%) | 21 (13.8%) |
| 30 to 34 Years | 0 (0.0%) | 1 (0.7%) |
| 35 to 39 Years | 8 (4.2%) | 8 (5.3%) |
| 40 to 44 Years | 8 (4.2%) | 5 (3.3%) |
| 45 to 49 Years | 29 (15.0%) | 4 (2.6%) |
| 50 to 54 Years | 13 (6.7%) | 11 (7.2%) |
| 55 to 59 Years | 6 (3.1%) | 4 (2.6%) |
| 60 to 64 Years | 26 (13.5%) | 22 (14.5%) |
| 65 to 69 Years | 1 (0.5%) | 14 (9.2%) |
| 70 to 74 Years | 2 (1.0%) | 1 (0.7%) |
| 75 to 79 Years | 2 (1.0%) | 25 (16.5%) |
| 80 to 84 Years | 14 (7.2%) | 1 (0.7%) |
| 85 Years and over | 1 (0.5%) | 0 (0.0%) |
| Total | 193 (100.0%) | 152 (100.0%) |
Families and Households in Harrison
Median Family Size in Harrison
The median family size in Harrison is 3.29 persons per family, with single female/mother families (27 | 40.9%) accounting for the largest median family size of 3.93 persons per family. On the other hand, single male/father families (7 | 10.6%) represent the smallest median family size with 1.29 persons per family.
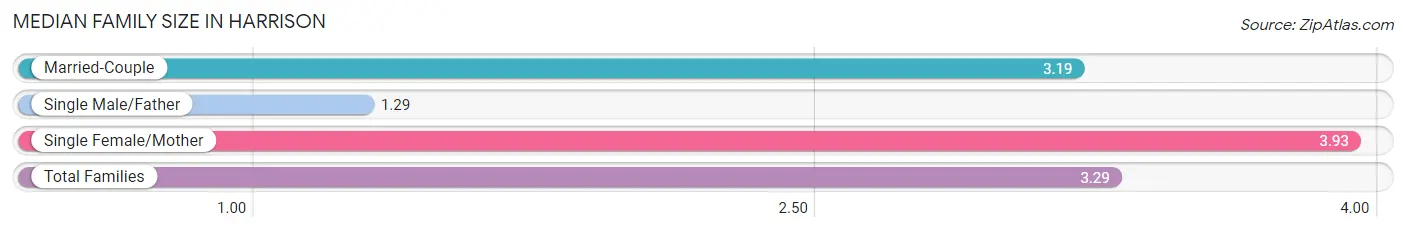
| Family Type | # Families | Family Size |
| Married-Couple | 32 (48.5%) | 3.19 |
| Single Male/Father | 7 (10.6%) | 1.29 |
| Single Female/Mother | 27 (40.9%) | 3.93 |
| Total Families | 66 (100.0%) | 3.29 |
Median Household Size in Harrison
The median household size in Harrison is 2.30 persons per household, with single female/mother households (27 | 18.0%) accounting for the largest median household size of 4.44 persons per household. single male/father households (7 | 4.7%) represent the smallest median household size with 1.29 persons per household.
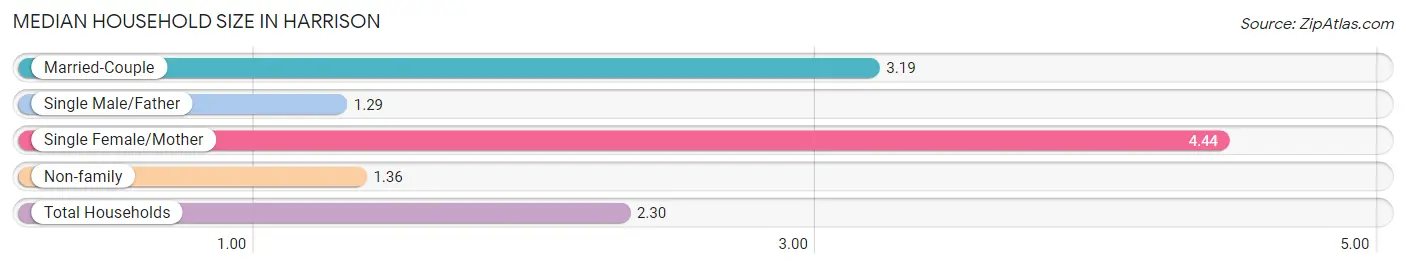
| Household Type | # Households | Household Size |
| Married-Couple | 32 (21.3%) | 3.19 |
| Single Male/Father | 7 (4.7%) | 1.29 |
| Single Female/Mother | 27 (18.0%) | 4.44 |
| Non-family | 84 (56.0%) | 1.36 |
| Total Households | 150 (100.0%) | 2.30 |
Household Size by Marriage Status in Harrison
Out of a total of 150 households in Harrison, 66 (44.0%) are family households, while 84 (56.0%) are nonfamily households. The most numerous type of family households are 2-person households, comprising 44, and the most common type of nonfamily households are 1-person households, comprising 69.
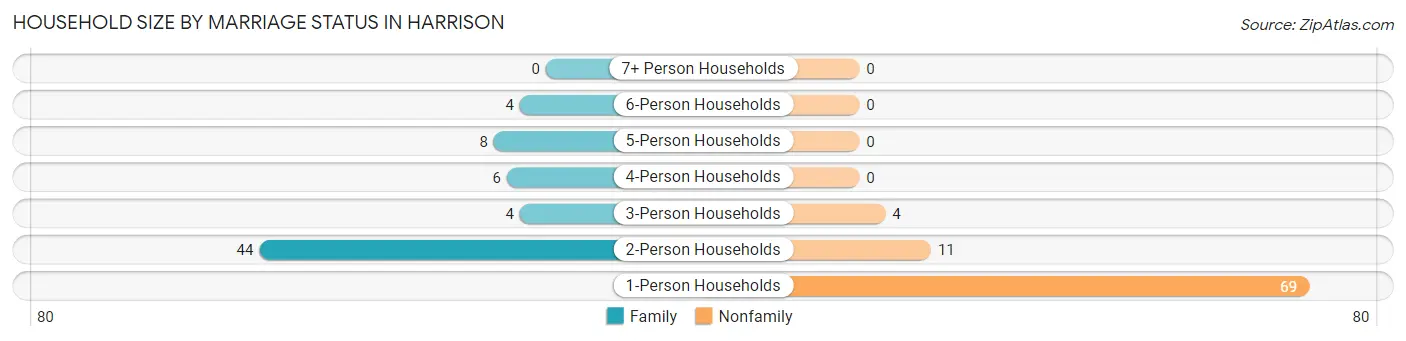
| Household Size | Family Households | Nonfamily Households |
| 1-Person Households | - | 69 (46.0%) |
| 2-Person Households | 44 (29.3%) | 11 (7.3%) |
| 3-Person Households | 4 (2.7%) | 4 (2.7%) |
| 4-Person Households | 6 (4.0%) | 0 (0.0%) |
| 5-Person Households | 8 (5.3%) | 0 (0.0%) |
| 6-Person Households | 4 (2.7%) | 0 (0.0%) |
| 7+ Person Households | 0 (0.0%) | 0 (0.0%) |
| Total | 66 (44.0%) | 84 (56.0%) |
Female Fertility in Harrison
Fertility by Age in Harrison
Average fertility rate in Harrison is 143.0 births per 1,000 women. Women in the age bracket of 20 to 34 years have the highest fertility rate with 185.0 births per 1,000 women. Women in the age bracket of 20 to 34 years acount for 62.5% of all women with births.
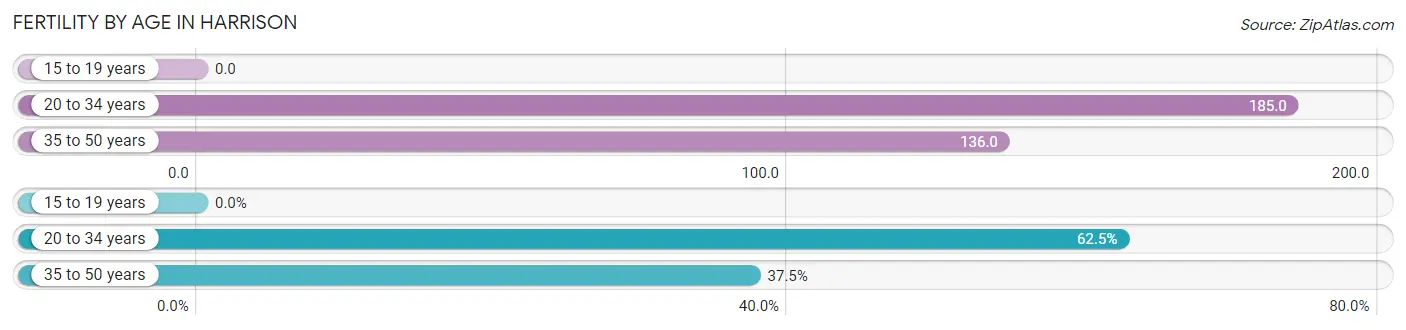
| Age Bracket | Women with Births | Births / 1,000 Women |
| 15 to 19 years | 0 (0.0%) | 0.0 |
| 20 to 34 years | 5 (62.5%) | 185.0 |
| 35 to 50 years | 3 (37.5%) | 136.0 |
| Total | 8 (100.0%) | 143.0 |
Fertility by Age by Marriage Status in Harrison
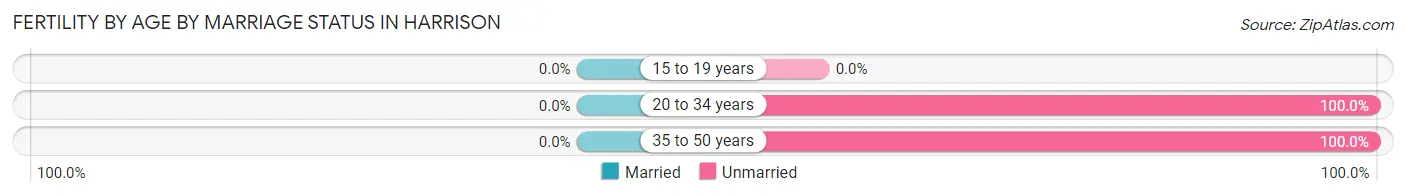
| Age Bracket | Married | Unmarried |
| 15 to 19 years | 0 (0.0%) | 0 (0.0%) |
| 20 to 34 years | 0 (0.0%) | 5 (100.0%) |
| 35 to 50 years | 0 (0.0%) | 3 (100.0%) |
| Total | 0 (0.0%) | 8 (100.0%) |
Fertility by Education in Harrison
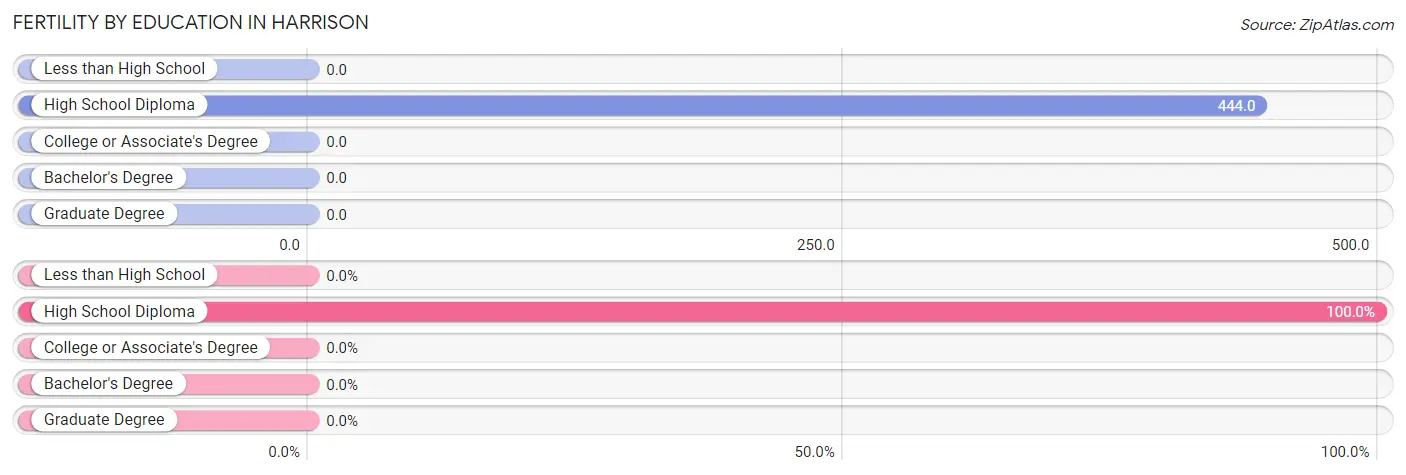
| Educational Attainment | Women with Births | Births / 1,000 Women |
| Less than High School | 0 (0.0%) | 0.0 |
| High School Diploma | 8 (100.0%) | 444.0 |
| College or Associate's Degree | 0 (0.0%) | 0.0 |
| Bachelor's Degree | 0 (0.0%) | 0.0 |
| Graduate Degree | 0 (0.0%) | 0.0 |
| Total | 8 (100.0%) | 143.0 |
Fertility by Education by Marriage Status in Harrison
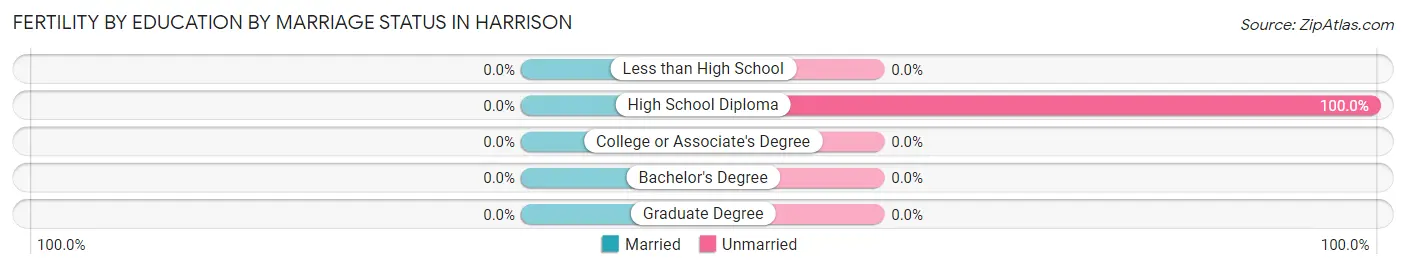
| Educational Attainment | Married | Unmarried |
| Less than High School | 0 (0.0%) | 0 (0.0%) |
| High School Diploma | 0 (0.0%) | 8 (100.0%) |
| College or Associate's Degree | 0 (0.0%) | 0 (0.0%) |
| Bachelor's Degree | 0 (0.0%) | 0 (0.0%) |
| Graduate Degree | 0 (0.0%) | 0 (0.0%) |
| Total | 0 (0.0%) | 8 (100.0%) |
Employment Characteristics in Harrison
Employment by Class of Employer in Harrison
Among the 112 employed individuals in Harrison, private company employees (92 | 82.1%), self-employed (incorporated) (9 | 8.0%), and state government employees (4 | 3.6%) make up the most common classes of employment.
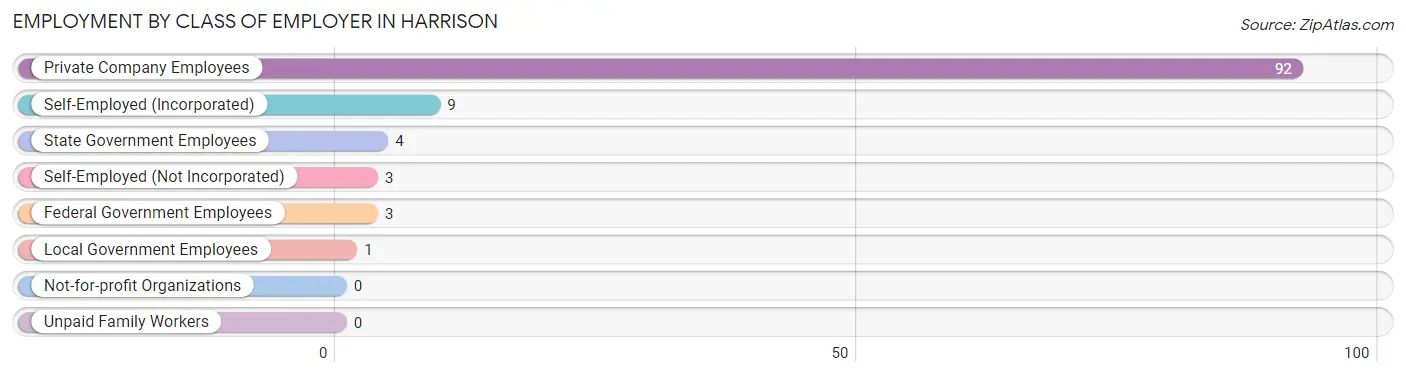
| Employer Class | # Employees | % Employees |
| Private Company Employees | 92 | 82.1% |
| Self-Employed (Incorporated) | 9 | 8.0% |
| Self-Employed (Not Incorporated) | 3 | 2.7% |
| Not-for-profit Organizations | 0 | 0.0% |
| Local Government Employees | 1 | 0.9% |
| State Government Employees | 4 | 3.6% |
| Federal Government Employees | 3 | 2.7% |
| Unpaid Family Workers | 0 | 0.0% |
| Total | 112 | 100.0% |
Employment Status by Age in Harrison
According to the labor force statistics for Harrison, out of the total population over 16 years of age (284), 40.8% or 116 individuals are in the labor force, with 3.4% or 4 of them unemployed. The age group with the highest labor force participation rate is 30 to 34 years, with 100.0% or 1 individuals in the labor force. Within the labor force, the 35 to 44 years age range has the highest percentage of unemployed individuals, with 18.2% or 4 of them being unemployed.
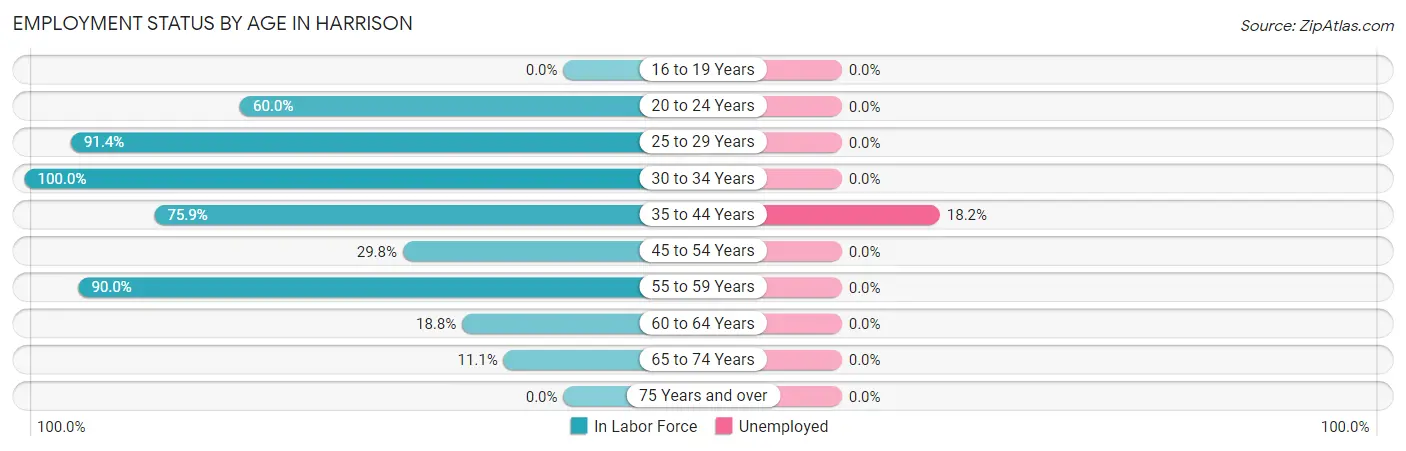
| Age Bracket | In Labor Force | Unemployed |
| 16 to 19 Years | 0 (0.0%) | 0 (0.0%) |
| 20 to 24 Years | 3 (60.0%) | 0 (0.0%) |
| 25 to 29 Years | 53 (91.4%) | 0 (0.0%) |
| 30 to 34 Years | 1 (100.0%) | 0 (0.0%) |
| 35 to 44 Years | 22 (75.9%) | 4 (18.2%) |
| 45 to 54 Years | 17 (29.8%) | 0 (0.0%) |
| 55 to 59 Years | 9 (90.0%) | 0 (0.0%) |
| 60 to 64 Years | 9 (18.8%) | 0 (0.0%) |
| 65 to 74 Years | 2 (11.1%) | 0 (0.0%) |
| 75 Years and over | 0 (0.0%) | 0 (0.0%) |
| Total | 116 (40.8%) | 4 (3.4%) |
Employment Status by Educational Attainment in Harrison
According to labor force statistics for Harrison, 54.7% of individuals (111) out of the total population between 25 and 64 years of age (203) are in the labor force, with 3.6% or 4 of them being unemployed. The group with the highest labor force participation rate are those with the educational attainment of high school diploma, with 67.9% or 76 individuals in the labor force. Within the labor force, individuals with high school diploma education have the highest percentage of unemployment, with 5.3% or 4 of them being unemployed.
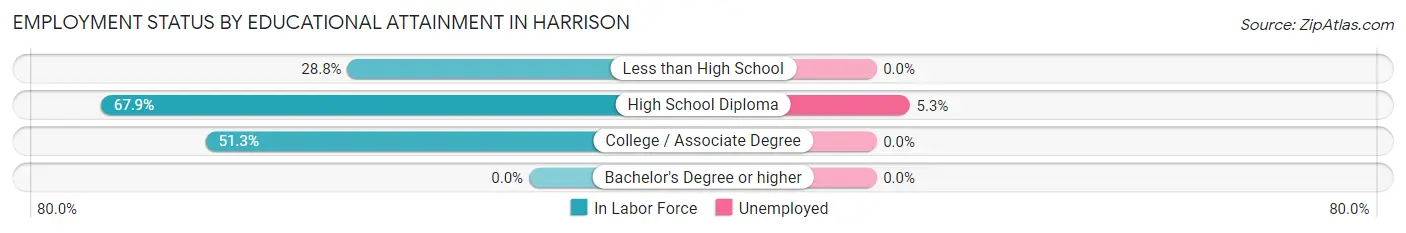
| Educational Attainment | In Labor Force | Unemployed |
| Less than High School | 15 (28.8%) | 0 (0.0%) |
| High School Diploma | 76 (67.9%) | 6 (5.3%) |
| College / Associate Degree | 20 (51.3%) | 0 (0.0%) |
| Bachelor's Degree or higher | 0 (0.0%) | 0 (0.0%) |
| Total | 111 (54.7%) | 7 (3.6%) |
Employment Occupations by Sex in Harrison
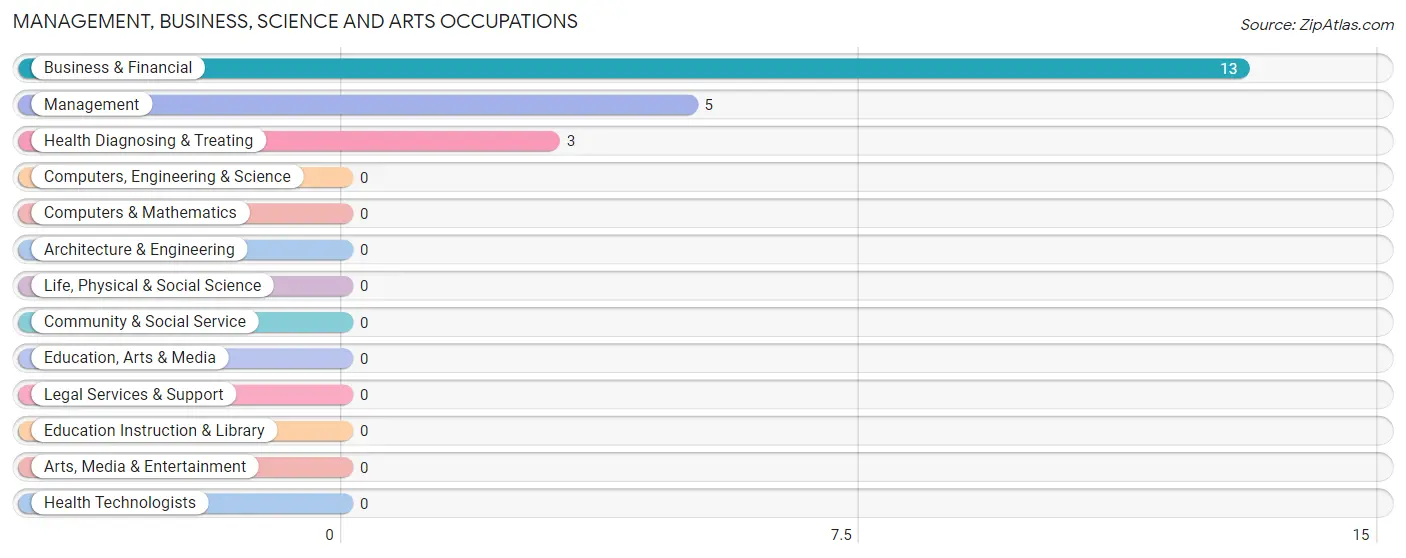
Management, Business, Science and Arts Occupations
The most common Management, Business, Science and Arts occupations in Harrison are Business & Financial (13 | 11.6%), Management (5 | 4.5%), and Health Diagnosing & Treating (3 | 2.7%).
Management, Business, Science and Arts Occupations by Sex
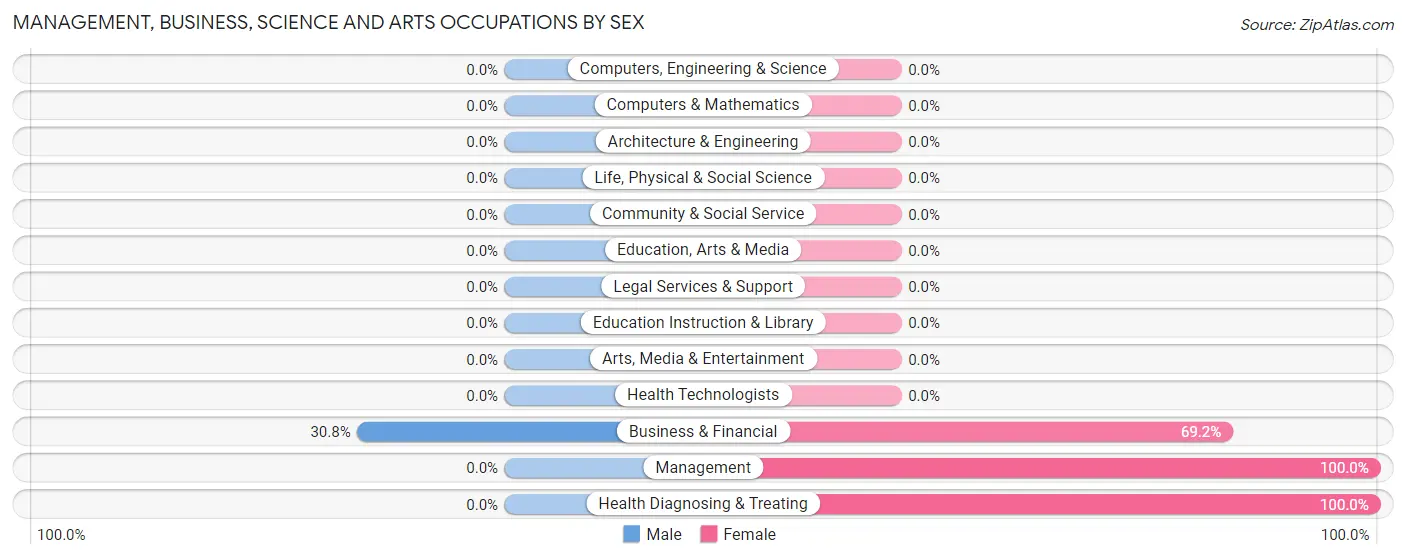
| Occupation | Male | Female |
| Management | 0 (0.0%) | 5 (100.0%) |
| Business & Financial | 4 (30.8%) | 9 (69.2%) |
| Computers, Engineering & Science | 0 (0.0%) | 0 (0.0%) |
| Computers & Mathematics | 0 (0.0%) | 0 (0.0%) |
| Architecture & Engineering | 0 (0.0%) | 0 (0.0%) |
| Life, Physical & Social Science | 0 (0.0%) | 0 (0.0%) |
| Community & Social Service | 0 (0.0%) | 0 (0.0%) |
| Education, Arts & Media | 0 (0.0%) | 0 (0.0%) |
| Legal Services & Support | 0 (0.0%) | 0 (0.0%) |
| Education Instruction & Library | 0 (0.0%) | 0 (0.0%) |
| Arts, Media & Entertainment | 0 (0.0%) | 0 (0.0%) |
| Health Diagnosing & Treating | 0 (0.0%) | 3 (100.0%) |
| Health Technologists | 0 (0.0%) | 0 (0.0%) |
| Total (Category) | 4 (19.1%) | 17 (80.9%) |
| Total (Overall) | 67 (59.8%) | 45 (40.2%) |
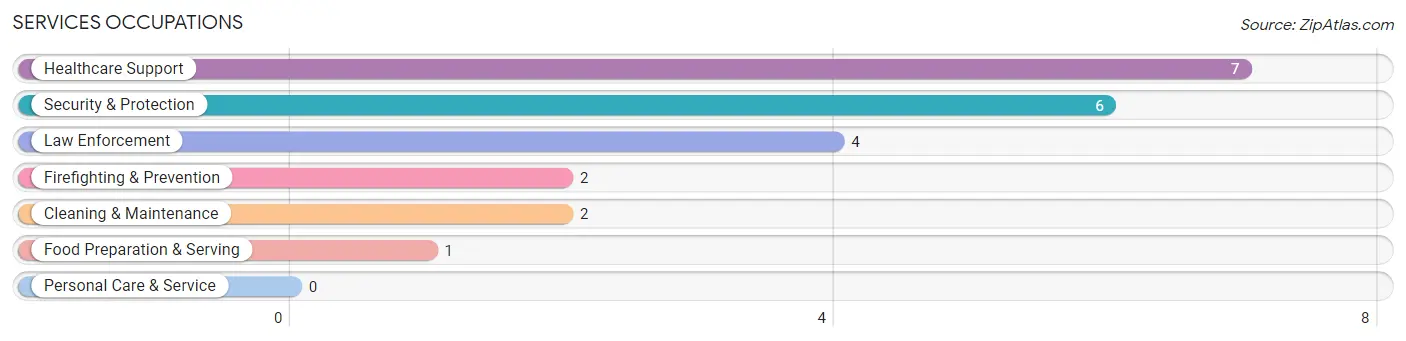
Services Occupations
The most common Services occupations in Harrison are Healthcare Support (7 | 6.2%), Security & Protection (6 | 5.4%), Law Enforcement (4 | 3.6%), Firefighting & Prevention (2 | 1.8%), and Cleaning & Maintenance (2 | 1.8%).
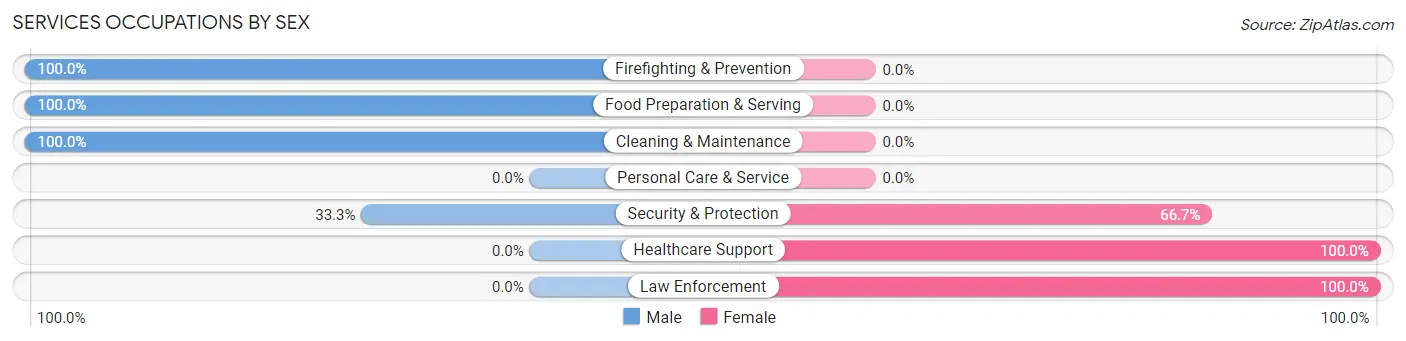
Services Occupations by Sex
Within the Services occupations in Harrison, the most male-oriented occupations are Firefighting & Prevention (100.0%), Food Preparation & Serving (100.0%), and Cleaning & Maintenance (100.0%), while the most female-oriented occupations are Healthcare Support (100.0%), Law Enforcement (100.0%), and Security & Protection (66.7%).
| Occupation | Male | Female |
| Healthcare Support | 0 (0.0%) | 7 (100.0%) |
| Security & Protection | 2 (33.3%) | 4 (66.7%) |
| Firefighting & Prevention | 2 (100.0%) | 0 (0.0%) |
| Law Enforcement | 0 (0.0%) | 4 (100.0%) |
| Food Preparation & Serving | 1 (100.0%) | 0 (0.0%) |
| Cleaning & Maintenance | 2 (100.0%) | 0 (0.0%) |
| Personal Care & Service | 0 (0.0%) | 0 (0.0%) |
| Total (Category) | 5 (31.2%) | 11 (68.8%) |
| Total (Overall) | 67 (59.8%) | 45 (40.2%) |
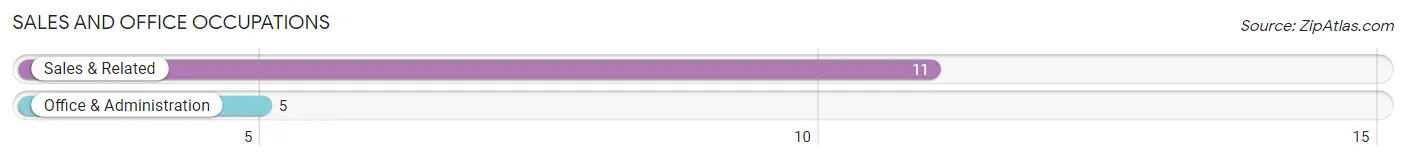
Sales and Office Occupations
The most common Sales and Office occupations in Harrison are Sales & Related (11 | 9.8%), and Office & Administration (5 | 4.5%).
Sales and Office Occupations by Sex
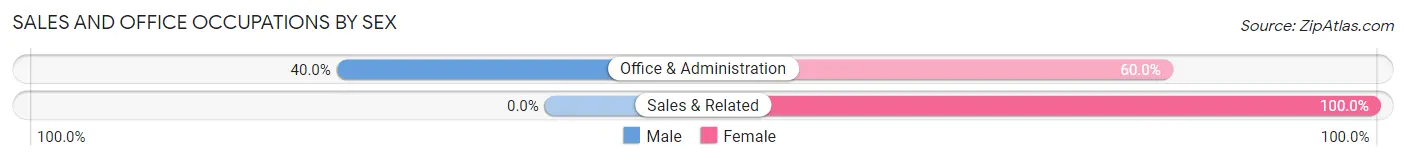
| Occupation | Male | Female |
| Sales & Related | 0 (0.0%) | 11 (100.0%) |
| Office & Administration | 2 (40.0%) | 3 (60.0%) |
| Total (Category) | 2 (12.5%) | 14 (87.5%) |
| Total (Overall) | 67 (59.8%) | 45 (40.2%) |
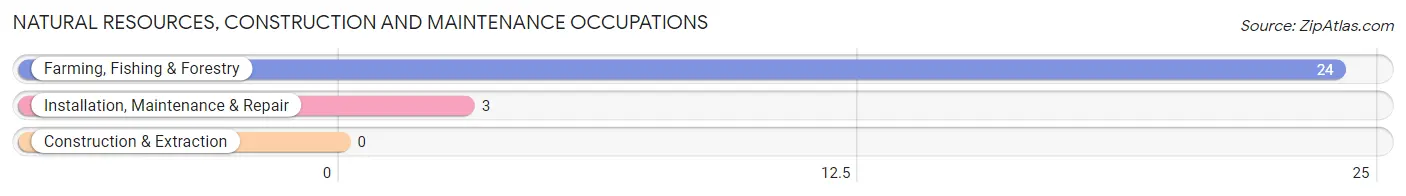
Natural Resources, Construction and Maintenance Occupations
The most common Natural Resources, Construction and Maintenance occupations in Harrison are Farming, Fishing & Forestry (24 | 21.4%), and Installation, Maintenance & Repair (3 | 2.7%).
Natural Resources, Construction and Maintenance Occupations by Sex
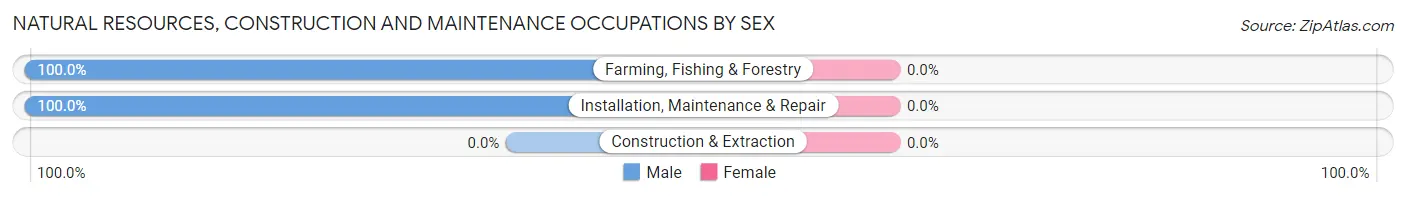
| Occupation | Male | Female |
| Farming, Fishing & Forestry | 24 (100.0%) | 0 (0.0%) |
| Construction & Extraction | 0 (0.0%) | 0 (0.0%) |
| Installation, Maintenance & Repair | 3 (100.0%) | 0 (0.0%) |
| Total (Category) | 27 (100.0%) | 0 (0.0%) |
| Total (Overall) | 67 (59.8%) | 45 (40.2%) |
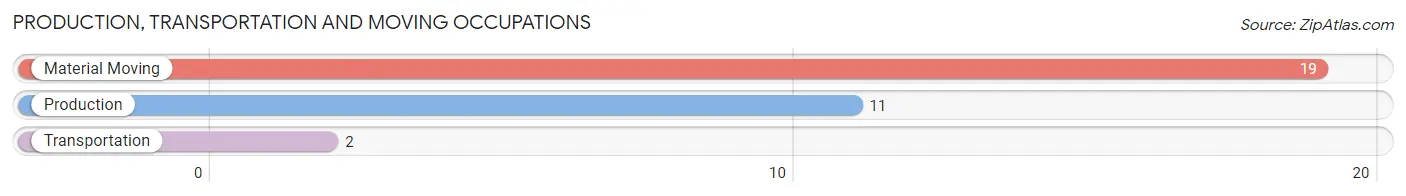
Production, Transportation and Moving Occupations
The most common Production, Transportation and Moving occupations in Harrison are Material Moving (19 | 17.0%), Production (11 | 9.8%), and Transportation (2 | 1.8%).
Production, Transportation and Moving Occupations by Sex
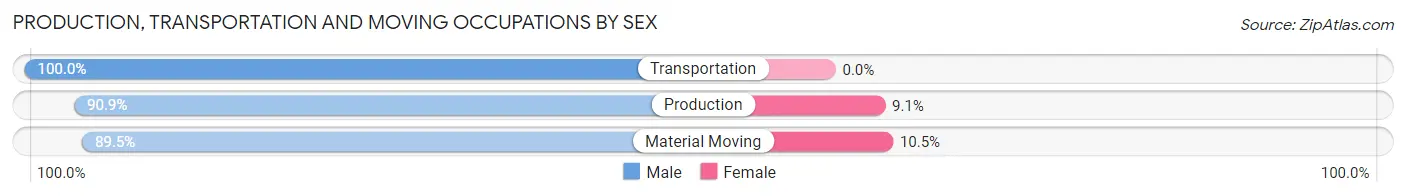
| Occupation | Male | Female |
| Production | 10 (90.9%) | 1 (9.1%) |
| Transportation | 2 (100.0%) | 0 (0.0%) |
| Material Moving | 17 (89.5%) | 2 (10.5%) |
| Total (Category) | 29 (90.6%) | 3 (9.4%) |
| Total (Overall) | 67 (59.8%) | 45 (40.2%) |
Employment Industries by Sex in Harrison
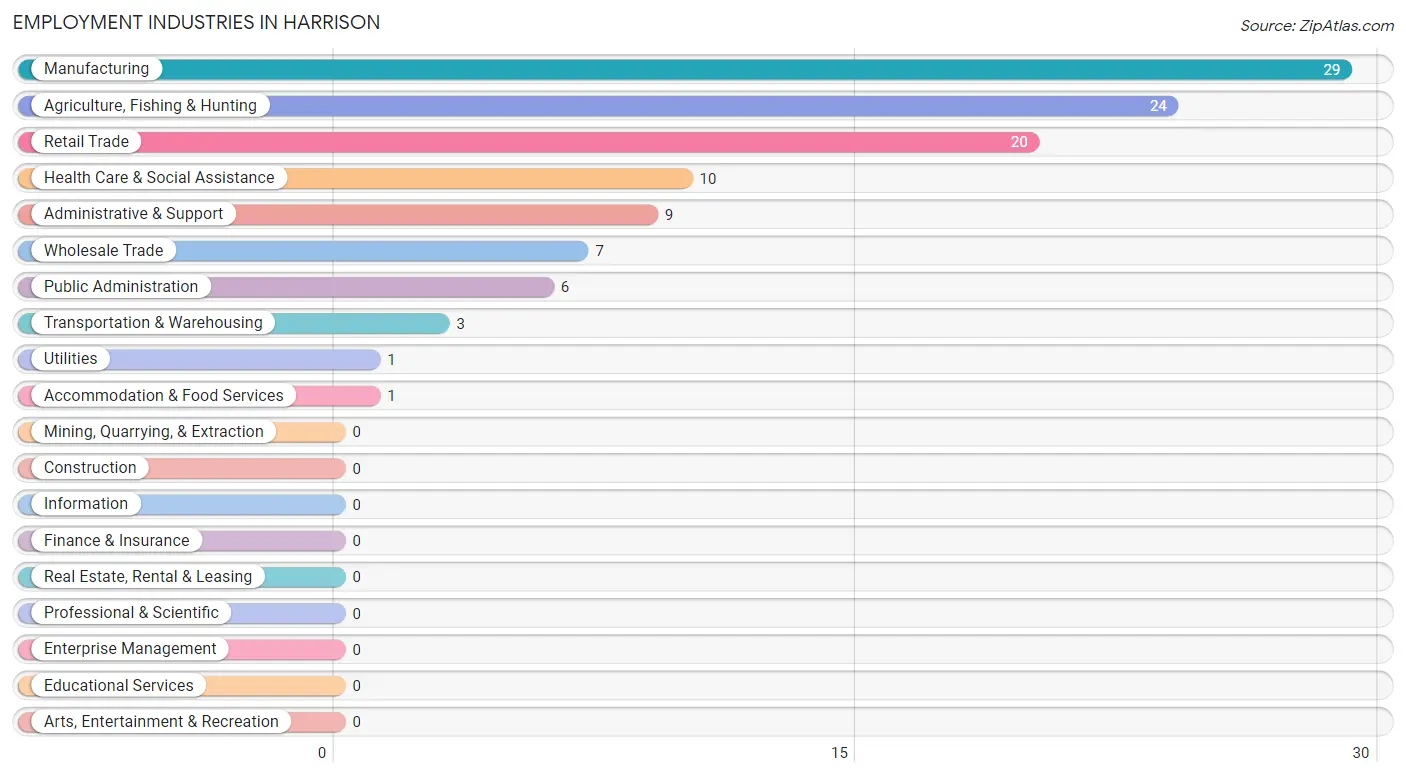
Employment Industries in Harrison
The major employment industries in Harrison include Manufacturing (29 | 25.9%), Agriculture, Fishing & Hunting (24 | 21.4%), Retail Trade (20 | 17.9%), Health Care & Social Assistance (10 | 8.9%), and Administrative & Support (9 | 8.0%).
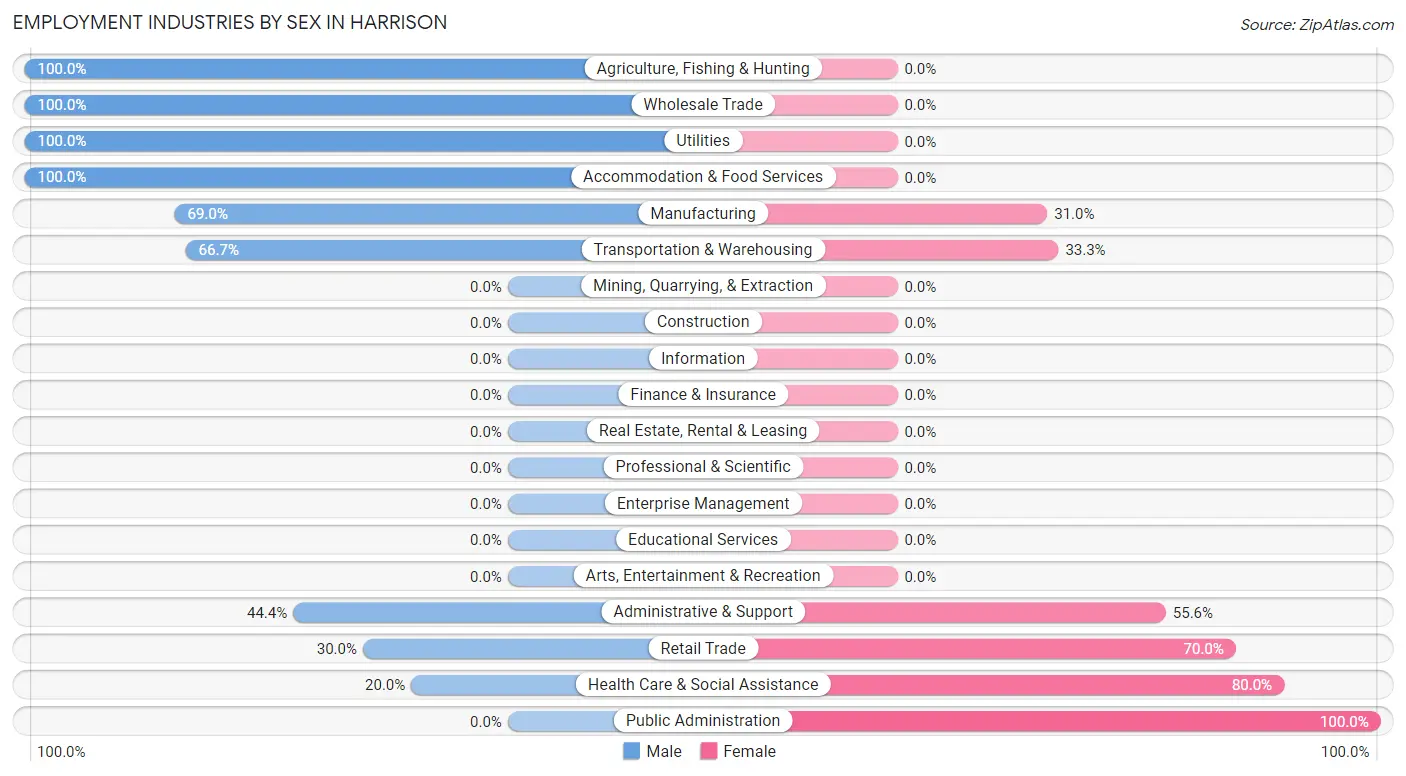
Employment Industries by Sex in Harrison
The Harrison industries that see more men than women are Agriculture, Fishing & Hunting (100.0%), Wholesale Trade (100.0%), and Utilities (100.0%), whereas the industries that tend to have a higher number of women are Public Administration (100.0%), Health Care & Social Assistance (80.0%), and Retail Trade (70.0%).
| Industry | Male | Female |
| Agriculture, Fishing & Hunting | 24 (100.0%) | 0 (0.0%) |
| Mining, Quarrying, & Extraction | 0 (0.0%) | 0 (0.0%) |
| Construction | 0 (0.0%) | 0 (0.0%) |
| Manufacturing | 20 (69.0%) | 9 (31.0%) |
| Wholesale Trade | 7 (100.0%) | 0 (0.0%) |
| Retail Trade | 6 (30.0%) | 14 (70.0%) |
| Transportation & Warehousing | 2 (66.7%) | 1 (33.3%) |
| Utilities | 1 (100.0%) | 0 (0.0%) |
| Information | 0 (0.0%) | 0 (0.0%) |
| Finance & Insurance | 0 (0.0%) | 0 (0.0%) |
| Real Estate, Rental & Leasing | 0 (0.0%) | 0 (0.0%) |
| Professional & Scientific | 0 (0.0%) | 0 (0.0%) |
| Enterprise Management | 0 (0.0%) | 0 (0.0%) |
| Administrative & Support | 4 (44.4%) | 5 (55.6%) |
| Educational Services | 0 (0.0%) | 0 (0.0%) |
| Health Care & Social Assistance | 2 (20.0%) | 8 (80.0%) |
| Arts, Entertainment & Recreation | 0 (0.0%) | 0 (0.0%) |
| Accommodation & Food Services | 1 (100.0%) | 0 (0.0%) |
| Public Administration | 0 (0.0%) | 6 (100.0%) |
| Total | 67 (59.8%) | 45 (40.2%) |
Education in Harrison
School Enrollment in Harrison
The most common levels of schooling among the 72 students in Harrison are middle school (30 | 41.7%), high school (19 | 26.4%), and college / undergraduate (13 | 18.1%).
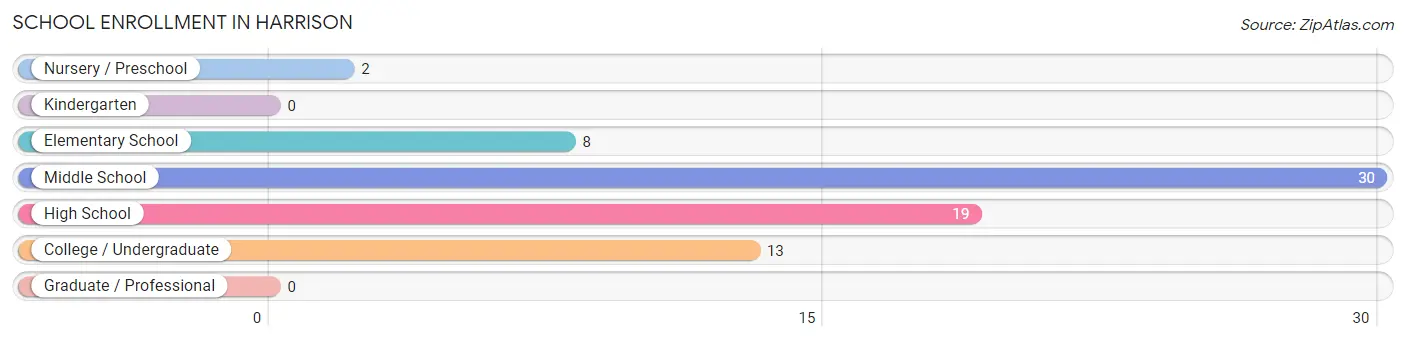
| School Level | # Students | % Students |
| Nursery / Preschool | 2 | 2.8% |
| Kindergarten | 0 | 0.0% |
| Elementary School | 8 | 11.1% |
| Middle School | 30 | 41.7% |
| High School | 19 | 26.4% |
| College / Undergraduate | 13 | 18.1% |
| Graduate / Professional | 0 | 0.0% |
| Total | 72 | 100.0% |
School Enrollment by Age by Funding Source in Harrison
Out of a total of 72 students who are enrolled in schools in Harrison, 5 (6.9%) attend a private institution, while the remaining 67 (93.1%) are enrolled in public schools. The age group of 15 to 17 year olds has the highest likelihood of being enrolled in private schools, with 5 (41.7% in the age bracket) enrolled. Conversely, the age group of 3 to 4 year olds has the lowest likelihood of being enrolled in a private school, with 2 (100.0% in the age bracket) attending a public institution.
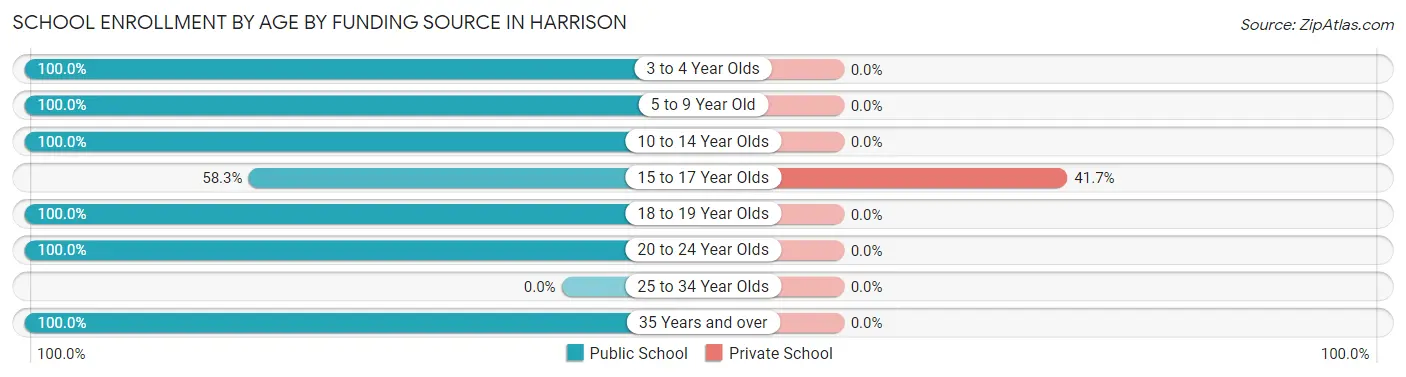
| Age Bracket | Public School | Private School |
| 3 to 4 Year Olds | 2 (100.0%) | 0 (0.0%) |
| 5 to 9 Year Old | 8 (100.0%) | 0 (0.0%) |
| 10 to 14 Year Olds | 30 (100.0%) | 0 (0.0%) |
| 15 to 17 Year Olds | 7 (58.3%) | 5 (41.7%) |
| 18 to 19 Year Olds | 7 (100.0%) | 0 (0.0%) |
| 20 to 24 Year Olds | 3 (100.0%) | 0 (0.0%) |
| 25 to 34 Year Olds | 0 (0.0%) | 0 (0.0%) |
| 35 Years and over | 10 (100.0%) | 0 (0.0%) |
| Total | 67 (93.1%) | 5 (6.9%) |
Educational Attainment by Field of Study in Harrison
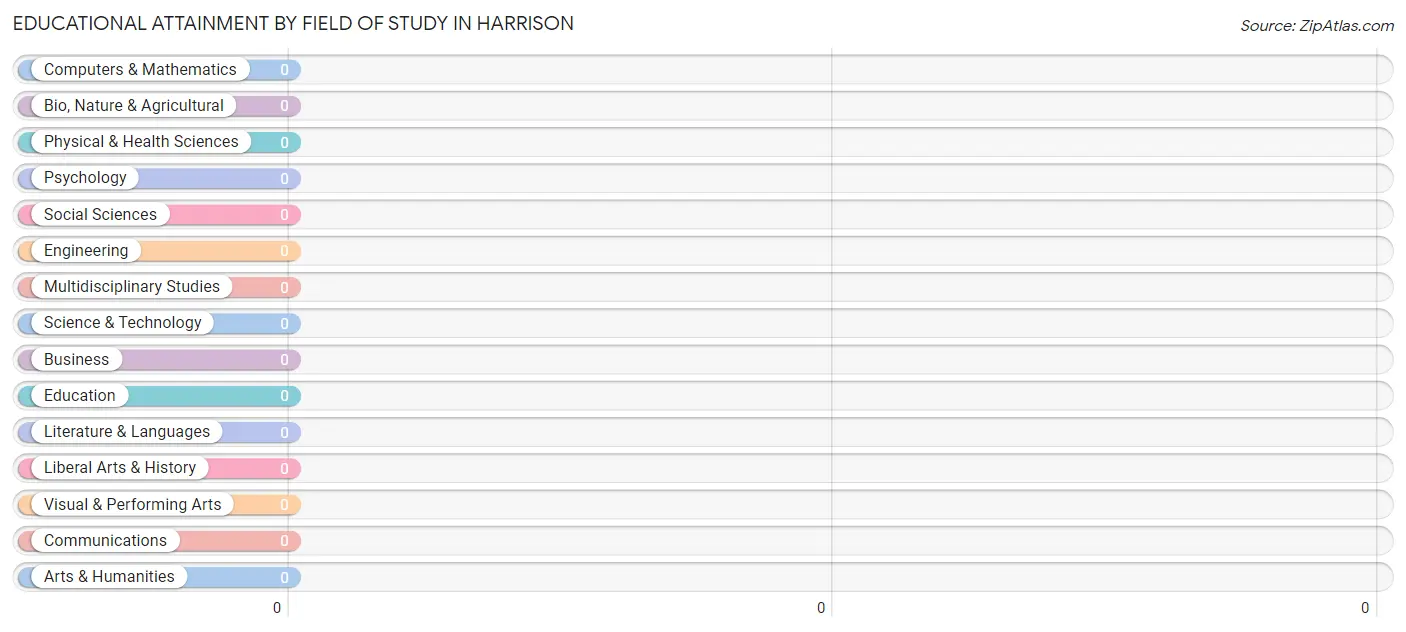
| Field of Study | # Graduates | % Graduates |
| Computers & Mathematics | 0 | 0.0% |
| Bio, Nature & Agricultural | 0 | 0.0% |
| Physical & Health Sciences | 0 | 0.0% |
| Psychology | 0 | 0.0% |
| Social Sciences | 0 | 0.0% |
| Engineering | 0 | 0.0% |
| Multidisciplinary Studies | 0 | 0.0% |
| Science & Technology | 0 | 0.0% |
| Business | 0 | 0.0% |
| Education | 0 | 0.0% |
| Literature & Languages | 0 | 0.0% |
| Liberal Arts & History | 0 | 0.0% |
| Visual & Performing Arts | 0 | 0.0% |
| Communications | 0 | 0.0% |
| Arts & Humanities | 0 | 0.0% |
| Total | 0 | 0.0% |
Transportation & Commute in Harrison
Vehicle Availability by Sex in Harrison
The most prevalent vehicle ownership categories in Harrison are males with 2 vehicles (34, accounting for 50.7%) and females with 2 vehicles (14, making up 75.6%).
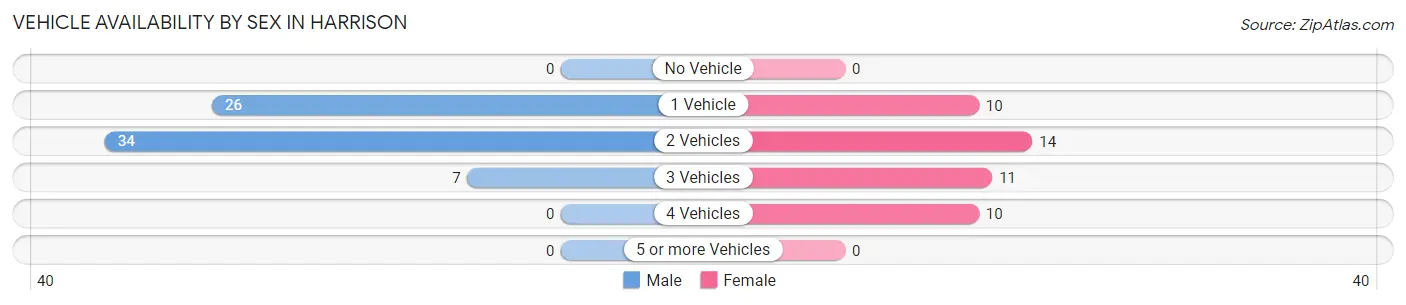
| Vehicles Available | Male | Female |
| No Vehicle | 0 (0.0%) | 0 (0.0%) |
| 1 Vehicle | 26 (38.8%) | 10 (22.2%) |
| 2 Vehicles | 34 (50.7%) | 14 (31.1%) |
| 3 Vehicles | 7 (10.4%) | 11 (24.4%) |
| 4 Vehicles | 0 (0.0%) | 10 (22.2%) |
| 5 or more Vehicles | 0 (0.0%) | 0 (0.0%) |
| Total | 67 (100.0%) | 45 (100.0%) |
Commute Time in Harrison
The most frequently occuring commute durations in Harrison are 30 to 34 minutes (33 commuters, 29.5%), 15 to 19 minutes (29 commuters, 25.9%), and 20 to 24 minutes (24 commuters, 21.4%).
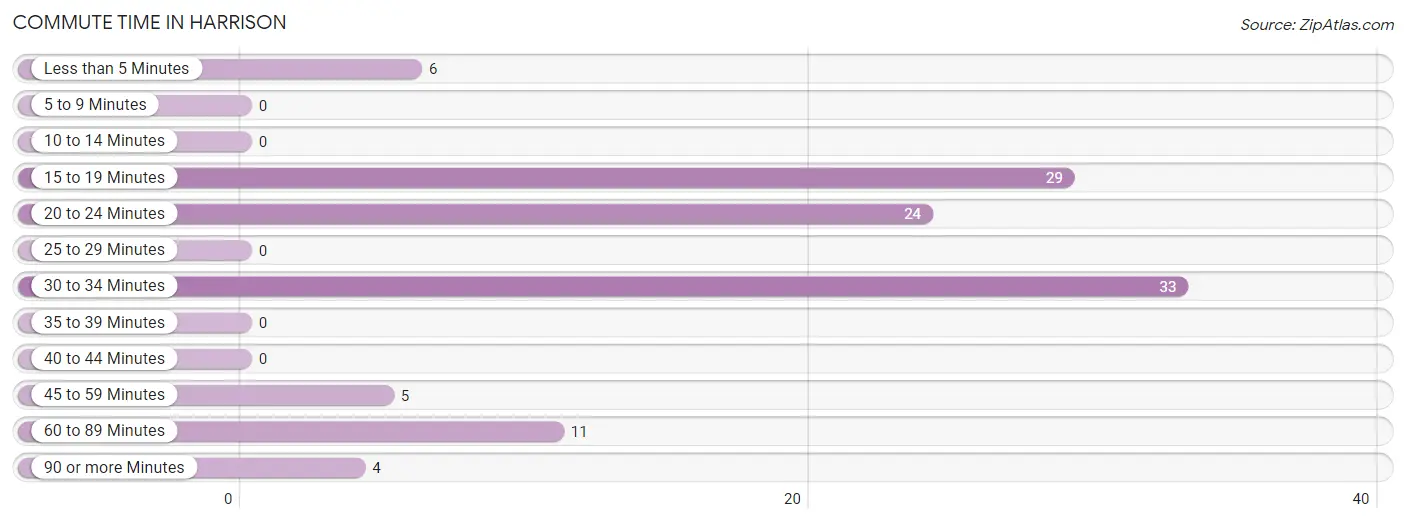
| Commute Time | # Commuters | % Commuters |
| Less than 5 Minutes | 6 | 5.4% |
| 5 to 9 Minutes | 0 | 0.0% |
| 10 to 14 Minutes | 0 | 0.0% |
| 15 to 19 Minutes | 29 | 25.9% |
| 20 to 24 Minutes | 24 | 21.4% |
| 25 to 29 Minutes | 0 | 0.0% |
| 30 to 34 Minutes | 33 | 29.5% |
| 35 to 39 Minutes | 0 | 0.0% |
| 40 to 44 Minutes | 0 | 0.0% |
| 45 to 59 Minutes | 5 | 4.5% |
| 60 to 89 Minutes | 11 | 9.8% |
| 90 or more Minutes | 4 | 3.6% |
Commute Time by Sex in Harrison
The most common commute times in Harrison are 30 to 34 minutes (27 commuters, 40.3%) for males and 15 to 19 minutes (13 commuters, 28.9%) for females.
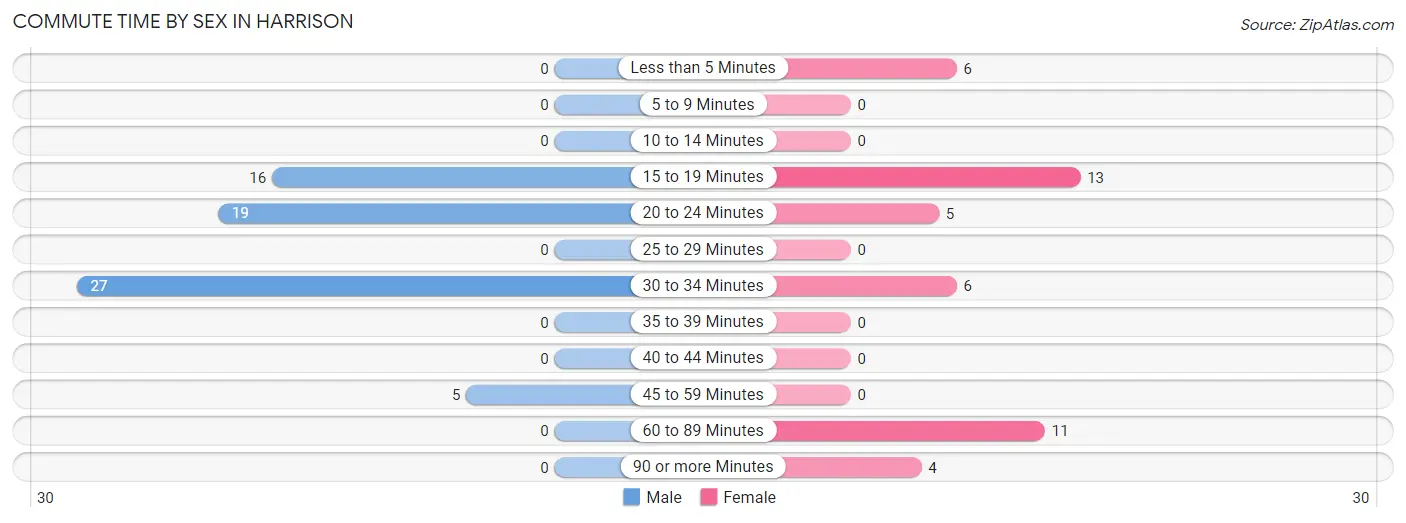
| Commute Time | Male | Female |
| Less than 5 Minutes | 0 (0.0%) | 6 (13.3%) |
| 5 to 9 Minutes | 0 (0.0%) | 0 (0.0%) |
| 10 to 14 Minutes | 0 (0.0%) | 0 (0.0%) |
| 15 to 19 Minutes | 16 (23.9%) | 13 (28.9%) |
| 20 to 24 Minutes | 19 (28.4%) | 5 (11.1%) |
| 25 to 29 Minutes | 0 (0.0%) | 0 (0.0%) |
| 30 to 34 Minutes | 27 (40.3%) | 6 (13.3%) |
| 35 to 39 Minutes | 0 (0.0%) | 0 (0.0%) |
| 40 to 44 Minutes | 0 (0.0%) | 0 (0.0%) |
| 45 to 59 Minutes | 5 (7.5%) | 0 (0.0%) |
| 60 to 89 Minutes | 0 (0.0%) | 11 (24.4%) |
| 90 or more Minutes | 0 (0.0%) | 4 (8.9%) |
Time of Departure to Work by Sex in Harrison
The most frequent times of departure to work in Harrison are 7:00 AM to 7:29 AM (24, 35.8%) for males and 8:00 AM to 8:29 AM (11, 24.4%) for females.
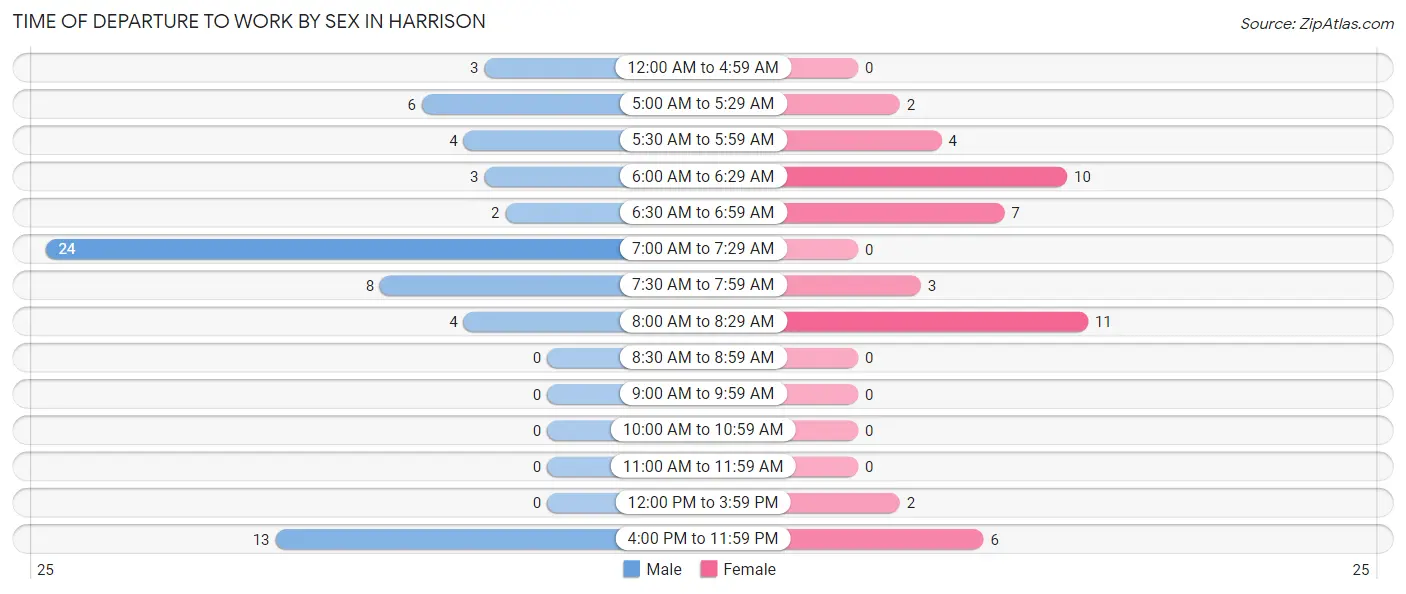
| Time of Departure | Male | Female |
| 12:00 AM to 4:59 AM | 3 (4.5%) | 0 (0.0%) |
| 5:00 AM to 5:29 AM | 6 (9.0%) | 2 (4.4%) |
| 5:30 AM to 5:59 AM | 4 (6.0%) | 4 (8.9%) |
| 6:00 AM to 6:29 AM | 3 (4.5%) | 10 (22.2%) |
| 6:30 AM to 6:59 AM | 2 (3.0%) | 7 (15.6%) |
| 7:00 AM to 7:29 AM | 24 (35.8%) | 0 (0.0%) |
| 7:30 AM to 7:59 AM | 8 (11.9%) | 3 (6.7%) |
| 8:00 AM to 8:29 AM | 4 (6.0%) | 11 (24.4%) |
| 8:30 AM to 8:59 AM | 0 (0.0%) | 0 (0.0%) |
| 9:00 AM to 9:59 AM | 0 (0.0%) | 0 (0.0%) |
| 10:00 AM to 10:59 AM | 0 (0.0%) | 0 (0.0%) |
| 11:00 AM to 11:59 AM | 0 (0.0%) | 0 (0.0%) |
| 12:00 PM to 3:59 PM | 0 (0.0%) | 2 (4.4%) |
| 4:00 PM to 11:59 PM | 13 (19.4%) | 6 (13.3%) |
| Total | 67 (100.0%) | 45 (100.0%) |
Housing Occupancy in Harrison
Occupancy by Ownership in Harrison
Of the total 150 dwellings in Harrison, owner-occupied units account for 87 (58.0%), while renter-occupied units make up 63 (42.0%).
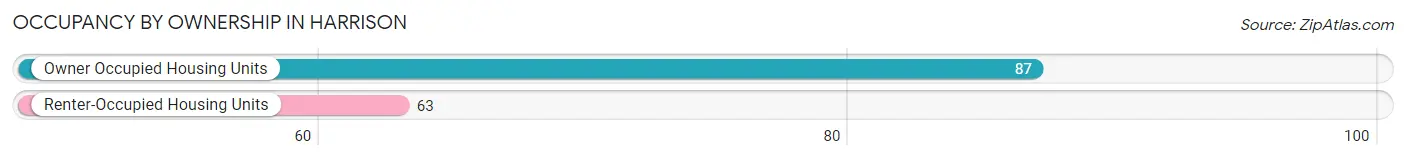
| Occupancy | # Housing Units | % Housing Units |
| Owner Occupied Housing Units | 87 | 58.0% |
| Renter-Occupied Housing Units | 63 | 42.0% |
| Total Occupied Housing Units | 150 | 100.0% |
Occupancy by Household Size in Harrison
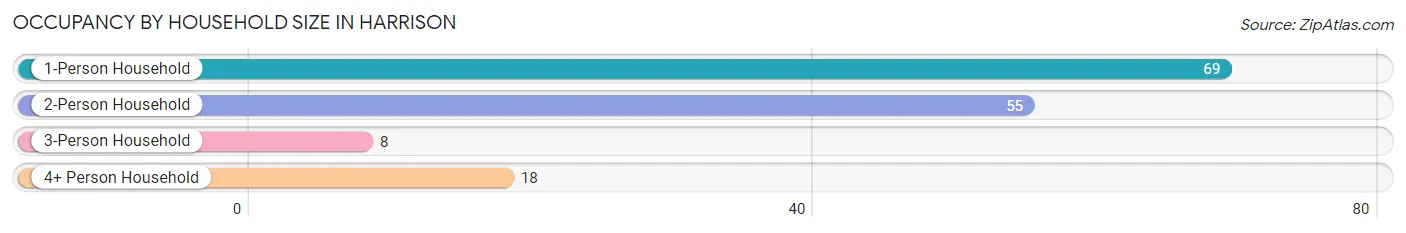
| Household Size | # Housing Units | % Housing Units |
| 1-Person Household | 69 | 46.0% |
| 2-Person Household | 55 | 36.7% |
| 3-Person Household | 8 | 5.3% |
| 4+ Person Household | 18 | 12.0% |
| Total Housing Units | 150 | 100.0% |
Occupancy by Ownership by Household Size in Harrison
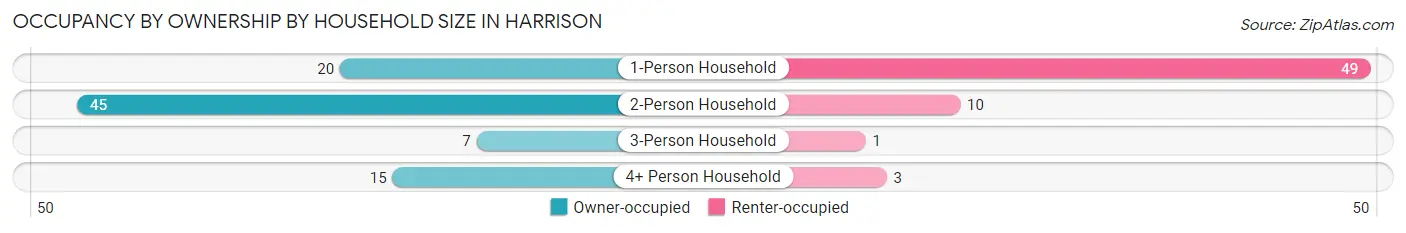
| Household Size | Owner-occupied | Renter-occupied |
| 1-Person Household | 20 (29.0%) | 49 (71.0%) |
| 2-Person Household | 45 (81.8%) | 10 (18.2%) |
| 3-Person Household | 7 (87.5%) | 1 (12.5%) |
| 4+ Person Household | 15 (83.3%) | 3 (16.7%) |
| Total Housing Units | 87 (58.0%) | 63 (42.0%) |
Occupancy by Educational Attainment in Harrison
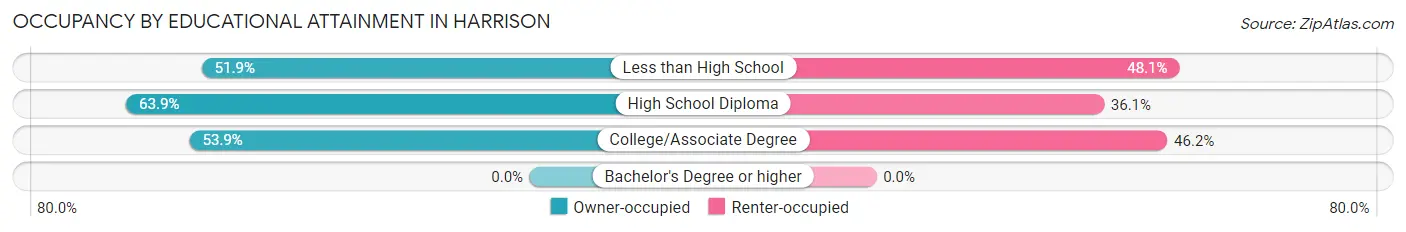
| Household Size | Owner-occupied | Renter-occupied |
| Less than High School | 27 (51.9%) | 25 (48.1%) |
| High School Diploma | 46 (63.9%) | 26 (36.1%) |
| College/Associate Degree | 14 (53.8%) | 12 (46.2%) |
| Bachelor's Degree or higher | 0 (0.0%) | 0 (0.0%) |
Occupancy by Age of Householder in Harrison
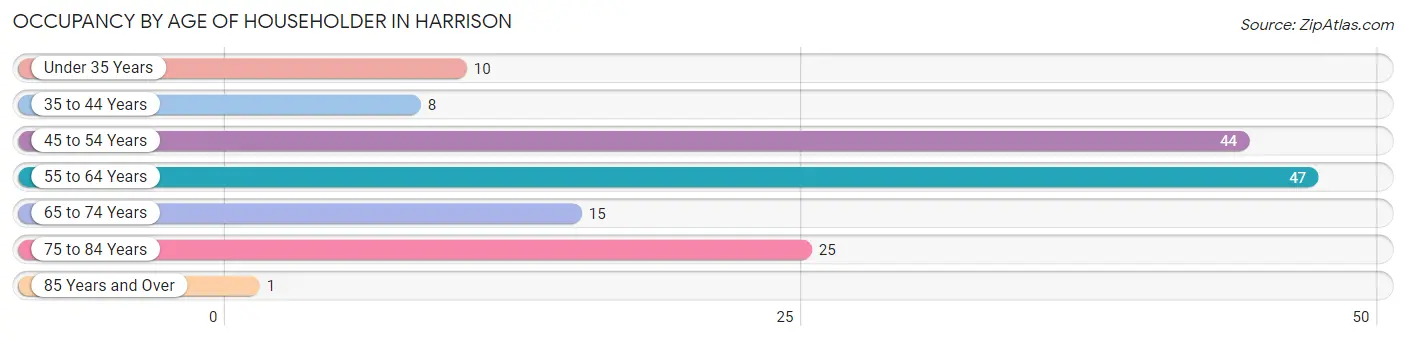
| Age Bracket | # Households | % Households |
| Under 35 Years | 10 | 6.7% |
| 35 to 44 Years | 8 | 5.3% |
| 45 to 54 Years | 44 | 29.3% |
| 55 to 64 Years | 47 | 31.3% |
| 65 to 74 Years | 15 | 10.0% |
| 75 to 84 Years | 25 | 16.7% |
| 85 Years and Over | 1 | 0.7% |
| Total | 150 | 100.0% |
Housing Finances in Harrison
Median Income by Occupancy in Harrison
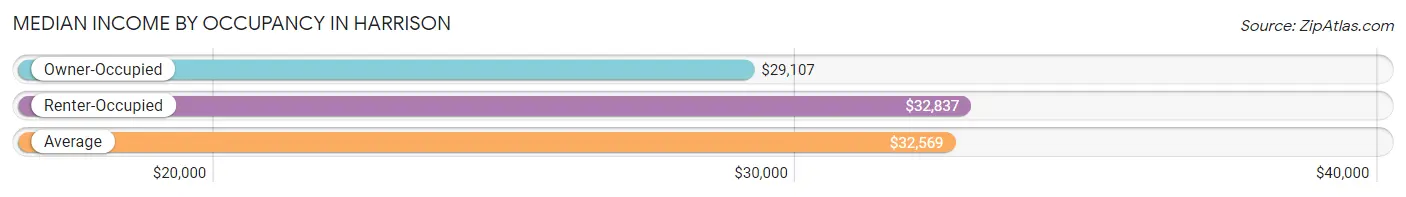
| Occupancy Type | # Households | Median Income |
| Owner-Occupied | 87 (58.0%) | $29,107 |
| Renter-Occupied | 63 (42.0%) | $32,837 |
| Average | 150 (100.0%) | $32,569 |
Occupancy by Householder Income Bracket in Harrison
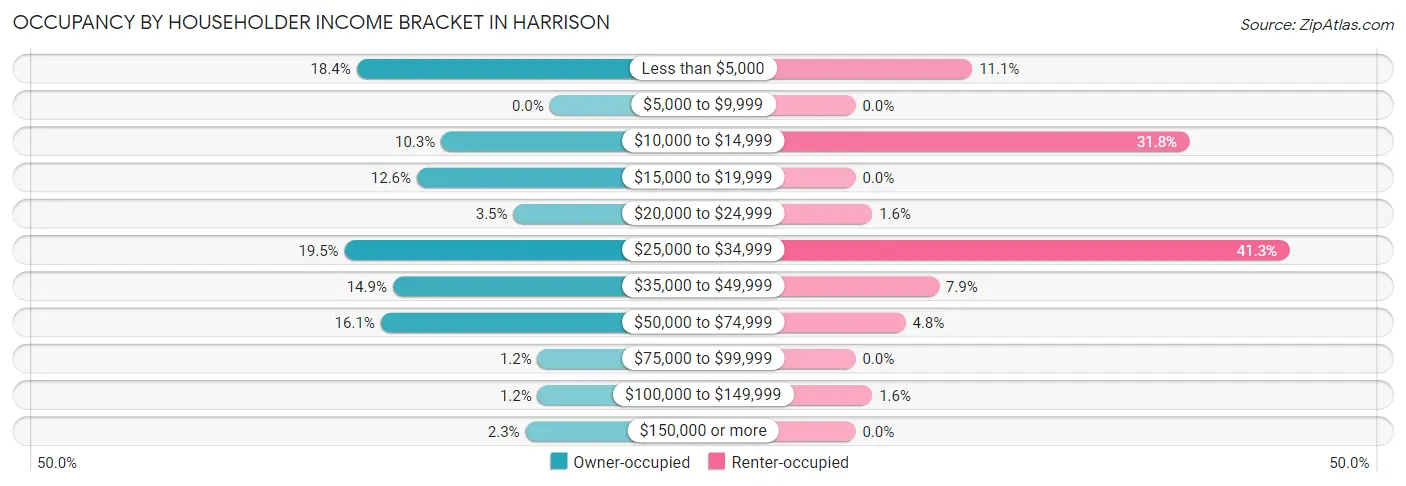
| Income Bracket | Owner-occupied | Renter-occupied |
| Less than $5,000 | 16 (18.4%) | 7 (11.1%) |
| $5,000 to $9,999 | 0 (0.0%) | 0 (0.0%) |
| $10,000 to $14,999 | 9 (10.3%) | 20 (31.8%) |
| $15,000 to $19,999 | 11 (12.6%) | 0 (0.0%) |
| $20,000 to $24,999 | 3 (3.5%) | 1 (1.6%) |
| $25,000 to $34,999 | 17 (19.5%) | 26 (41.3%) |
| $35,000 to $49,999 | 13 (14.9%) | 5 (7.9%) |
| $50,000 to $74,999 | 14 (16.1%) | 3 (4.8%) |
| $75,000 to $99,999 | 1 (1.1%) | 0 (0.0%) |
| $100,000 to $149,999 | 1 (1.1%) | 1 (1.6%) |
| $150,000 or more | 2 (2.3%) | 0 (0.0%) |
| Total | 87 (100.0%) | 63 (100.0%) |
Monthly Housing Cost Tiers in Harrison
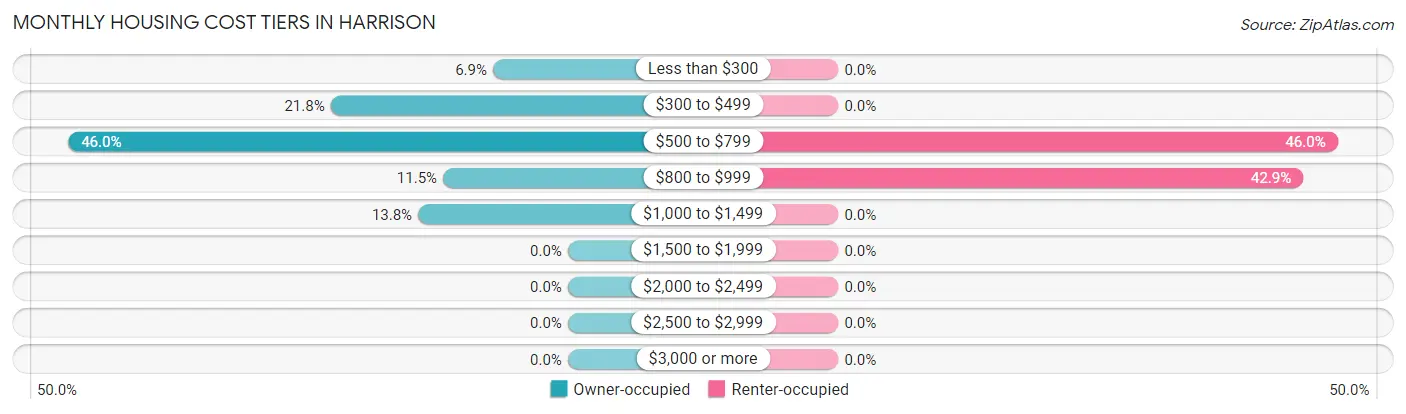
| Monthly Cost | Owner-occupied | Renter-occupied |
| Less than $300 | 6 (6.9%) | 0 (0.0%) |
| $300 to $499 | 19 (21.8%) | 0 (0.0%) |
| $500 to $799 | 40 (46.0%) | 29 (46.0%) |
| $800 to $999 | 10 (11.5%) | 27 (42.9%) |
| $1,000 to $1,499 | 12 (13.8%) | 0 (0.0%) |
| $1,500 to $1,999 | 0 (0.0%) | 0 (0.0%) |
| $2,000 to $2,499 | 0 (0.0%) | 0 (0.0%) |
| $2,500 to $2,999 | 0 (0.0%) | 0 (0.0%) |
| $3,000 or more | 0 (0.0%) | 0 (0.0%) |
| Total | 87 (100.0%) | 63 (100.0%) |
Physical Housing Characteristics in Harrison
Housing Structures in Harrison
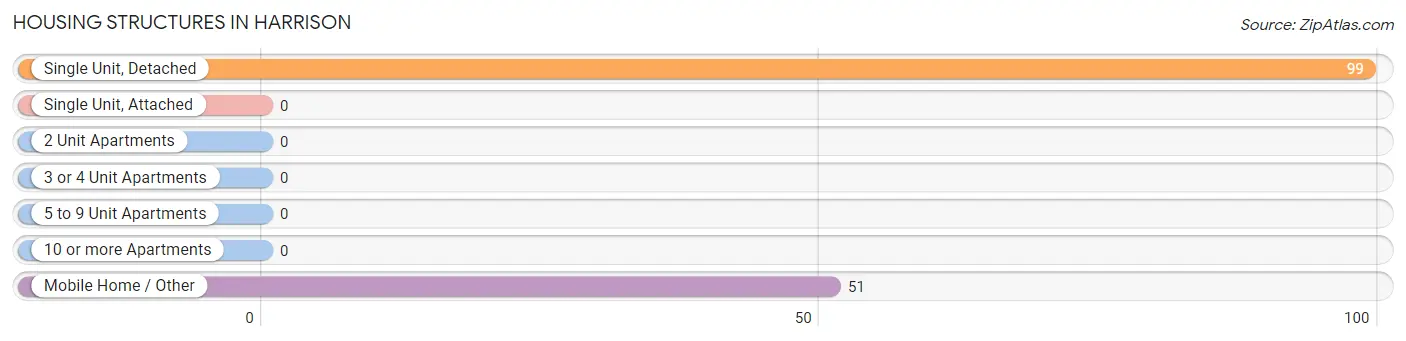
| Structure Type | # Housing Units | % Housing Units |
| Single Unit, Detached | 99 | 66.0% |
| Single Unit, Attached | 0 | 0.0% |
| 2 Unit Apartments | 0 | 0.0% |
| 3 or 4 Unit Apartments | 0 | 0.0% |
| 5 to 9 Unit Apartments | 0 | 0.0% |
| 10 or more Apartments | 0 | 0.0% |
| Mobile Home / Other | 51 | 34.0% |
| Total | 150 | 100.0% |
Housing Structures by Occupancy in Harrison
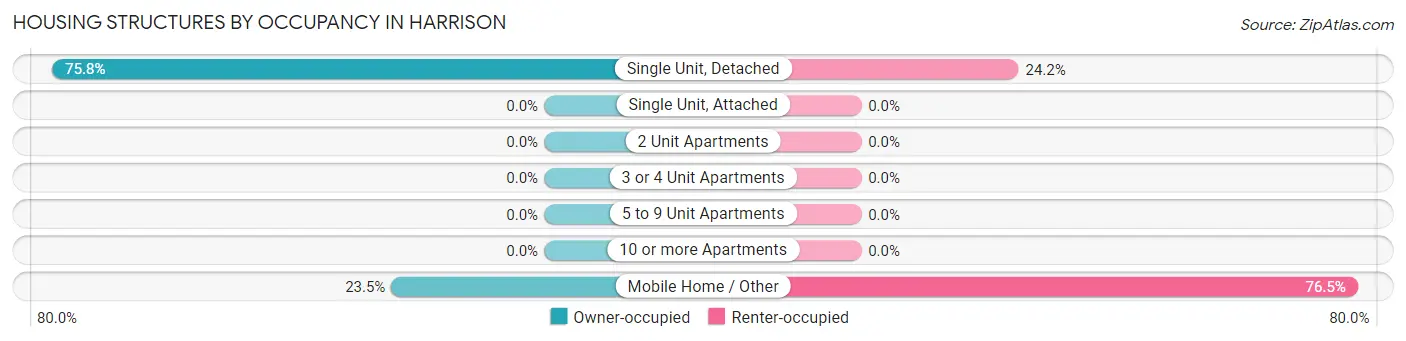
| Structure Type | Owner-occupied | Renter-occupied |
| Single Unit, Detached | 75 (75.8%) | 24 (24.2%) |
| Single Unit, Attached | 0 (0.0%) | 0 (0.0%) |
| 2 Unit Apartments | 0 (0.0%) | 0 (0.0%) |
| 3 or 4 Unit Apartments | 0 (0.0%) | 0 (0.0%) |
| 5 to 9 Unit Apartments | 0 (0.0%) | 0 (0.0%) |
| 10 or more Apartments | 0 (0.0%) | 0 (0.0%) |
| Mobile Home / Other | 12 (23.5%) | 39 (76.5%) |
| Total | 87 (58.0%) | 63 (42.0%) |
Housing Structures by Number of Rooms in Harrison
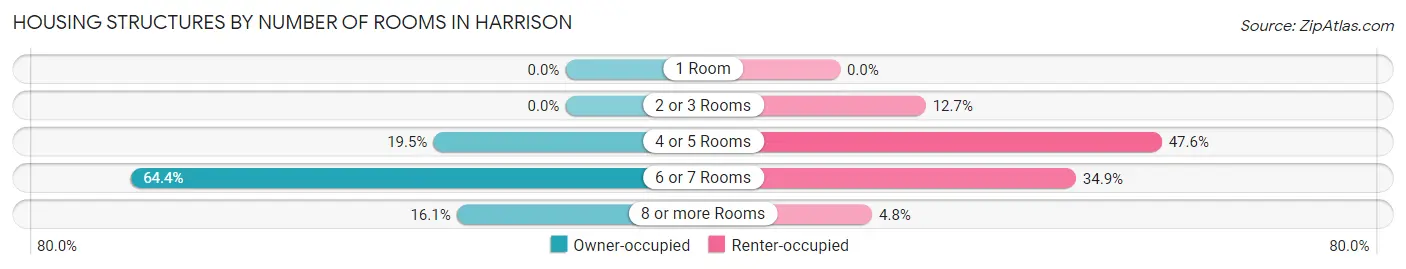
| Number of Rooms | Owner-occupied | Renter-occupied |
| 1 Room | 0 (0.0%) | 0 (0.0%) |
| 2 or 3 Rooms | 0 (0.0%) | 8 (12.7%) |
| 4 or 5 Rooms | 17 (19.5%) | 30 (47.6%) |
| 6 or 7 Rooms | 56 (64.4%) | 22 (34.9%) |
| 8 or more Rooms | 14 (16.1%) | 3 (4.8%) |
| Total | 87 (100.0%) | 63 (100.0%) |
Housing Structure by Heating Type in Harrison
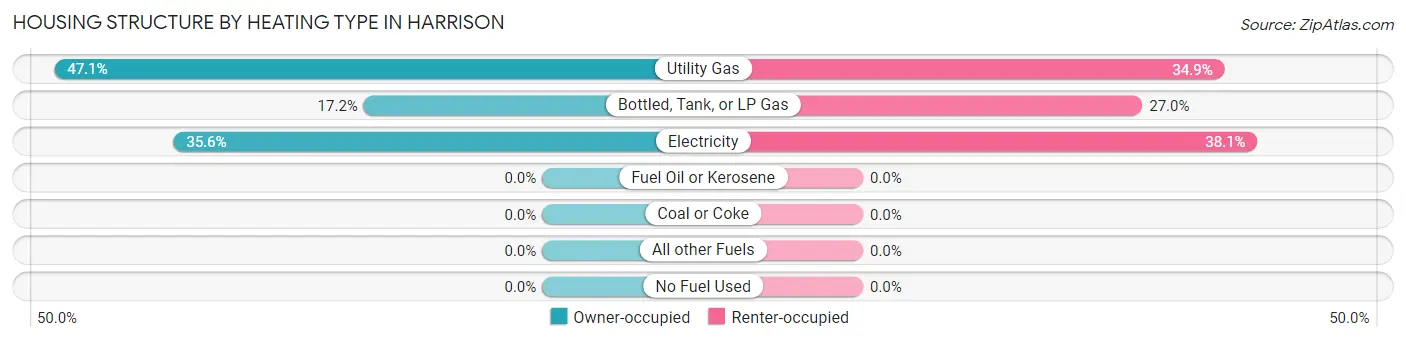
| Heating Type | Owner-occupied | Renter-occupied |
| Utility Gas | 41 (47.1%) | 22 (34.9%) |
| Bottled, Tank, or LP Gas | 15 (17.2%) | 17 (27.0%) |
| Electricity | 31 (35.6%) | 24 (38.1%) |
| Fuel Oil or Kerosene | 0 (0.0%) | 0 (0.0%) |
| Coal or Coke | 0 (0.0%) | 0 (0.0%) |
| All other Fuels | 0 (0.0%) | 0 (0.0%) |
| No Fuel Used | 0 (0.0%) | 0 (0.0%) |
| Total | 87 (100.0%) | 63 (100.0%) |
Household Vehicle Usage in Harrison
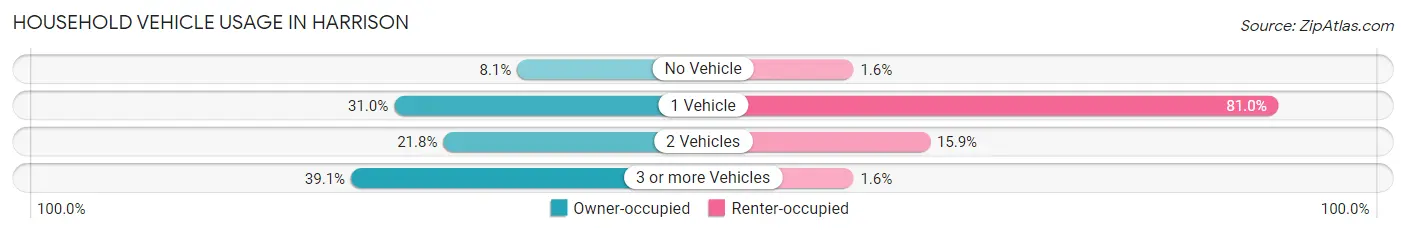
| Vehicles per Household | Owner-occupied | Renter-occupied |
| No Vehicle | 7 (8.1%) | 1 (1.6%) |
| 1 Vehicle | 27 (31.0%) | 51 (80.9%) |
| 2 Vehicles | 19 (21.8%) | 10 (15.9%) |
| 3 or more Vehicles | 34 (39.1%) | 1 (1.6%) |
| Total | 87 (100.0%) | 63 (100.0%) |
Real Estate & Mortgages in Harrison
Real Estate and Mortgage Overview in Harrison
| Characteristic | Without Mortgage | With Mortgage |
| Housing Units | 60 | 27 |
| Median Property Value | $103,100 | $0 |
| Median Household Income | $29,000 | $0 |
| Monthly Housing Costs | $627 | $0 |
| Real Estate Taxes | $733 | $2 |
Property Value by Mortgage Status in Harrison
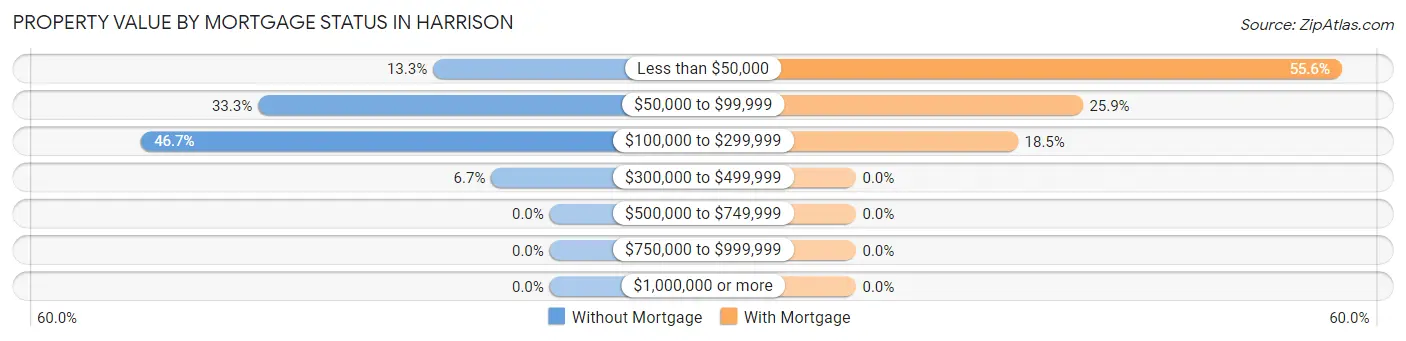
| Property Value | Without Mortgage | With Mortgage |
| Less than $50,000 | 8 (13.3%) | 15 (55.6%) |
| $50,000 to $99,999 | 20 (33.3%) | 7 (25.9%) |
| $100,000 to $299,999 | 28 (46.7%) | 5 (18.5%) |
| $300,000 to $499,999 | 4 (6.7%) | 0 (0.0%) |
| $500,000 to $749,999 | 0 (0.0%) | 0 (0.0%) |
| $750,000 to $999,999 | 0 (0.0%) | 0 (0.0%) |
| $1,000,000 or more | 0 (0.0%) | 0 (0.0%) |
| Total | 60 (100.0%) | 27 (100.0%) |
Household Income by Mortgage Status in Harrison
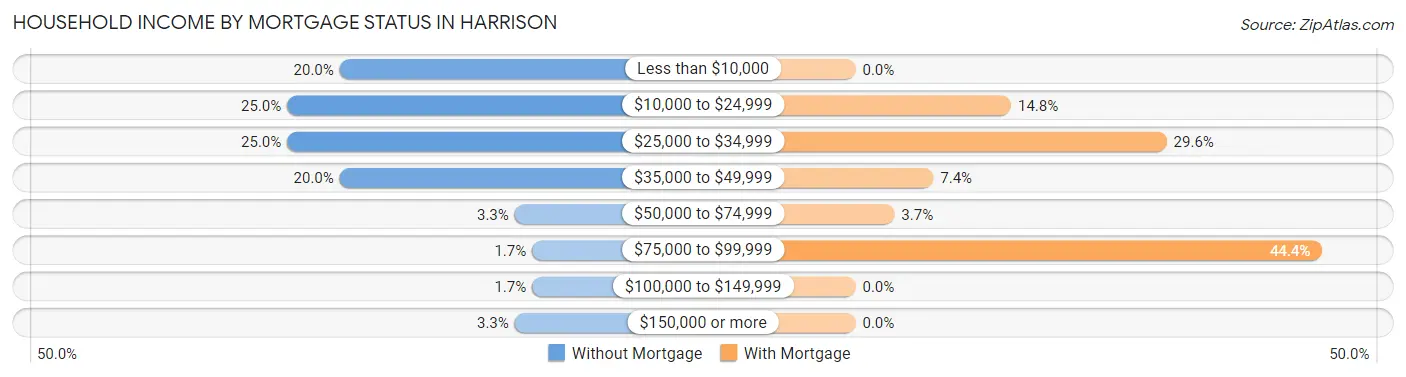
| Household Income | Without Mortgage | With Mortgage |
| Less than $10,000 | 12 (20.0%) | 0 (0.0%) |
| $10,000 to $24,999 | 15 (25.0%) | 4 (14.8%) |
| $25,000 to $34,999 | 15 (25.0%) | 8 (29.6%) |
| $35,000 to $49,999 | 12 (20.0%) | 2 (7.4%) |
| $50,000 to $74,999 | 2 (3.3%) | 1 (3.7%) |
| $75,000 to $99,999 | 1 (1.7%) | 12 (44.4%) |
| $100,000 to $149,999 | 1 (1.7%) | 0 (0.0%) |
| $150,000 or more | 2 (3.3%) | 0 (0.0%) |
| Total | 60 (100.0%) | 27 (100.0%) |
Property Value to Household Income Ratio in Harrison
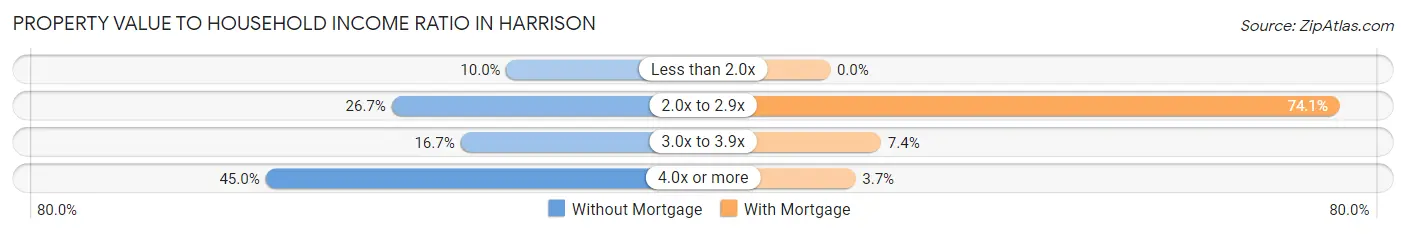
| Value-to-Income Ratio | Without Mortgage | With Mortgage |
| Less than 2.0x | 6 (10.0%) | 0 (0.0%) |
| 2.0x to 2.9x | 16 (26.7%) | 20 (74.1%) |
| 3.0x to 3.9x | 10 (16.7%) | 2 (7.4%) |
| 4.0x or more | 27 (45.0%) | 1 (3.7%) |
| Total | 60 (100.0%) | 27 (100.0%) |
Real Estate Taxes by Mortgage Status in Harrison
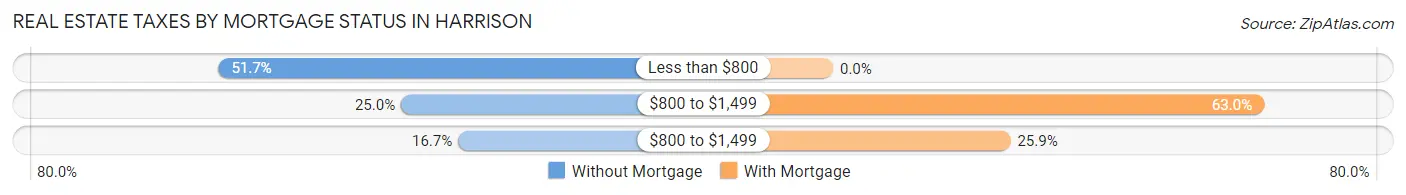
| Property Taxes | Without Mortgage | With Mortgage |
| Less than $800 | 31 (51.7%) | 0 (0.0%) |
| $800 to $1,499 | 15 (25.0%) | 17 (63.0%) |
| $800 to $1,499 | 10 (16.7%) | 7 (25.9%) |
| Total | 60 (100.0%) | 27 (100.0%) |
Health & Disability in Harrison
Health Insurance Coverage by Age in Harrison
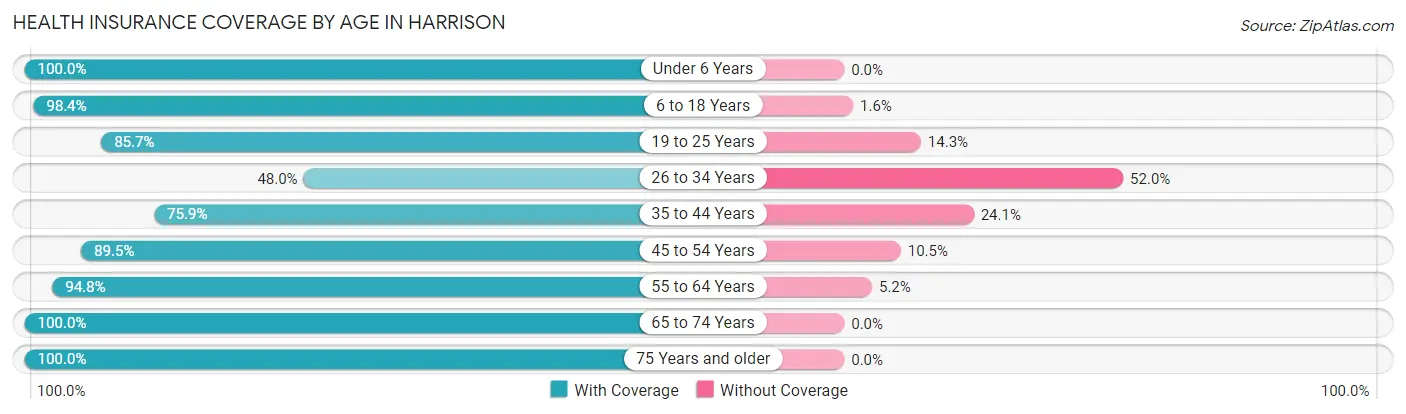
| Age Bracket | With Coverage | Without Coverage |
| Under 6 Years | 15 (100.0%) | 0 (0.0%) |
| 6 to 18 Years | 60 (98.4%) | 1 (1.6%) |
| 19 to 25 Years | 12 (85.7%) | 2 (14.3%) |
| 26 to 34 Years | 24 (48.0%) | 26 (52.0%) |
| 35 to 44 Years | 22 (75.9%) | 7 (24.1%) |
| 45 to 54 Years | 51 (89.5%) | 6 (10.5%) |
| 55 to 64 Years | 55 (94.8%) | 3 (5.2%) |
| 65 to 74 Years | 18 (100.0%) | 0 (0.0%) |
| 75 Years and older | 43 (100.0%) | 0 (0.0%) |
| Total | 300 (87.0%) | 45 (13.0%) |
Health Insurance Coverage by Citizenship Status in Harrison
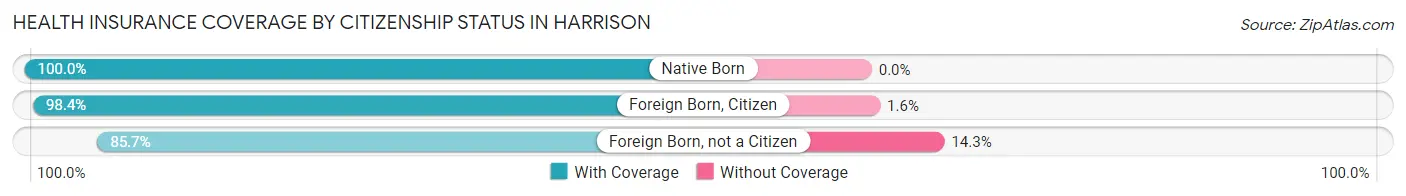
| Citizenship Status | With Coverage | Without Coverage |
| Native Born | 15 (100.0%) | 0 (0.0%) |
| Foreign Born, Citizen | 60 (98.4%) | 1 (1.6%) |
| Foreign Born, not a Citizen | 12 (85.7%) | 2 (14.3%) |
Health Insurance Coverage by Household Income in Harrison
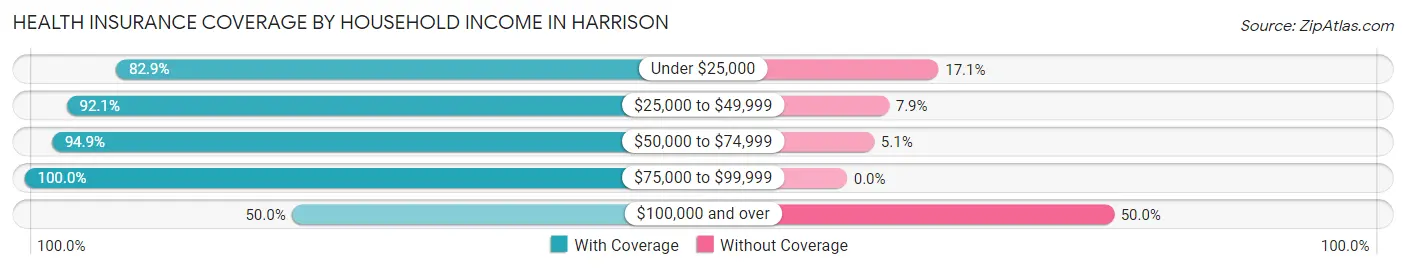
| Household Income | With Coverage | Without Coverage |
| Under $25,000 | 116 (82.9%) | 24 (17.1%) |
| $25,000 to $49,999 | 117 (92.1%) | 10 (7.9%) |
| $50,000 to $74,999 | 56 (94.9%) | 3 (5.1%) |
| $75,000 to $99,999 | 3 (100.0%) | 0 (0.0%) |
| $100,000 and over | 8 (50.0%) | 8 (50.0%) |
Public vs Private Health Insurance Coverage by Age in Harrison
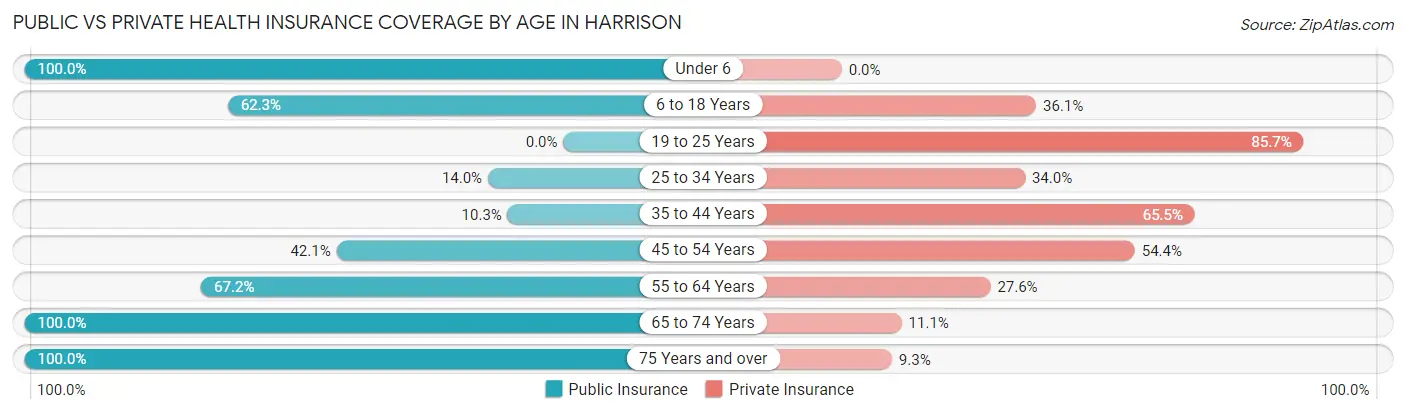
| Age Bracket | Public Insurance | Private Insurance |
| Under 6 | 15 (100.0%) | 0 (0.0%) |
| 6 to 18 Years | 38 (62.3%) | 22 (36.1%) |
| 19 to 25 Years | 0 (0.0%) | 12 (85.7%) |
| 25 to 34 Years | 7 (14.0%) | 17 (34.0%) |
| 35 to 44 Years | 3 (10.3%) | 19 (65.5%) |
| 45 to 54 Years | 24 (42.1%) | 31 (54.4%) |
| 55 to 64 Years | 39 (67.2%) | 16 (27.6%) |
| 65 to 74 Years | 18 (100.0%) | 2 (11.1%) |
| 75 Years and over | 43 (100.0%) | 4 (9.3%) |
| Total | 187 (54.2%) | 123 (35.6%) |
Disability Status by Sex by Age in Harrison
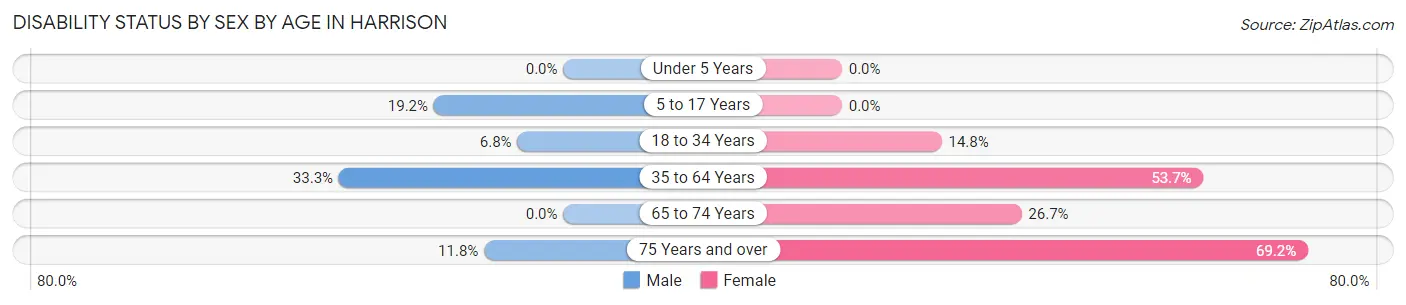
| Age Bracket | Male | Female |
| Under 5 Years | 0 (0.0%) | 0 (0.0%) |
| 5 to 17 Years | 5 (19.2%) | 0 (0.0%) |
| 18 to 34 Years | 3 (6.8%) | 4 (14.8%) |
| 35 to 64 Years | 30 (33.3%) | 29 (53.7%) |
| 65 to 74 Years | 0 (0.0%) | 4 (26.7%) |
| 75 Years and over | 2 (11.8%) | 18 (69.2%) |
Disability Class by Sex by Age in Harrison
Disability Class: Hearing Difficulty
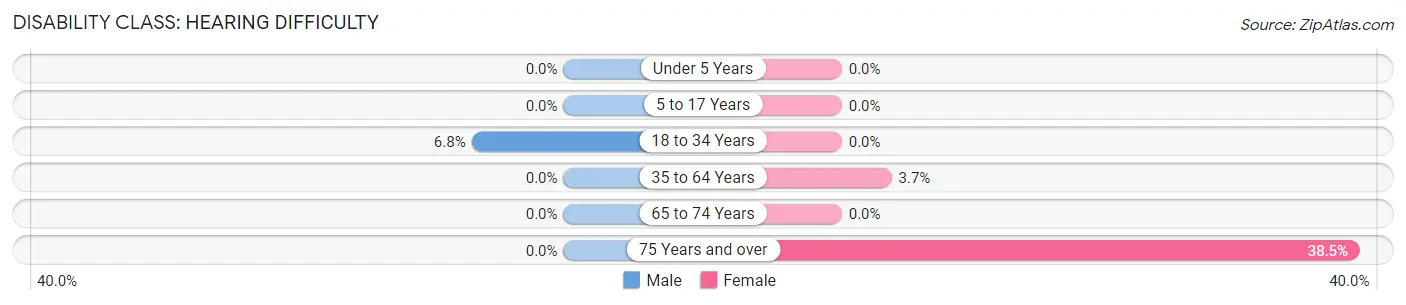
| Age Bracket | Male | Female |
| Under 5 Years | 0 (0.0%) | 0 (0.0%) |
| 5 to 17 Years | 0 (0.0%) | 0 (0.0%) |
| 18 to 34 Years | 3 (6.8%) | 0 (0.0%) |
| 35 to 64 Years | 0 (0.0%) | 2 (3.7%) |
| 65 to 74 Years | 0 (0.0%) | 0 (0.0%) |
| 75 Years and over | 0 (0.0%) | 10 (38.5%) |
Disability Class: Vision Difficulty
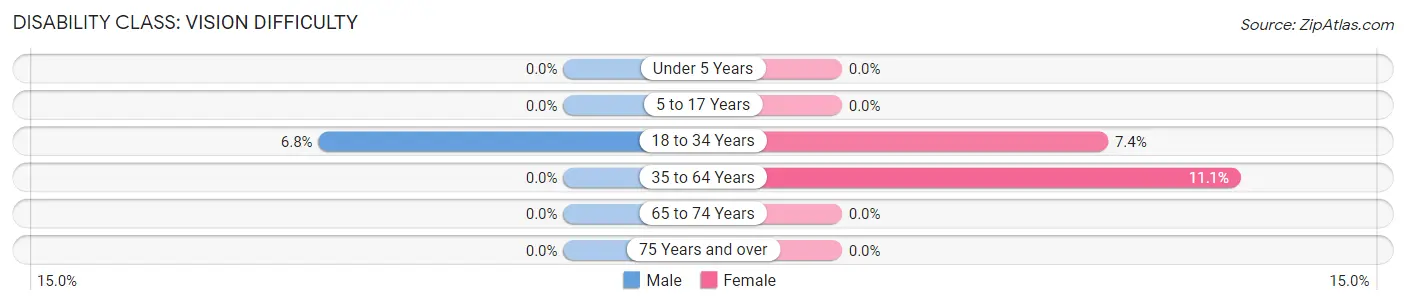
| Age Bracket | Male | Female |
| Under 5 Years | 0 (0.0%) | 0 (0.0%) |
| 5 to 17 Years | 0 (0.0%) | 0 (0.0%) |
| 18 to 34 Years | 3 (6.8%) | 2 (7.4%) |
| 35 to 64 Years | 0 (0.0%) | 6 (11.1%) |
| 65 to 74 Years | 0 (0.0%) | 0 (0.0%) |
| 75 Years and over | 0 (0.0%) | 0 (0.0%) |
Disability Class: Cognitive Difficulty
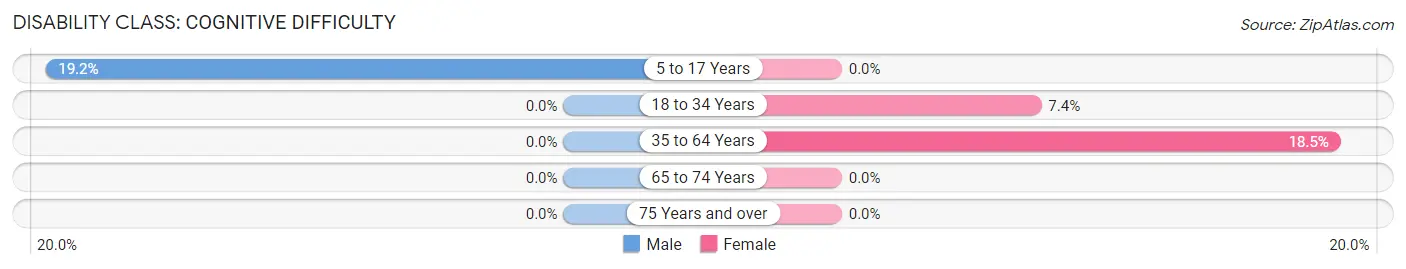
| Age Bracket | Male | Female |
| 5 to 17 Years | 5 (19.2%) | 0 (0.0%) |
| 18 to 34 Years | 0 (0.0%) | 2 (7.4%) |
| 35 to 64 Years | 0 (0.0%) | 10 (18.5%) |
| 65 to 74 Years | 0 (0.0%) | 0 (0.0%) |
| 75 Years and over | 0 (0.0%) | 0 (0.0%) |
Disability Class: Ambulatory Difficulty
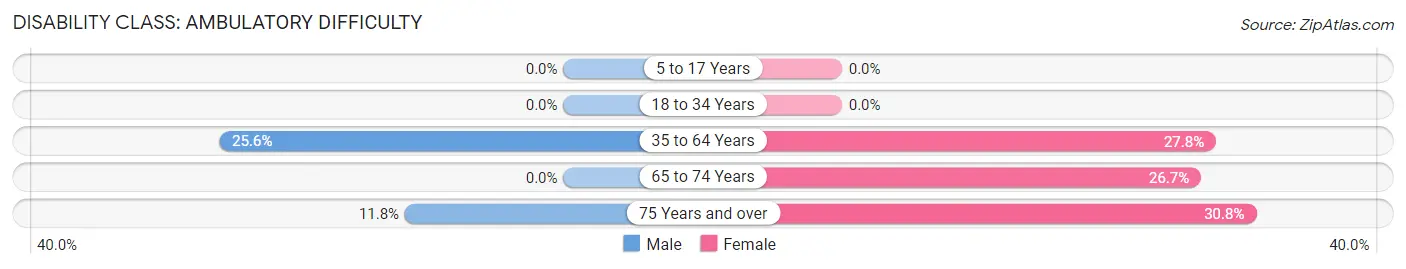
| Age Bracket | Male | Female |
| 5 to 17 Years | 0 (0.0%) | 0 (0.0%) |
| 18 to 34 Years | 0 (0.0%) | 0 (0.0%) |
| 35 to 64 Years | 23 (25.6%) | 15 (27.8%) |
| 65 to 74 Years | 0 (0.0%) | 4 (26.7%) |
| 75 Years and over | 2 (11.8%) | 8 (30.8%) |
Disability Class: Self-Care Difficulty
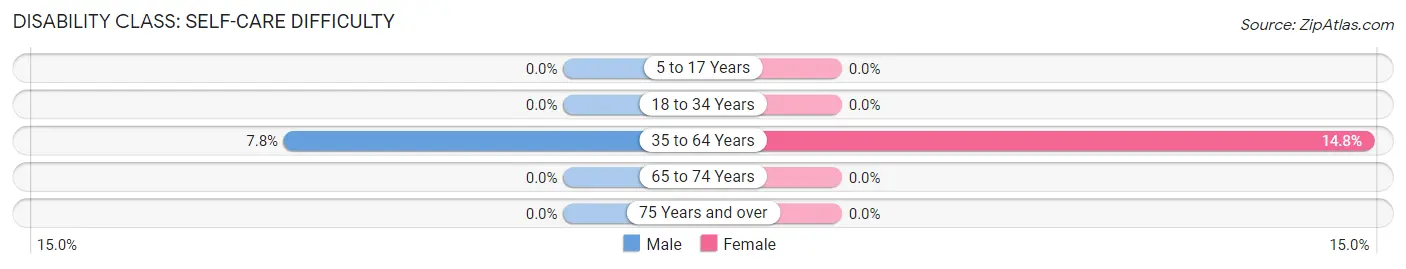
| Age Bracket | Male | Female |
| 5 to 17 Years | 0 (0.0%) | 0 (0.0%) |
| 18 to 34 Years | 0 (0.0%) | 0 (0.0%) |
| 35 to 64 Years | 7 (7.8%) | 8 (14.8%) |
| 65 to 74 Years | 0 (0.0%) | 0 (0.0%) |
| 75 Years and over | 0 (0.0%) | 0 (0.0%) |
Technology Access in Harrison
Computing Device Access in Harrison
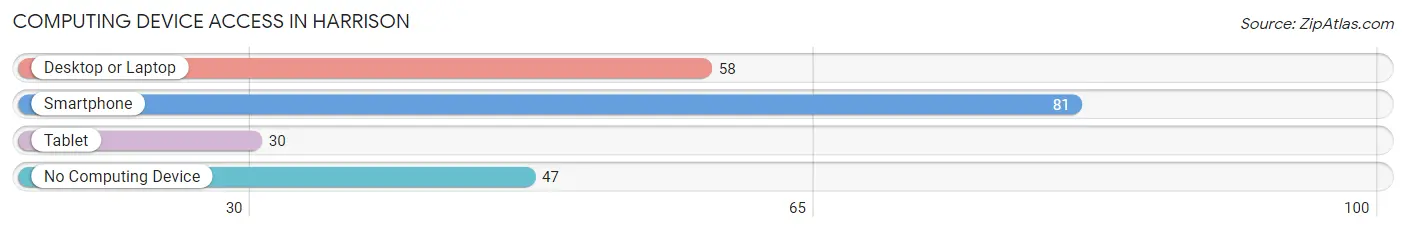
| Device Type | # Households | % Households |
| Desktop or Laptop | 58 | 38.7% |
| Smartphone | 81 | 54.0% |
| Tablet | 30 | 20.0% |
| No Computing Device | 47 | 31.3% |
| Total | 150 | 100.0% |
Internet Access in Harrison
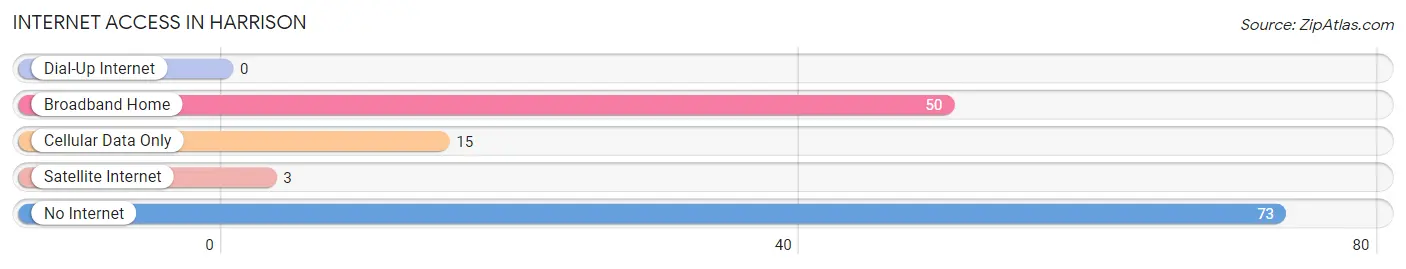
| Internet Type | # Households | % Households |
| Dial-Up Internet | 0 | 0.0% |
| Broadband Home | 50 | 33.3% |
| Cellular Data Only | 15 | 10.0% |
| Satellite Internet | 3 | 2.0% |
| No Internet | 73 | 48.7% |
| Total | 150 | 100.0% |
Harrison Summary
Harrison is a city located in the state of Georgia, United States. It is situated in the northwestern part of the state, in Cherokee County. The city is part of the Atlanta metropolitan area and is located about 30 miles north of the city of Atlanta. As of the 2010 census, the population of Harrison was 13,444.
History
Harrison was founded in 1853 by a group of settlers from the nearby town of Canton. The town was named after General William Henry Harrison, the ninth president of the United States. The town was originally a farming community, but it soon developed into a small industrial center. In the late 19th century, the town was home to several cotton mills and other industries.
In the early 20th century, Harrison experienced a period of growth and development. The town was incorporated in 1908 and the population grew to over 1,000 by the 1920s. During this time, the town was home to several businesses, including a cotton mill, a furniture factory, and a brickyard.
Geography
Harrison is located in northwestern Georgia, in Cherokee County. The city is situated at the intersection of Interstate 75 and State Route 92. The city is located about 30 miles north of the city of Atlanta.
The city has a total area of 8.3 square miles, of which 8.2 square miles is land and 0.1 square miles is water. The city is located in the foothills of the Appalachian Mountains and is surrounded by rolling hills and forests.
Economy
Harrison’s economy is largely based on manufacturing and retail. The city is home to several manufacturing companies, including a furniture factory, a brickyard, and a cotton mill. The city is also home to several retail stores, including a Walmart Supercenter and a Home Depot.
The city is also home to several medical facilities, including Northside Hospital Cherokee and Wellstar Kennestone Hospital. The city is also home to several educational institutions, including Reinhardt University and Chattahoochee Technical College.
Demographics
As of the 2010 census, the population of Harrison was 13,444. The racial makeup of the city was 79.2% White, 14.2% African American, 0.5% Native American, 1.7% Asian, 0.1% Pacific Islander, 1.7% from other races, and 2.7% from two or more races. Hispanic or Latino of any race were 4.3% of the population.
The median income for a household in the city was $50,945, and the median income for a family was $60,945. The per capita income for the city was $25,945. About 8.2% of families and 10.2% of the population were below the poverty line, including 14.2% of those under age 18 and 8.2% of those age 65 or over.
Common Questions
What is Per Capita Income in Harrison?
Per Capita income in Harrison is $15,253.
What is the Median Family Income in Harrison?
Median Family Income in Harrison is $33,250.
What is the Median Household income in Harrison?
Median Household Income in Harrison is $32,569.
What is Income or Wage Gap in Harrison?
Income or Wage Gap in Harrison is 28.8%.
Women in Harrison earn 71.2 cents for every dollar earned by a man.
What is Inequality or Gini Index in Harrison?
Inequality or Gini Index in Harrison is 0.43.
What is the Total Population of Harrison?
Total Population of Harrison is 345.
What is the Total Male Population of Harrison?
Total Male Population of Harrison is 193.
What is the Total Female Population of Harrison?
Total Female Population of Harrison is 152.
What is the Ratio of Males per 100 Females in Harrison?
There are 126.97 Males per 100 Females in Harrison.
What is the Ratio of Females per 100 Males in Harrison?
There are 78.76 Females per 100 Males in Harrison.
What is the Median Population Age in Harrison?
Median Population Age in Harrison is 46.2 Years.
What is the Average Family Size in Harrison
Average Family Size in Harrison is 3.3 People.
What is the Average Household Size in Harrison
Average Household Size in Harrison is 2.3 People.
How Large is the Labor Force in Harrison?
There are 116 People in the Labor Forcein in Harrison.
What is the Percentage of People in the Labor Force in Harrison?
40.8% of People are in the Labor Force in Harrison.
What is the Unemployment Rate in Harrison?
Unemployment Rate in Harrison is 3.4%.