Fort Valley, GA Map & Demographics
Fort Valley Map
Fort Valley Overview
$23,406
PER CAPITA INCOME
$49,643
AVG FAMILY INCOME
$31,807
AVG HOUSEHOLD INCOME
50.5%
WAGE / INCOME GAP [ % ]
49.5¢/ $1
WAGE / INCOME GAP [ $ ]
$12,600
FAMILY INCOME DEFICIT
0.53
INEQUALITY / GINI INDEX
8,821
TOTAL POPULATION
4,331
MALE POPULATION
4,490
FEMALE POPULATION
96.46
MALES / 100 FEMALES
103.67
FEMALES / 100 MALES
30.6
MEDIAN AGE
3.1
AVG FAMILY SIZE
2.4
AVG HOUSEHOLD SIZE
3,603
LABOR FORCE [ PEOPLE ]
48.8%
PERCENT IN LABOR FORCE
9.4%
UNEMPLOYMENT RATE
Fort Valley Zip Codes
Fort Valley Area Codes
Income in Fort Valley
Income Overview in Fort Valley
Per Capita Income in Fort Valley is $23,406, while median incomes of families and households are $49,643 and $31,807 respectively.
| Characteristic | Number | Measure |
| Per Capita Income | 8,821 | $23,406 |
| Median Family Income | 1,878 | $49,643 |
| Mean Family Income | 1,878 | $66,954 |
| Median Household Income | 3,118 | $31,807 |
| Mean Household Income | 3,118 | $55,305 |
| Income Deficit | 1,878 | $12,600 |
| Wage / Income Gap (%) | 8,821 | 50.48% |
| Wage / Income Gap ($) | 8,821 | 49.52¢ per $1 |
| Gini / Inequality Index | 8,821 | 0.53 |
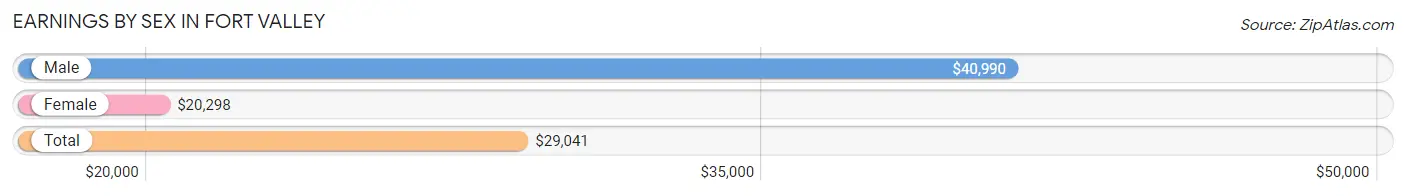
Earnings by Sex in Fort Valley
Average Earnings in Fort Valley are $29,041, $40,990 for men and $20,298 for women, a difference of 50.5%.
| Sex | Number | Average Earnings |
| Male | 1,939 (52.0%) | $40,990 |
| Female | 1,792 (48.0%) | $20,298 |
| Total | 3,731 (100.0%) | $29,041 |
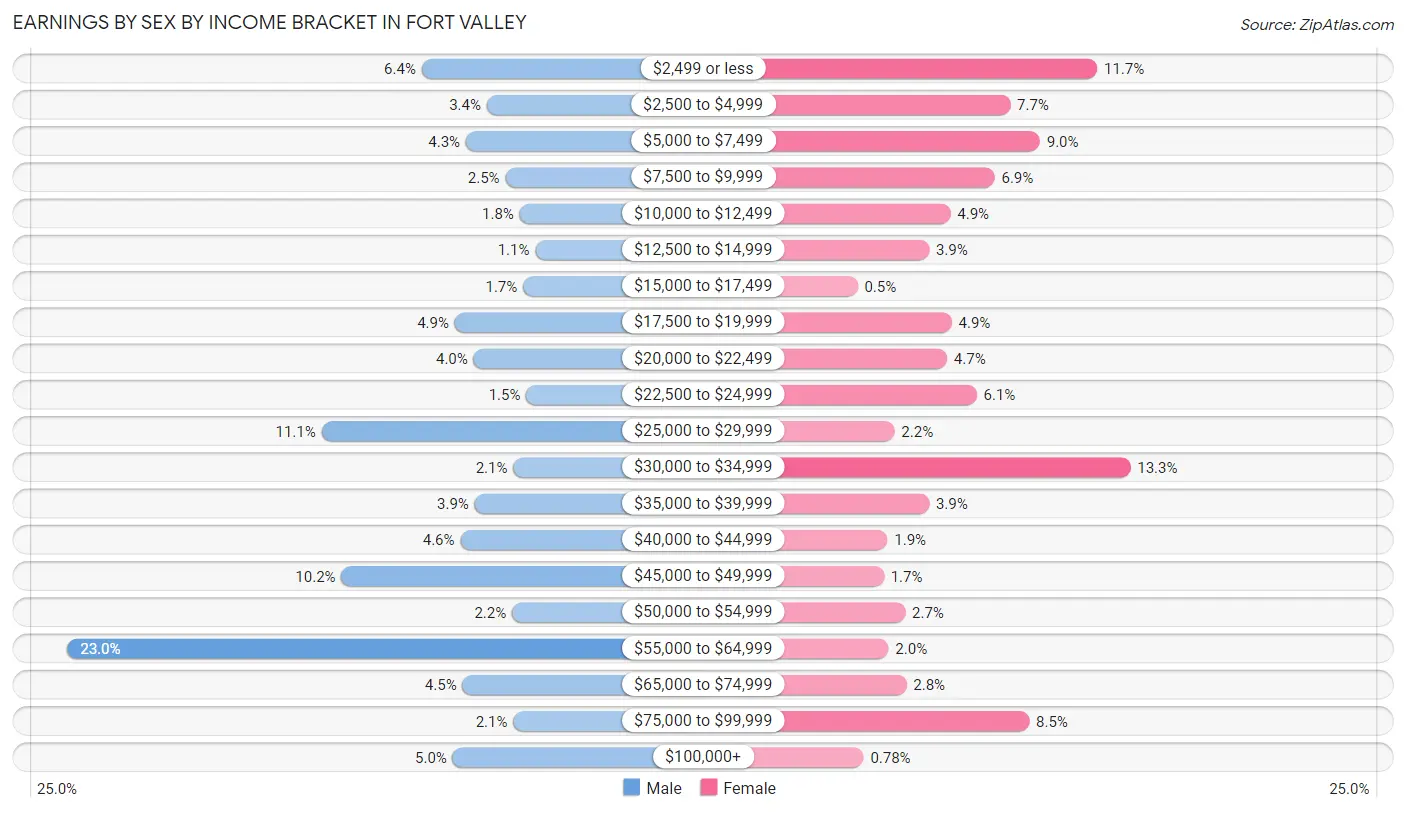
Earnings by Sex by Income Bracket in Fort Valley
The most common earnings brackets in Fort Valley are $55,000 to $64,999 for men (446 | 23.0%) and $30,000 to $34,999 for women (238 | 13.3%).
| Income | Male | Female |
| $2,499 or less | 124 (6.4%) | 210 (11.7%) |
| $2,500 to $4,999 | 65 (3.4%) | 137 (7.6%) |
| $5,000 to $7,499 | 84 (4.3%) | 162 (9.0%) |
| $7,500 to $9,999 | 48 (2.5%) | 124 (6.9%) |
| $10,000 to $12,499 | 35 (1.8%) | 87 (4.9%) |
| $12,500 to $14,999 | 21 (1.1%) | 69 (3.8%) |
| $15,000 to $17,499 | 32 (1.7%) | 9 (0.5%) |
| $17,500 to $19,999 | 94 (4.9%) | 88 (4.9%) |
| $20,000 to $22,499 | 77 (4.0%) | 84 (4.7%) |
| $22,500 to $24,999 | 29 (1.5%) | 109 (6.1%) |
| $25,000 to $29,999 | 215 (11.1%) | 40 (2.2%) |
| $30,000 to $34,999 | 41 (2.1%) | 238 (13.3%) |
| $35,000 to $39,999 | 76 (3.9%) | 69 (3.8%) |
| $40,000 to $44,999 | 89 (4.6%) | 34 (1.9%) |
| $45,000 to $49,999 | 197 (10.2%) | 31 (1.7%) |
| $50,000 to $54,999 | 42 (2.2%) | 49 (2.7%) |
| $55,000 to $64,999 | 446 (23.0%) | 35 (1.9%) |
| $65,000 to $74,999 | 87 (4.5%) | 50 (2.8%) |
| $75,000 to $99,999 | 41 (2.1%) | 153 (8.5%) |
| $100,000+ | 96 (5.0%) | 14 (0.8%) |
| Total | 1,939 (100.0%) | 1,792 (100.0%) |
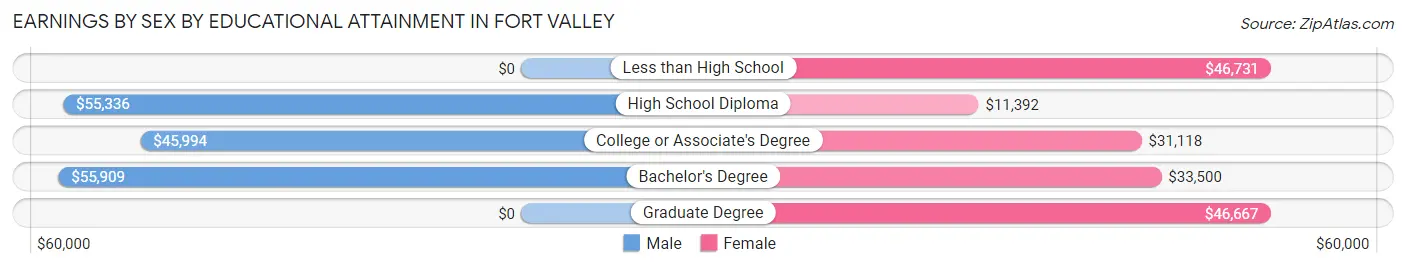
Earnings by Sex by Educational Attainment in Fort Valley
Average earnings in Fort Valley are $48,517 for men and $30,759 for women, a difference of 36.6%. Men with an educational attainment of bachelor's degree enjoy the highest average annual earnings of $55,909, while those with college or associate's degree education earn the least with $45,994. Women with an educational attainment of less than high school earn the most with the average annual earnings of $46,731, while those with high school diploma education have the smallest earnings of $11,392.
| Educational Attainment | Male Income | Female Income |
| Less than High School | - | - |
| High School Diploma | $55,336 | $11,392 |
| College or Associate's Degree | $45,994 | $31,118 |
| Bachelor's Degree | $55,909 | $33,500 |
| Graduate Degree | - | - |
| Total | $48,517 | $30,759 |
Family Income in Fort Valley
Family Income Brackets in Fort Valley
According to the Fort Valley family income data, there are 411 families falling into the less than $10,000 income range, which is the most common income bracket and makes up 21.9% of all families. Conversely, the $150,000 to $199,999 income bracket is the least frequent group with only 54 families (2.9%) belonging to this category.
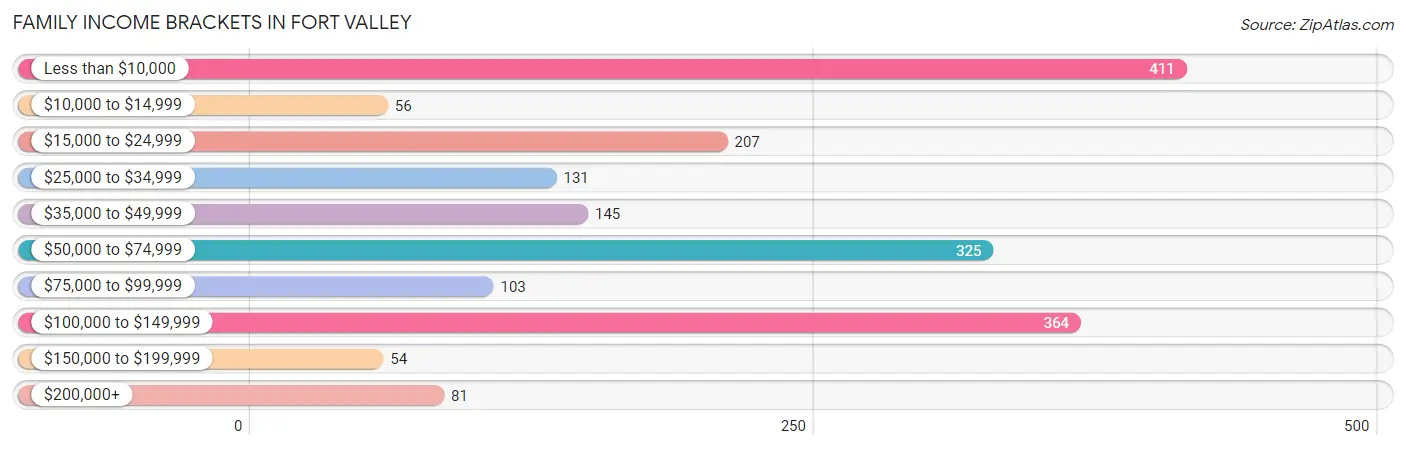
| Income Bracket | # Families | % Families |
| Less than $10,000 | 411 | 21.9% |
| $10,000 to $14,999 | 56 | 3.0% |
| $15,000 to $24,999 | 207 | 11.0% |
| $25,000 to $34,999 | 131 | 7.0% |
| $35,000 to $49,999 | 145 | 7.7% |
| $50,000 to $74,999 | 325 | 17.3% |
| $75,000 to $99,999 | 103 | 5.5% |
| $100,000 to $149,999 | 364 | 19.4% |
| $150,000 to $199,999 | 54 | 2.9% |
| $200,000+ | 81 | 4.3% |
Family Income by Famaliy Size in Fort Valley
4-person families (265 | 14.1%) account for the highest median family income in Fort Valley with $49,572 per family, while 2-person families (880 | 46.9%) have the highest median income of $24,782 per family member.
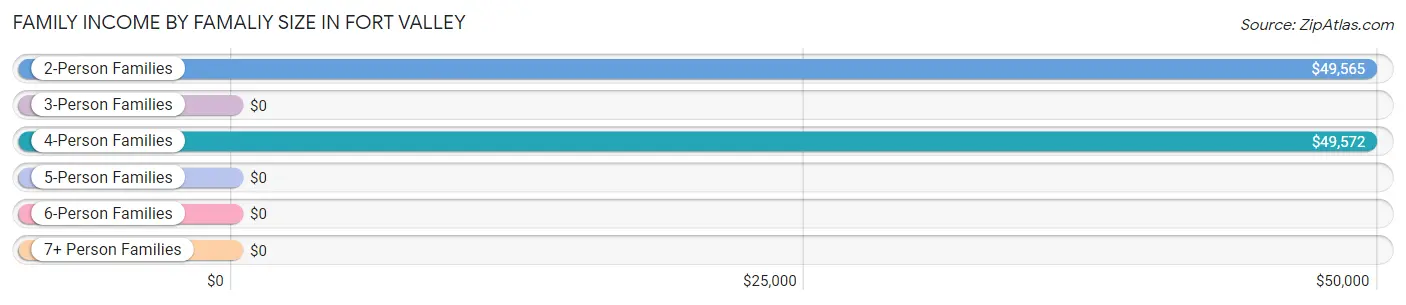
| Income Bracket | # Families | Median Income |
| 2-Person Families | 880 (46.9%) | $49,565 |
| 3-Person Families | 524 (27.9%) | $0 |
| 4-Person Families | 265 (14.1%) | $49,572 |
| 5-Person Families | 158 (8.4%) | $0 |
| 6-Person Families | 27 (1.4%) | $0 |
| 7+ Person Families | 24 (1.3%) | $0 |
| Total | 1,878 (100.0%) | $49,643 |
Family Income by Number of Earners in Fort Valley
The median family income in Fort Valley is $49,643, with families comprising 3+ earners (110) having the highest median family income of $142,188, while families with no earners (514) have the lowest median family income of $8,902, accounting for 5.9% and 27.4% of families, respectively.
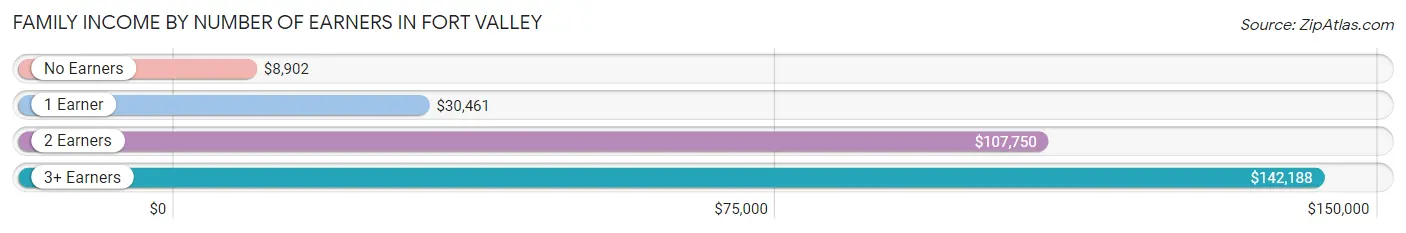
| Number of Earners | # Families | Median Income |
| No Earners | 514 (27.4%) | $8,902 |
| 1 Earner | 585 (31.1%) | $30,461 |
| 2 Earners | 669 (35.6%) | $107,750 |
| 3+ Earners | 110 (5.9%) | $142,188 |
| Total | 1,878 (100.0%) | $49,643 |
Household Income in Fort Valley
Household Income Brackets in Fort Valley
With 589 households falling in the category, the less than $10,000 income range is the most frequent in Fort Valley, accounting for 18.9% of all households. In contrast, only 81 households (2.6%) fall into the $200,000+ income bracket, making it the least populous group.
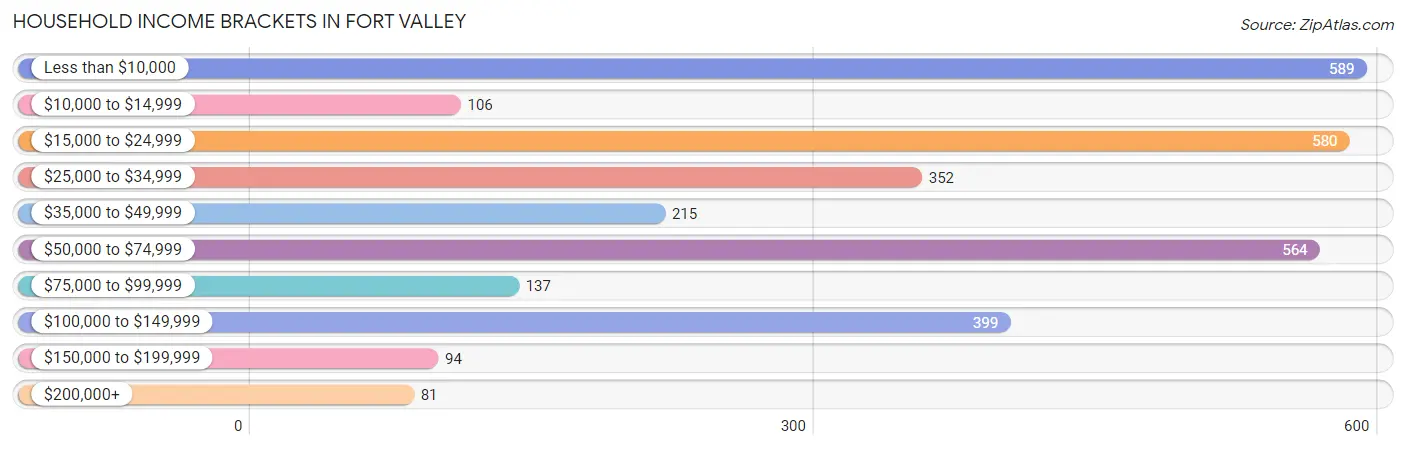
| Income Bracket | # Households | % Households |
| Less than $10,000 | 589 | 18.9% |
| $10,000 to $14,999 | 106 | 3.4% |
| $15,000 to $24,999 | 580 | 18.6% |
| $25,000 to $34,999 | 352 | 11.3% |
| $35,000 to $49,999 | 215 | 6.9% |
| $50,000 to $74,999 | 564 | 18.1% |
| $75,000 to $99,999 | 137 | 4.4% |
| $100,000 to $149,999 | 399 | 12.8% |
| $150,000 to $199,999 | 94 | 3.0% |
| $200,000+ | 81 | 2.6% |
Household Income by Householder Age in Fort Valley
The median household income in Fort Valley is $31,807, with the highest median household income of $49,776 found in the 25 to 44 years age bracket for the primary householder. A total of 1,139 households (36.5%) fall into this category. Meanwhile, the 15 to 24 years age bracket for the primary householder has the lowest median household income of $0, with 61 households (2.0%) in this group.
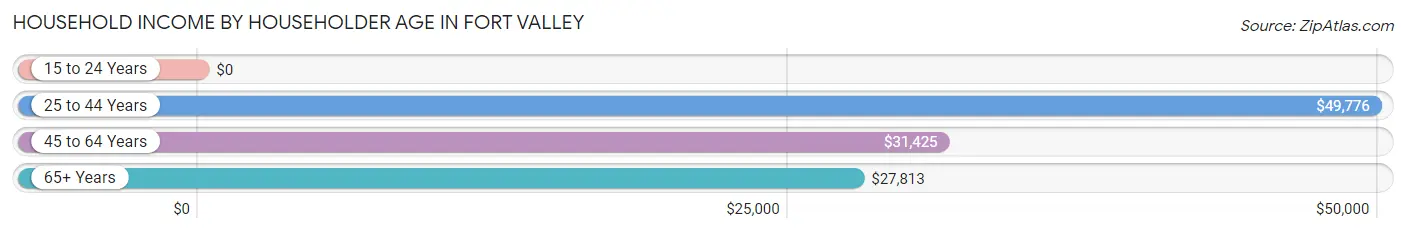
| Income Bracket | # Households | Median Income |
| 15 to 24 Years | 61 (2.0%) | $0 |
| 25 to 44 Years | 1,139 (36.5%) | $49,776 |
| 45 to 64 Years | 936 (30.0%) | $31,425 |
| 65+ Years | 982 (31.5%) | $27,813 |
| Total | 3,118 (100.0%) | $31,807 |
Poverty in Fort Valley
Income Below Poverty by Sex and Age in Fort Valley
With 29.8% poverty level for males and 41.8% for females among the residents of Fort Valley, 15 year old males and 6 to 11 year old females are the most vulnerable to poverty, with 22 males (100.0%) and 225 females (96.2%) in their respective age groups living below the poverty level.
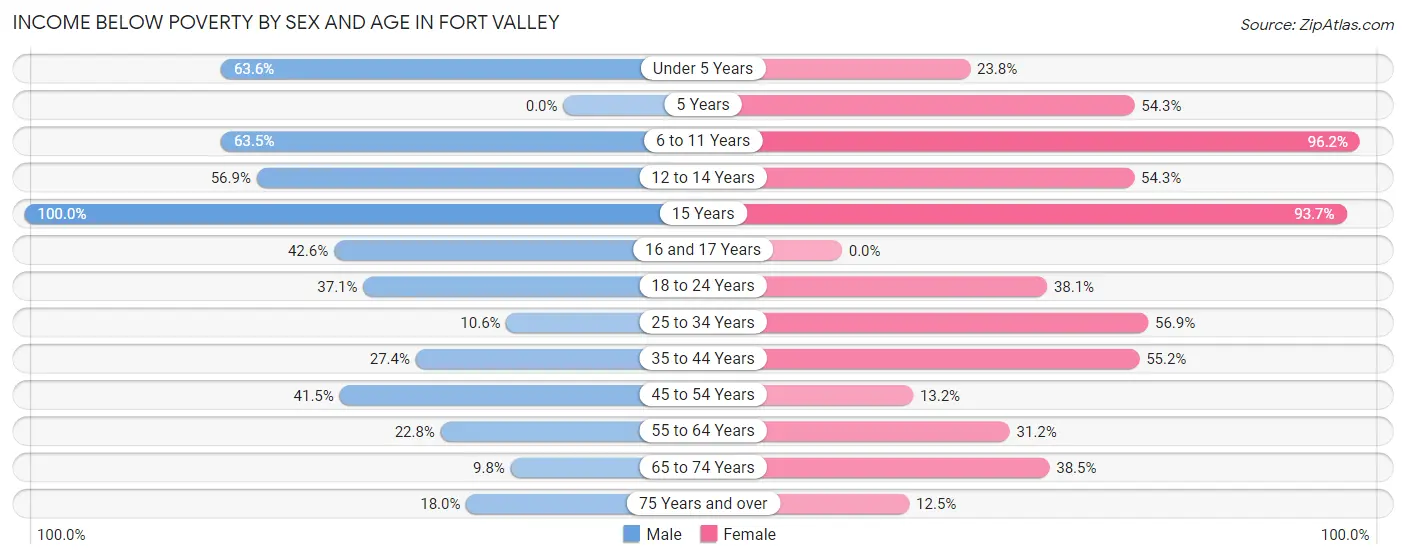
| Age Bracket | Male | Female |
| Under 5 Years | 190 (63.5%) | 55 (23.8%) |
| 5 Years | 0 (0.0%) | 38 (54.3%) |
| 6 to 11 Years | 115 (63.5%) | 225 (96.2%) |
| 12 to 14 Years | 70 (56.9%) | 83 (54.2%) |
| 15 Years | 22 (100.0%) | 59 (93.6%) |
| 16 and 17 Years | 43 (42.6%) | 0 (0.0%) |
| 18 to 24 Years | 193 (37.1%) | 131 (38.1%) |
| 25 to 34 Years | 63 (10.6%) | 278 (56.9%) |
| 35 to 44 Years | 149 (27.4%) | 244 (55.2%) |
| 45 to 54 Years | 103 (41.5%) | 44 (13.2%) |
| 55 to 64 Years | 92 (22.8%) | 181 (31.1%) |
| 65 to 74 Years | 49 (9.8%) | 119 (38.5%) |
| 75 Years and over | 29 (18.0%) | 36 (12.5%) |
| Total | 1,118 (29.8%) | 1,493 (41.8%) |
Income Above Poverty by Sex and Age in Fort Valley
According to the poverty statistics in Fort Valley, males aged 5 years and females aged 16 and 17 years are the age groups that are most secure financially, with 100.0% of males and 100.0% of females in these age groups living above the poverty line.
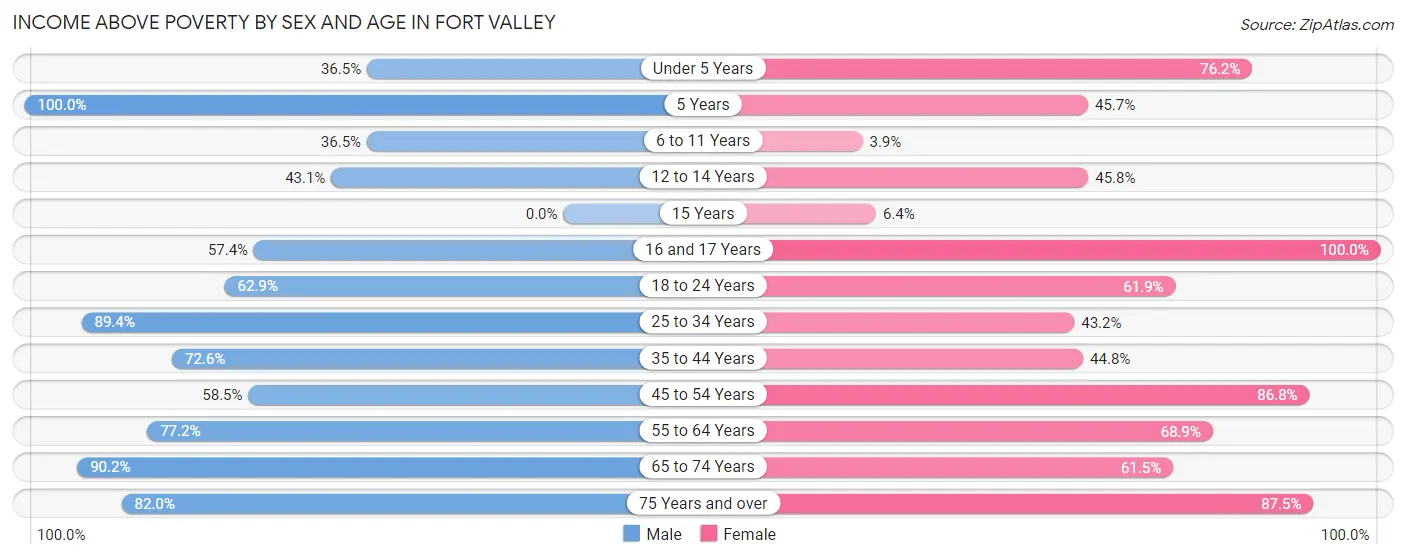
| Age Bracket | Male | Female |
| Under 5 Years | 109 (36.4%) | 176 (76.2%) |
| 5 Years | 54 (100.0%) | 32 (45.7%) |
| 6 to 11 Years | 66 (36.5%) | 9 (3.8%) |
| 12 to 14 Years | 53 (43.1%) | 70 (45.8%) |
| 15 Years | 0 (0.0%) | 4 (6.4%) |
| 16 and 17 Years | 58 (57.4%) | 32 (100.0%) |
| 18 to 24 Years | 327 (62.9%) | 213 (61.9%) |
| 25 to 34 Years | 533 (89.4%) | 211 (43.1%) |
| 35 to 44 Years | 395 (72.6%) | 198 (44.8%) |
| 45 to 54 Years | 145 (58.5%) | 289 (86.8%) |
| 55 to 64 Years | 312 (77.2%) | 400 (68.9%) |
| 65 to 74 Years | 452 (90.2%) | 190 (61.5%) |
| 75 Years and over | 132 (82.0%) | 252 (87.5%) |
| Total | 2,636 (70.2%) | 2,076 (58.2%) |
Income Below Poverty Among Married-Couple Families in Fort Valley
The poverty statistics for married-couple families in Fort Valley show that 4.5% or 34 of the total 759 families live below the poverty line. Families with no children have the highest poverty rate of 4.6%, comprising of 21 families. On the other hand, families with 3 or 4 children have the lowest poverty rate of 0.0%, which includes 0 families.
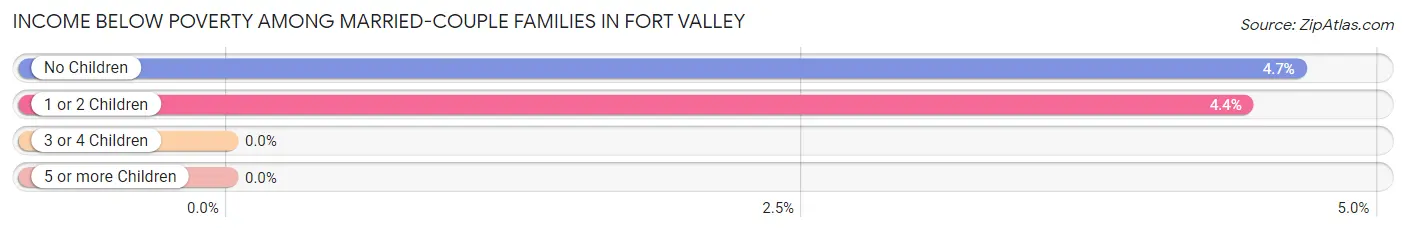
| Children | Above Poverty | Below Poverty |
| No Children | 431 (95.4%) | 21 (4.6%) |
| 1 or 2 Children | 281 (95.6%) | 13 (4.4%) |
| 3 or 4 Children | 13 (100.0%) | 0 (0.0%) |
| 5 or more Children | 0 (0.0%) | 0 (0.0%) |
| Total | 725 (95.5%) | 34 (4.5%) |
Income Below Poverty Among Single-Parent Households in Fort Valley
According to the poverty data in Fort Valley, 49.3% or 171 single-father households and 60.4% or 466 single-mother households are living below the poverty line. Among single-father households, those with no children have the highest poverty rate, with 171 households (65.5%) experiencing poverty. Likewise, among single-mother households, those with 3 or 4 children have the highest poverty rate, with 133 households (100.0%) falling below the poverty line.
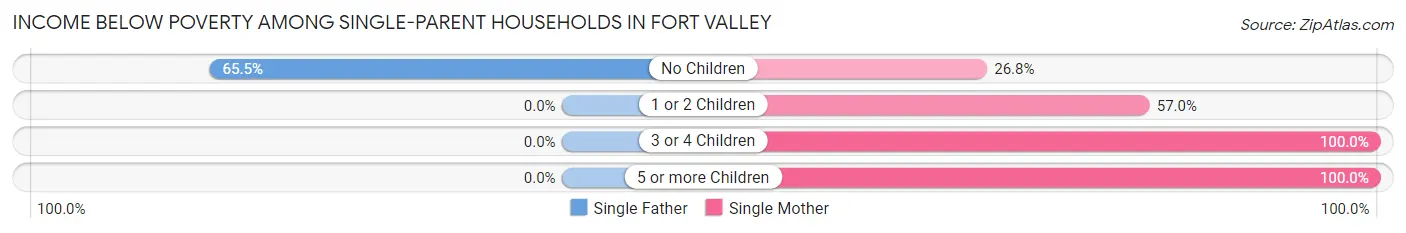
| Children | Single Father | Single Mother |
| No Children | 171 (65.5%) | 38 (26.8%) |
| 1 or 2 Children | 0 (0.0%) | 268 (57.0%) |
| 3 or 4 Children | 0 (0.0%) | 133 (100.0%) |
| 5 or more Children | 0 (0.0%) | 27 (100.0%) |
| Total | 171 (49.3%) | 466 (60.4%) |
Income Below Poverty Among Married-Couple vs Single-Parent Households in Fort Valley
The poverty data for Fort Valley shows that 34 of the married-couple family households (4.5%) and 637 of the single-parent households (56.9%) are living below the poverty level. Within the married-couple family households, those with no children have the highest poverty rate, with 21 households (4.6%) falling below the poverty line. Among the single-parent households, those with 3 or 4 children have the highest poverty rate, with 133 household (100.0%) living below poverty.
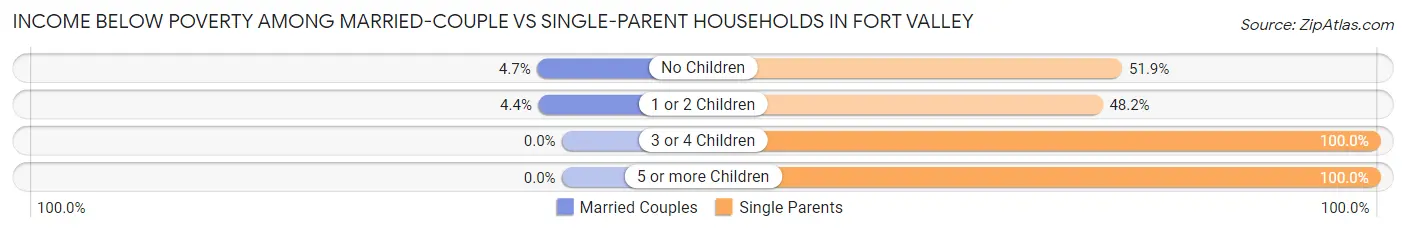
| Children | Married-Couple Families | Single-Parent Households |
| No Children | 21 (4.6%) | 209 (51.9%) |
| 1 or 2 Children | 13 (4.4%) | 268 (48.2%) |
| 3 or 4 Children | 0 (0.0%) | 133 (100.0%) |
| 5 or more Children | 0 (0.0%) | 27 (100.0%) |
| Total | 34 (4.5%) | 637 (56.9%) |
Race in Fort Valley
The most populous races in Fort Valley are Black / African American (6,191 | 70.2%), White / Caucasian (2,062 | 23.4%), and Hispanic or Latino (727 | 8.2%).
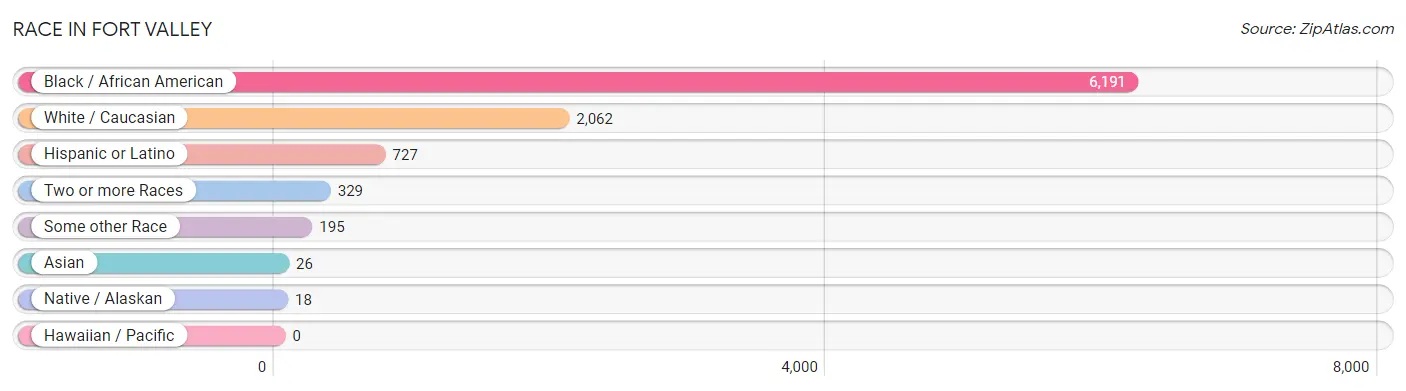
| Race | # Population | % Population |
| Asian | 26 | 0.3% |
| Black / African American | 6,191 | 70.2% |
| Hawaiian / Pacific | 0 | 0.0% |
| Hispanic or Latino | 727 | 8.2% |
| Native / Alaskan | 18 | 0.2% |
| White / Caucasian | 2,062 | 23.4% |
| Two or more Races | 329 | 3.7% |
| Some other Race | 195 | 2.2% |
| Total | 8,821 | 100.0% |
Ancestry in Fort Valley
The most populous ancestries reported in Fort Valley are American (1,011 | 11.5%), Mexican (661 | 7.5%), Subsaharan African (179 | 2.0%), Irish (172 | 1.9%), and English (132 | 1.5%), together accounting for 24.4% of all Fort Valley residents.
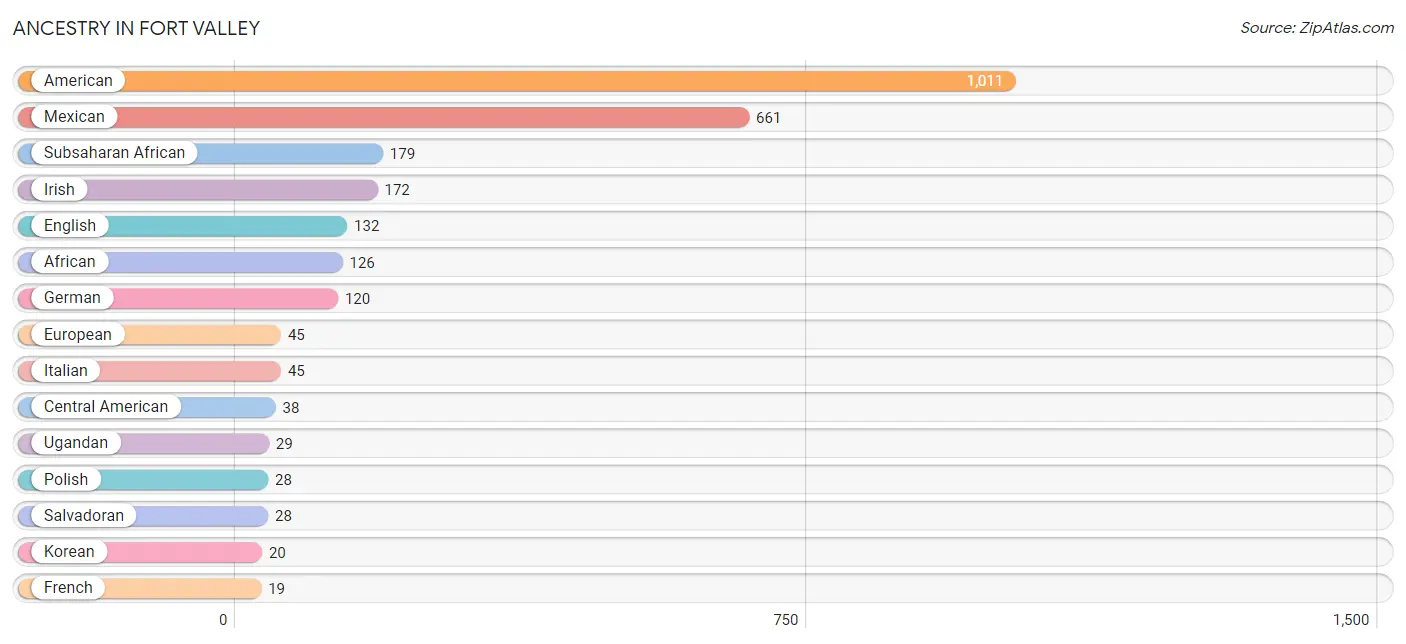
| Ancestry | # Population | % Population |
| African | 126 | 1.4% |
| American | 1,011 | 11.5% |
| Austrian | 1 | 0.0% |
| British | 12 | 0.1% |
| British West Indian | 8 | 0.1% |
| Central American | 38 | 0.4% |
| Colombian | 7 | 0.1% |
| Dominican | 6 | 0.1% |
| Dutch | 5 | 0.1% |
| English | 132 | 1.5% |
| European | 45 | 0.5% |
| French | 19 | 0.2% |
| German | 120 | 1.4% |
| Guatemalan | 2 | 0.0% |
| Guyanese | 5 | 0.1% |
| Indian (Asian) | 14 | 0.2% |
| Irish | 172 | 1.9% |
| Italian | 45 | 0.5% |
| Jamaican | 2 | 0.0% |
| Korean | 20 | 0.2% |
| Mexican | 661 | 7.5% |
| Nigerian | 12 | 0.1% |
| Norwegian | 15 | 0.2% |
| Panamanian | 8 | 0.1% |
| Peruvian | 6 | 0.1% |
| Polish | 28 | 0.3% |
| Portuguese | 5 | 0.1% |
| Salvadoran | 28 | 0.3% |
| Scotch-Irish | 14 | 0.2% |
| Scottish | 14 | 0.2% |
| Senegalese | 7 | 0.1% |
| South American | 13 | 0.2% |
| Subsaharan African | 179 | 2.0% |
| Swedish | 14 | 0.2% |
| Thai | 6 | 0.1% |
| Ugandan | 29 | 0.3% | View All 36 Rows |
Immigrants in Fort Valley
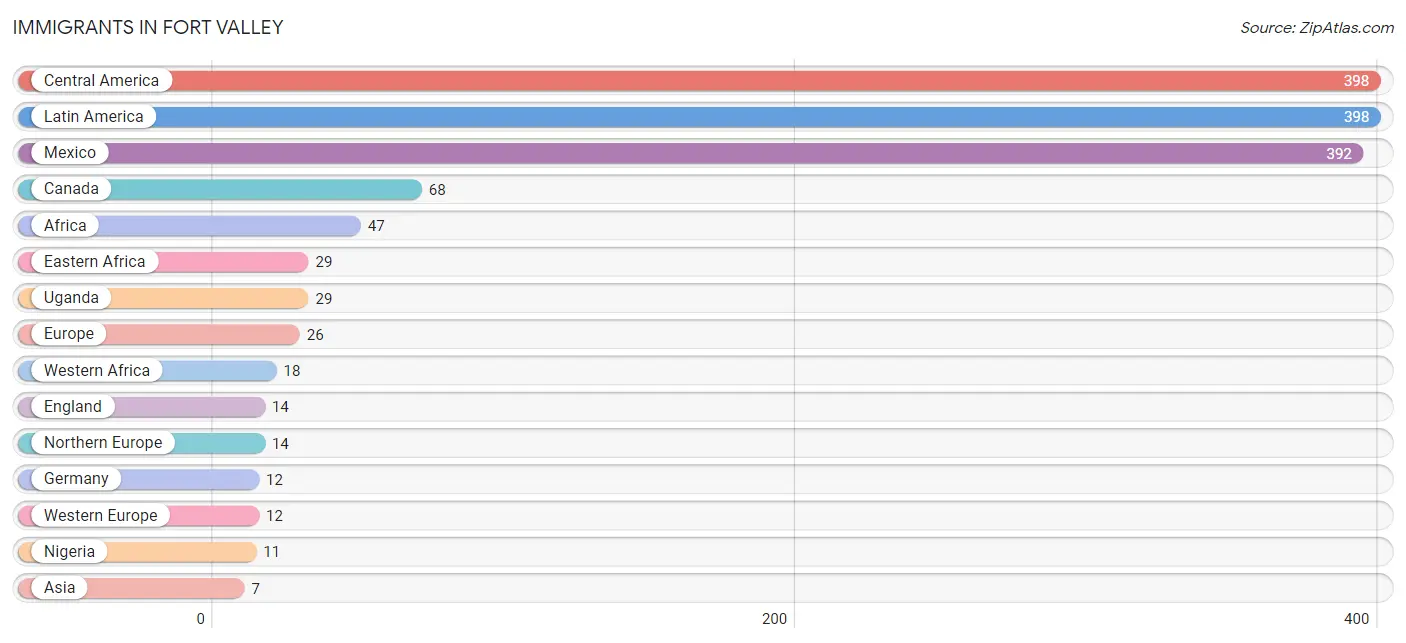
The most numerous immigrant groups reported in Fort Valley came from Central America (398 | 4.5%), Latin America (398 | 4.5%), Mexico (392 | 4.4%), Canada (68 | 0.8%), and Africa (47 | 0.5%), together accounting for 14.8% of all Fort Valley residents.
| Immigration Origin | # Population | % Population |
| Africa | 47 | 0.5% |
| Asia | 7 | 0.1% |
| Canada | 68 | 0.8% |
| Central America | 398 | 4.5% |
| China | 7 | 0.1% |
| Eastern Africa | 29 | 0.3% |
| Eastern Asia | 7 | 0.1% |
| El Salvador | 4 | 0.1% |
| England | 14 | 0.2% |
| Europe | 26 | 0.3% |
| Germany | 12 | 0.1% |
| Guatemala | 2 | 0.0% |
| Latin America | 398 | 4.5% |
| Mexico | 392 | 4.4% |
| Nigeria | 11 | 0.1% |
| Northern Europe | 14 | 0.2% |
| Senegal | 7 | 0.1% |
| Uganda | 29 | 0.3% |
| Western Africa | 18 | 0.2% |
| Western Europe | 12 | 0.1% | View All 20 Rows |
Sex and Age in Fort Valley
Sex and Age in Fort Valley
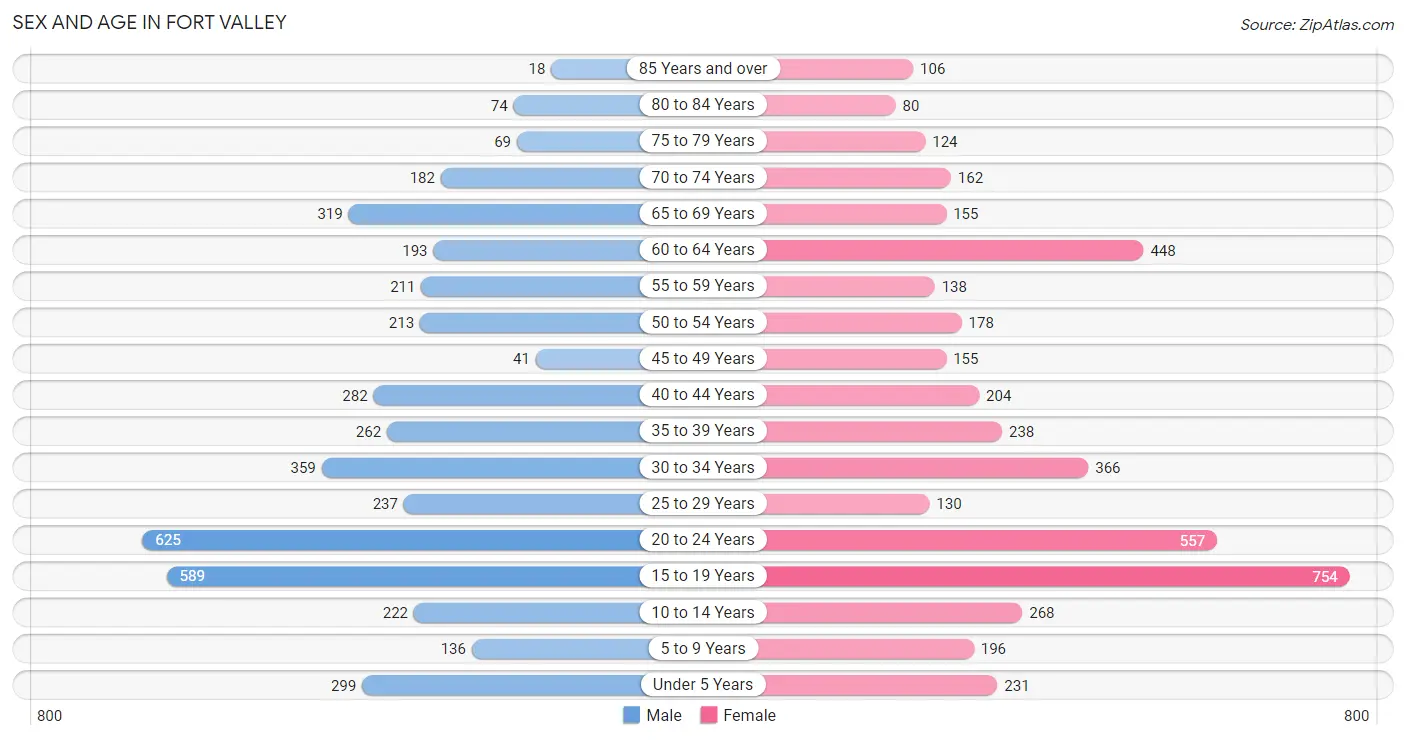
The most populous age groups in Fort Valley are 20 to 24 Years (625 | 14.4%) for men and 15 to 19 Years (754 | 16.8%) for women.
| Age Bracket | Male | Female |
| Under 5 Years | 299 (6.9%) | 231 (5.1%) |
| 5 to 9 Years | 136 (3.1%) | 196 (4.4%) |
| 10 to 14 Years | 222 (5.1%) | 268 (6.0%) |
| 15 to 19 Years | 589 (13.6%) | 754 (16.8%) |
| 20 to 24 Years | 625 (14.4%) | 557 (12.4%) |
| 25 to 29 Years | 237 (5.5%) | 130 (2.9%) |
| 30 to 34 Years | 359 (8.3%) | 366 (8.2%) |
| 35 to 39 Years | 262 (6.0%) | 238 (5.3%) |
| 40 to 44 Years | 282 (6.5%) | 204 (4.5%) |
| 45 to 49 Years | 41 (0.9%) | 155 (3.5%) |
| 50 to 54 Years | 213 (4.9%) | 178 (4.0%) |
| 55 to 59 Years | 211 (4.9%) | 138 (3.1%) |
| 60 to 64 Years | 193 (4.5%) | 448 (10.0%) |
| 65 to 69 Years | 319 (7.4%) | 155 (3.5%) |
| 70 to 74 Years | 182 (4.2%) | 162 (3.6%) |
| 75 to 79 Years | 69 (1.6%) | 124 (2.8%) |
| 80 to 84 Years | 74 (1.7%) | 80 (1.8%) |
| 85 Years and over | 18 (0.4%) | 106 (2.4%) |
| Total | 4,331 (100.0%) | 4,490 (100.0%) |
Families and Households in Fort Valley
Median Family Size in Fort Valley
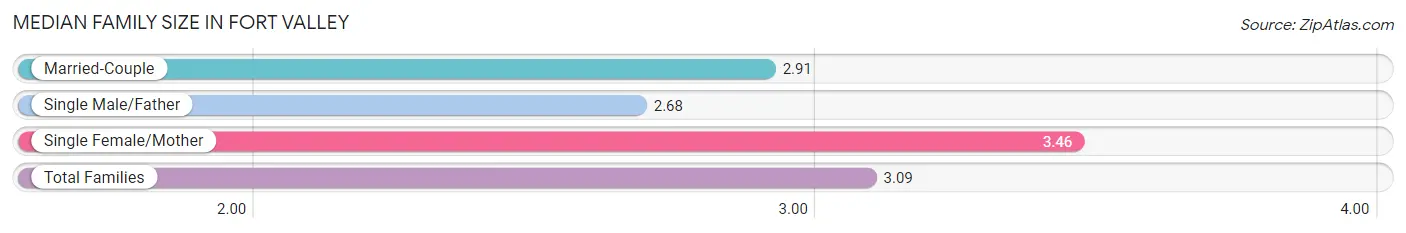
The median family size in Fort Valley is 3.09 persons per family, with single female/mother families (772 | 41.1%) accounting for the largest median family size of 3.46 persons per family. On the other hand, single male/father families (347 | 18.5%) represent the smallest median family size with 2.68 persons per family.
| Family Type | # Families | Family Size |
| Married-Couple | 759 (40.4%) | 2.91 |
| Single Male/Father | 347 (18.5%) | 2.68 |
| Single Female/Mother | 772 (41.1%) | 3.46 |
| Total Families | 1,878 (100.0%) | 3.09 |
Median Household Size in Fort Valley
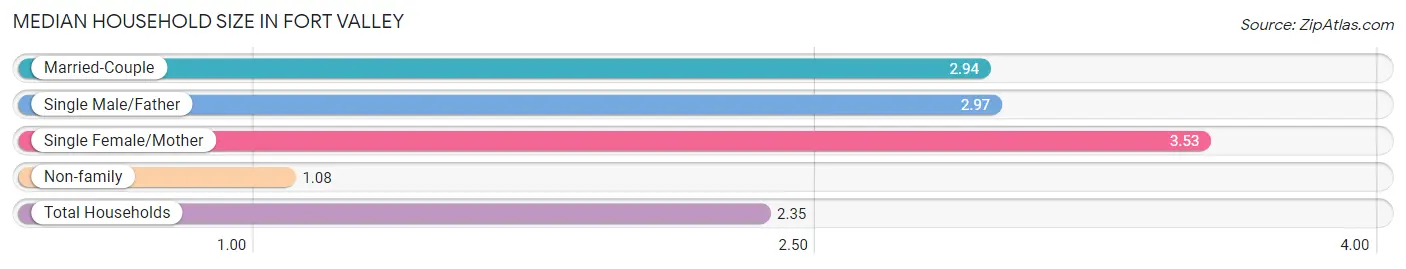
The median household size in Fort Valley is 2.35 persons per household, with single female/mother households (772 | 24.8%) accounting for the largest median household size of 3.53 persons per household. non-family households (1,240 | 39.8%) represent the smallest median household size with 1.08 persons per household.
| Household Type | # Households | Household Size |
| Married-Couple | 759 (24.3%) | 2.94 |
| Single Male/Father | 347 (11.1%) | 2.97 |
| Single Female/Mother | 772 (24.8%) | 3.53 |
| Non-family | 1,240 (39.8%) | 1.08 |
| Total Households | 3,118 (100.0%) | 2.35 |
Household Size by Marriage Status in Fort Valley
Out of a total of 3,118 households in Fort Valley, 1,878 (60.2%) are family households, while 1,240 (39.8%) are nonfamily households. The most numerous type of family households are 2-person households, comprising 778, and the most common type of nonfamily households are 1-person households, comprising 1,192.
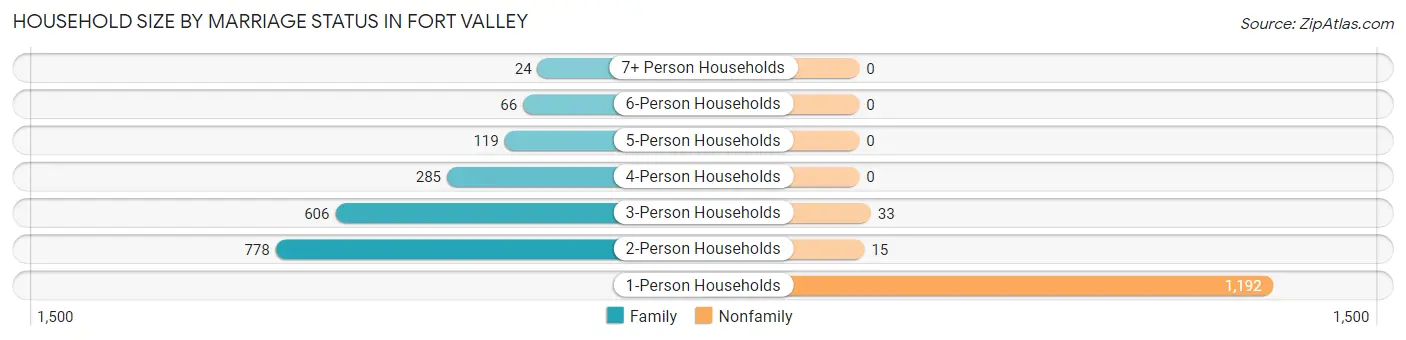
| Household Size | Family Households | Nonfamily Households |
| 1-Person Households | - | 1,192 (38.2%) |
| 2-Person Households | 778 (24.9%) | 15 (0.5%) |
| 3-Person Households | 606 (19.4%) | 33 (1.1%) |
| 4-Person Households | 285 (9.1%) | 0 (0.0%) |
| 5-Person Households | 119 (3.8%) | 0 (0.0%) |
| 6-Person Households | 66 (2.1%) | 0 (0.0%) |
| 7+ Person Households | 24 (0.8%) | 0 (0.0%) |
| Total | 1,878 (60.2%) | 1,240 (39.8%) |
Female Fertility in Fort Valley
Fertility by Age in Fort Valley
Average fertility rate in Fort Valley is 46.0 births per 1,000 women. Women in the age bracket of 20 to 34 years have the highest fertility rate with 72.0 births per 1,000 women. Women in the age bracket of 20 to 34 years acount for 67.9% of all women with births.
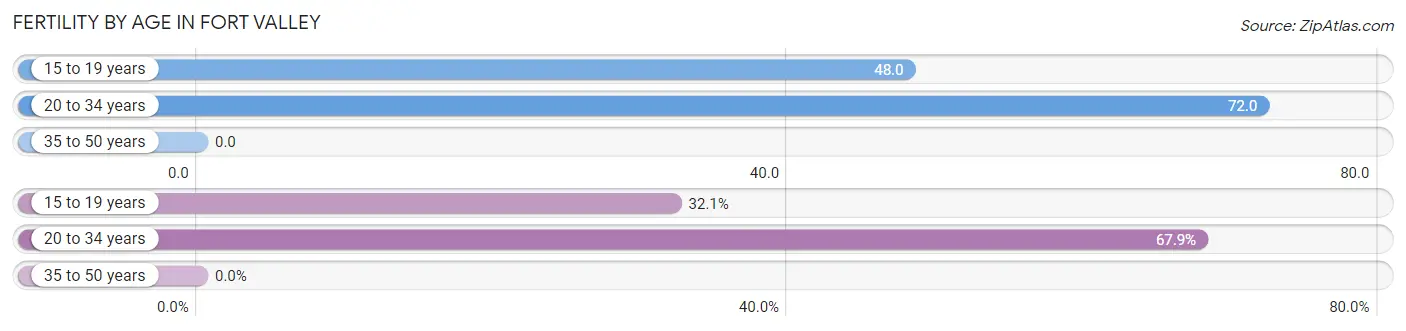
| Age Bracket | Women with Births | Births / 1,000 Women |
| 15 to 19 years | 36 (32.1%) | 48.0 |
| 20 to 34 years | 76 (67.9%) | 72.0 |
| 35 to 50 years | 0 (0.0%) | 0.0 |
| Total | 112 (100.0%) | 46.0 |
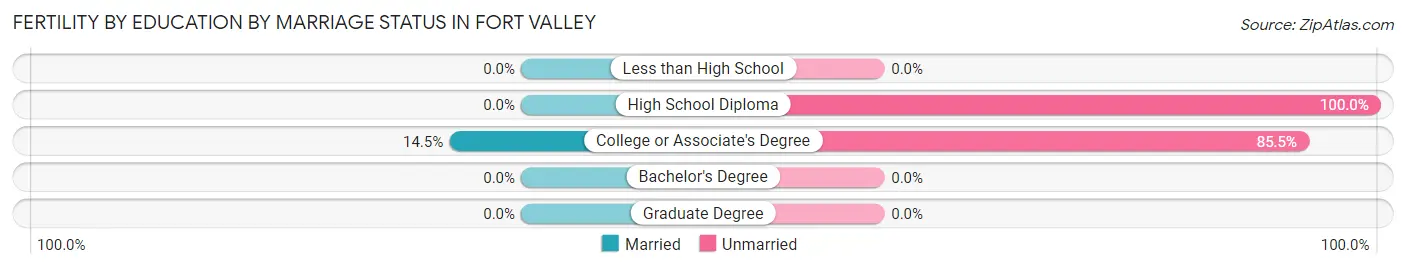
Fertility by Age by Marriage Status in Fort Valley
9.8% of women with births (112) in Fort Valley are married. The highest percentage of unmarried women with births falls into 15 to 19 years age bracket with 100.0% of them unmarried at the time of birth, while the lowest percentage of unmarried women with births belong to 20 to 34 years age bracket with 85.5% of them unmarried.
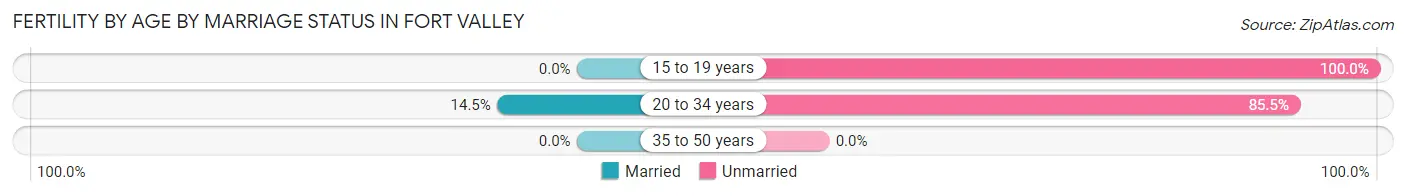
| Age Bracket | Married | Unmarried |
| 15 to 19 years | 0 (0.0%) | 36 (100.0%) |
| 20 to 34 years | 11 (14.5%) | 65 (85.5%) |
| 35 to 50 years | 0 (0.0%) | 0 (0.0%) |
| Total | 11 (9.8%) | 101 (90.2%) |
Fertility by Education in Fort Valley
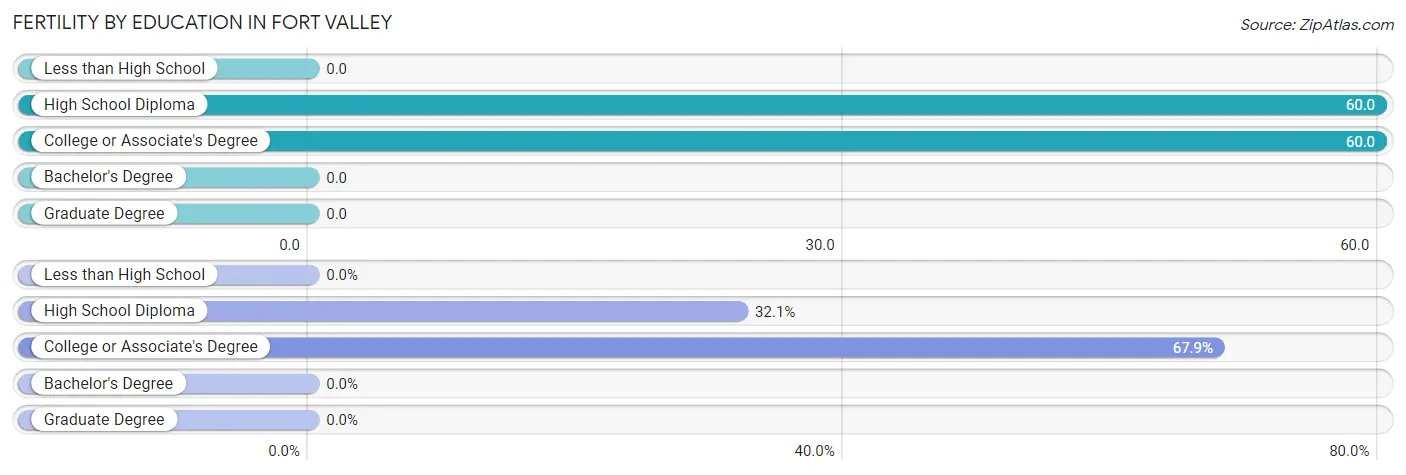
| Educational Attainment | Women with Births | Births / 1,000 Women |
| Less than High School | 0 (0.0%) | 0.0 |
| High School Diploma | 36 (32.1%) | 60.0 |
| College or Associate's Degree | 76 (67.9%) | 60.0 |
| Bachelor's Degree | 0 (0.0%) | 0.0 |
| Graduate Degree | 0 (0.0%) | 0.0 |
| Total | 112 (100.0%) | 46.0 |
Fertility by Education by Marriage Status in Fort Valley
90.2% of women with births in Fort Valley are unmarried. Women with the educational attainment of college or associate's degree are most likely to be married with 14.5% of them married at childbirth, while women with the educational attainment of high school diploma are least likely to be married with 100.0% of them unmarried at childbirth.
| Educational Attainment | Married | Unmarried |
| Less than High School | 0 (0.0%) | 0 (0.0%) |
| High School Diploma | 0 (0.0%) | 36 (100.0%) |
| College or Associate's Degree | 11 (14.5%) | 65 (85.5%) |
| Bachelor's Degree | 0 (0.0%) | 0 (0.0%) |
| Graduate Degree | 0 (0.0%) | 0 (0.0%) |
| Total | 11 (9.8%) | 101 (90.2%) |
Employment Characteristics in Fort Valley
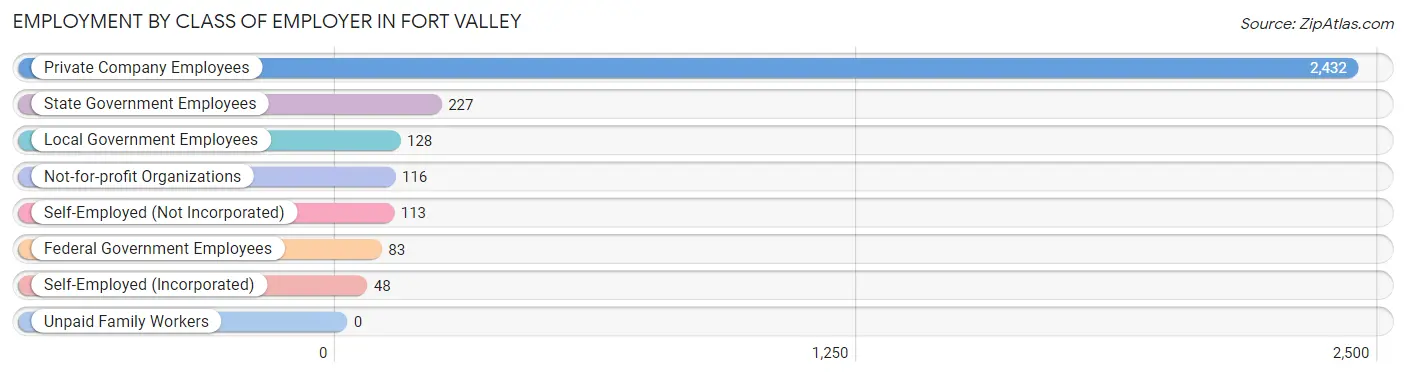
Employment by Class of Employer in Fort Valley
Among the 3,147 employed individuals in Fort Valley, private company employees (2,432 | 77.3%), state government employees (227 | 7.2%), and local government employees (128 | 4.1%) make up the most common classes of employment.
| Employer Class | # Employees | % Employees |
| Private Company Employees | 2,432 | 77.3% |
| Self-Employed (Incorporated) | 48 | 1.5% |
| Self-Employed (Not Incorporated) | 113 | 3.6% |
| Not-for-profit Organizations | 116 | 3.7% |
| Local Government Employees | 128 | 4.1% |
| State Government Employees | 227 | 7.2% |
| Federal Government Employees | 83 | 2.6% |
| Unpaid Family Workers | 0 | 0.0% |
| Total | 3,147 | 100.0% |
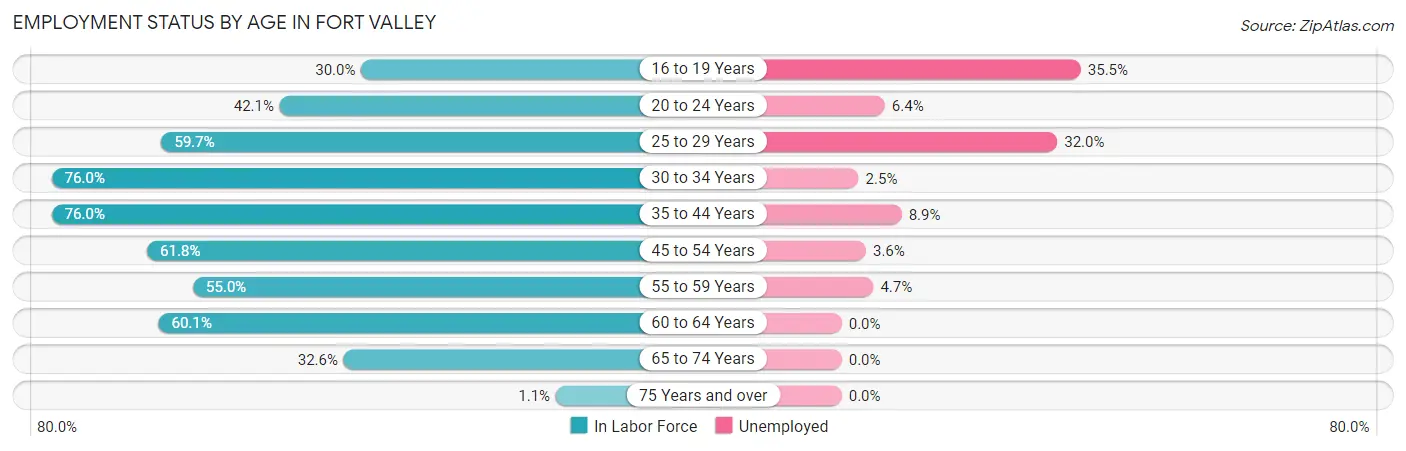
Employment Status by Age in Fort Valley
According to the labor force statistics for Fort Valley, out of the total population over 16 years of age (7,384), 48.8% or 3,603 individuals are in the labor force, with 9.4% or 339 of them unemployed. The age group with the highest labor force participation rate is 30 to 34 years, with 76.0% or 551 individuals in the labor force. Within the labor force, the 16 to 19 years age range has the highest percentage of unemployed individuals, with 35.5% or 134 of them being unemployed.
| Age Bracket | In Labor Force | Unemployed |
| 16 to 19 Years | 377 (30.0%) | 134 (35.5%) |
| 20 to 24 Years | 498 (42.1%) | 32 (6.4%) |
| 25 to 29 Years | 219 (59.7%) | 70 (32.0%) |
| 30 to 34 Years | 551 (76.0%) | 14 (2.5%) |
| 35 to 44 Years | 749 (76.0%) | 67 (8.9%) |
| 45 to 54 Years | 363 (61.8%) | 13 (3.6%) |
| 55 to 59 Years | 192 (55.0%) | 9 (4.7%) |
| 60 to 64 Years | 385 (60.1%) | 0 (0.0%) |
| 65 to 74 Years | 267 (32.6%) | 0 (0.0%) |
| 75 Years and over | 5 (1.1%) | 0 (0.0%) |
| Total | 3,603 (48.8%) | 339 (9.4%) |
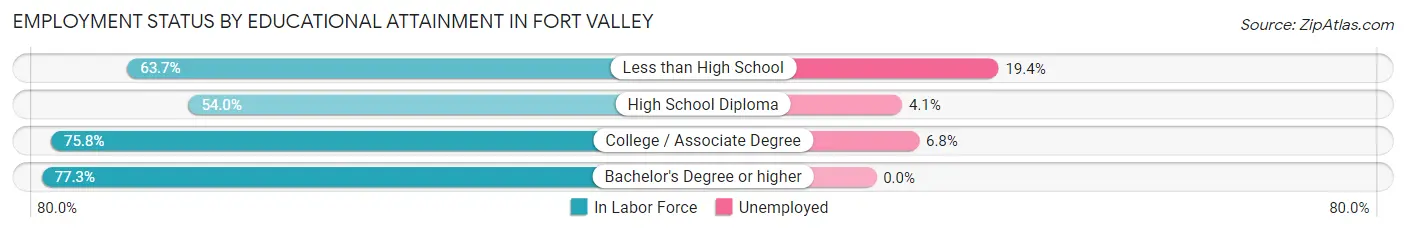
Employment Status by Educational Attainment in Fort Valley
According to labor force statistics for Fort Valley, 67.3% of individuals (2,460) out of the total population between 25 and 64 years of age (3,655) are in the labor force, with 7.0% or 172 of them being unemployed. The group with the highest labor force participation rate are those with the educational attainment of bachelor's degree or higher, with 77.3% or 520 individuals in the labor force. Within the labor force, individuals with less than high school education have the highest percentage of unemployment, with 19.4% or 88 of them being unemployed.
| Educational Attainment | In Labor Force | Unemployed |
| Less than High School | 454 (63.7%) | 138 (19.4%) |
| High School Diploma | 582 (54.0%) | 44 (4.1%) |
| College / Associate Degree | 903 (75.8%) | 81 (6.8%) |
| Bachelor's Degree or higher | 520 (77.3%) | 0 (0.0%) |
| Total | 2,460 (67.3%) | 256 (7.0%) |
Employment Occupations by Sex in Fort Valley
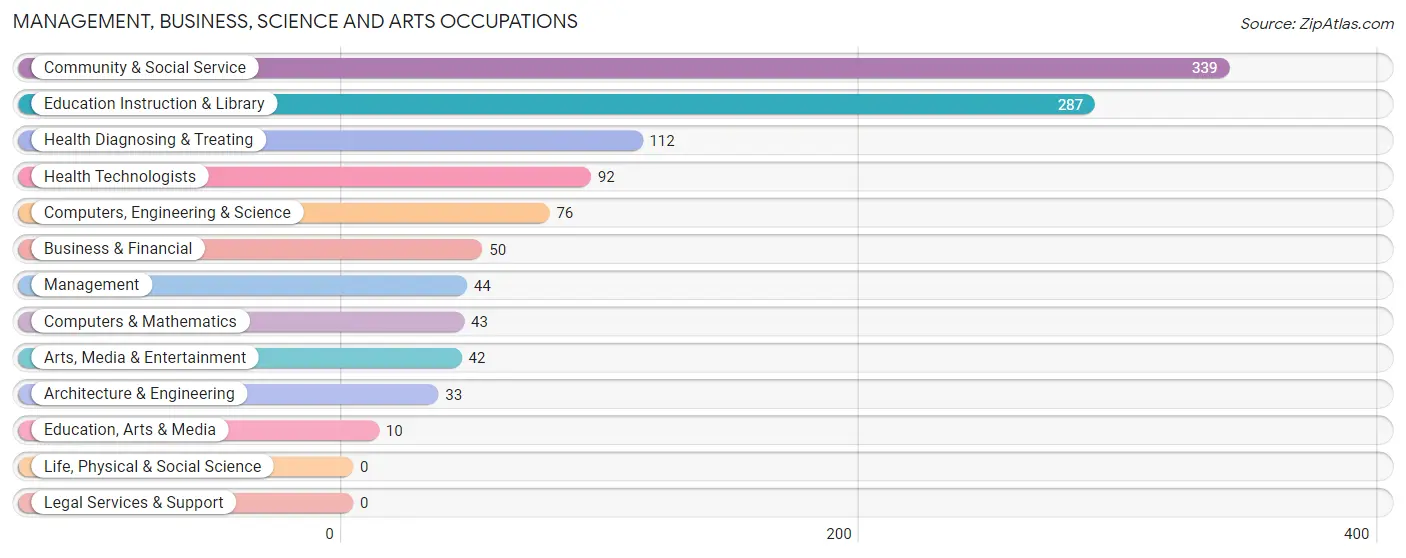
Management, Business, Science and Arts Occupations
The most common Management, Business, Science and Arts occupations in Fort Valley are Community & Social Service (339 | 10.4%), Education Instruction & Library (287 | 8.8%), Health Diagnosing & Treating (112 | 3.4%), Health Technologists (92 | 2.8%), and Computers, Engineering & Science (76 | 2.3%).
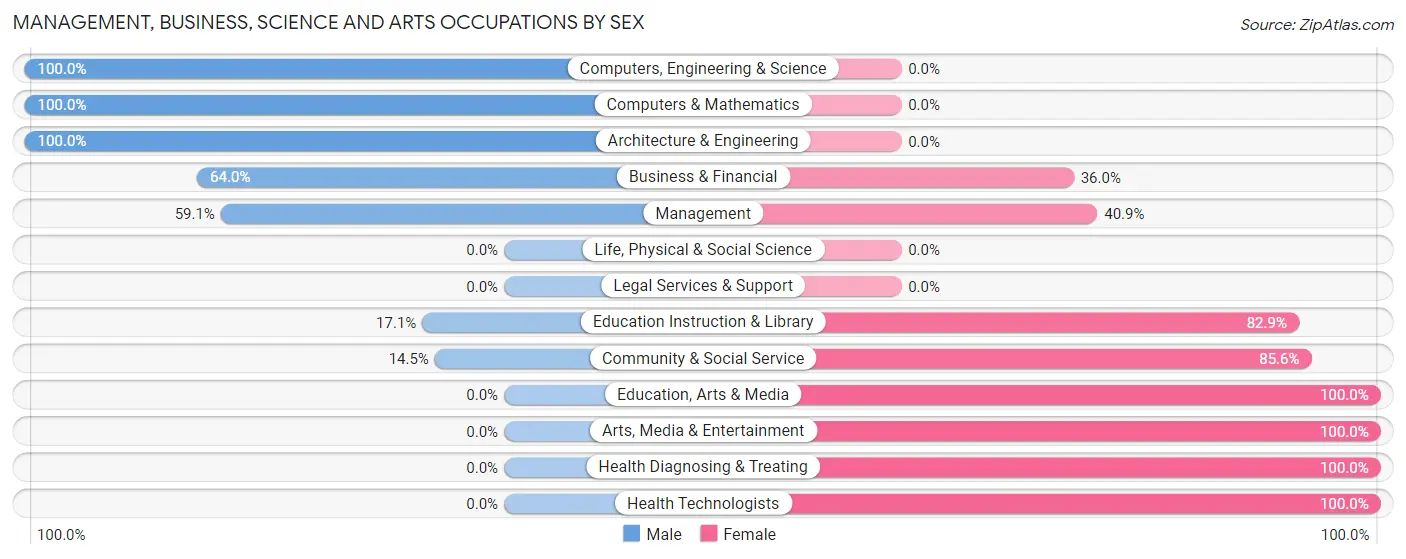
Management, Business, Science and Arts Occupations by Sex
Within the Management, Business, Science and Arts occupations in Fort Valley, the most male-oriented occupations are Computers, Engineering & Science (100.0%), Computers & Mathematics (100.0%), and Architecture & Engineering (100.0%), while the most female-oriented occupations are Education, Arts & Media (100.0%), Arts, Media & Entertainment (100.0%), and Health Diagnosing & Treating (100.0%).
| Occupation | Male | Female |
| Management | 26 (59.1%) | 18 (40.9%) |
| Business & Financial | 32 (64.0%) | 18 (36.0%) |
| Computers, Engineering & Science | 76 (100.0%) | 0 (0.0%) |
| Computers & Mathematics | 43 (100.0%) | 0 (0.0%) |
| Architecture & Engineering | 33 (100.0%) | 0 (0.0%) |
| Life, Physical & Social Science | 0 (0.0%) | 0 (0.0%) |
| Community & Social Service | 49 (14.4%) | 290 (85.6%) |
| Education, Arts & Media | 0 (0.0%) | 10 (100.0%) |
| Legal Services & Support | 0 (0.0%) | 0 (0.0%) |
| Education Instruction & Library | 49 (17.1%) | 238 (82.9%) |
| Arts, Media & Entertainment | 0 (0.0%) | 42 (100.0%) |
| Health Diagnosing & Treating | 0 (0.0%) | 112 (100.0%) |
| Health Technologists | 0 (0.0%) | 92 (100.0%) |
| Total (Category) | 183 (29.5%) | 438 (70.5%) |
| Total (Overall) | 1,731 (53.0%) | 1,536 (47.0%) |
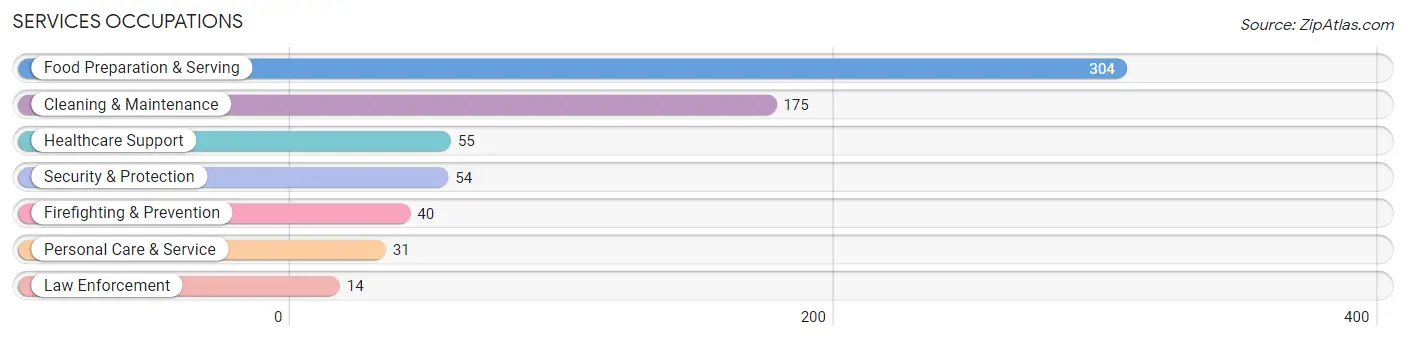
Services Occupations
The most common Services occupations in Fort Valley are Food Preparation & Serving (304 | 9.3%), Cleaning & Maintenance (175 | 5.4%), Healthcare Support (55 | 1.7%), Security & Protection (54 | 1.7%), and Firefighting & Prevention (40 | 1.2%).
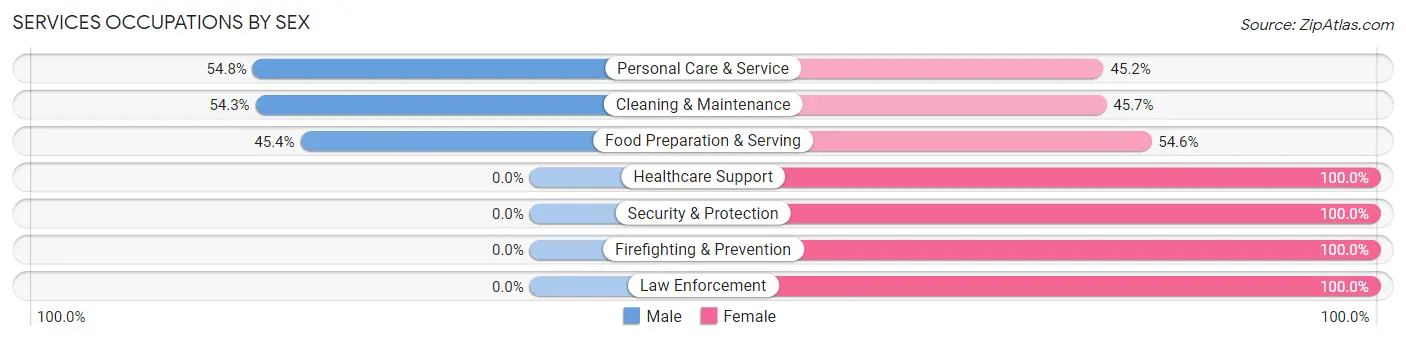
Services Occupations by Sex
Within the Services occupations in Fort Valley, the most male-oriented occupations are Personal Care & Service (54.8%), Cleaning & Maintenance (54.3%), and Food Preparation & Serving (45.4%), while the most female-oriented occupations are Healthcare Support (100.0%), Security & Protection (100.0%), and Firefighting & Prevention (100.0%).
| Occupation | Male | Female |
| Healthcare Support | 0 (0.0%) | 55 (100.0%) |
| Security & Protection | 0 (0.0%) | 54 (100.0%) |
| Firefighting & Prevention | 0 (0.0%) | 40 (100.0%) |
| Law Enforcement | 0 (0.0%) | 14 (100.0%) |
| Food Preparation & Serving | 138 (45.4%) | 166 (54.6%) |
| Cleaning & Maintenance | 95 (54.3%) | 80 (45.7%) |
| Personal Care & Service | 17 (54.8%) | 14 (45.2%) |
| Total (Category) | 250 (40.4%) | 369 (59.6%) |
| Total (Overall) | 1,731 (53.0%) | 1,536 (47.0%) |
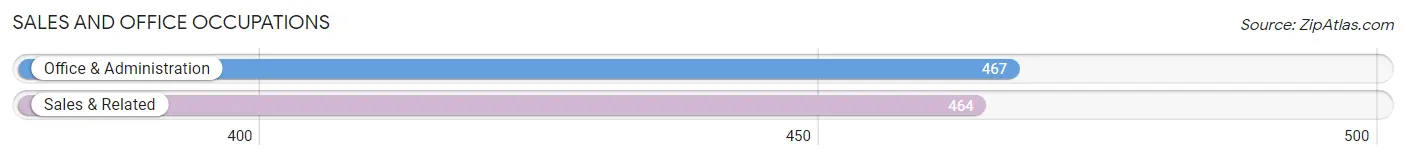
Sales and Office Occupations
The most common Sales and Office occupations in Fort Valley are Office & Administration (467 | 14.3%), and Sales & Related (464 | 14.2%).
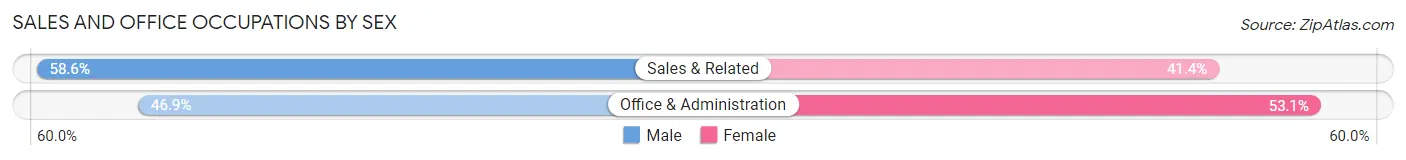
Sales and Office Occupations by Sex
| Occupation | Male | Female |
| Sales & Related | 272 (58.6%) | 192 (41.4%) |
| Office & Administration | 219 (46.9%) | 248 (53.1%) |
| Total (Category) | 491 (52.7%) | 440 (47.3%) |
| Total (Overall) | 1,731 (53.0%) | 1,536 (47.0%) |
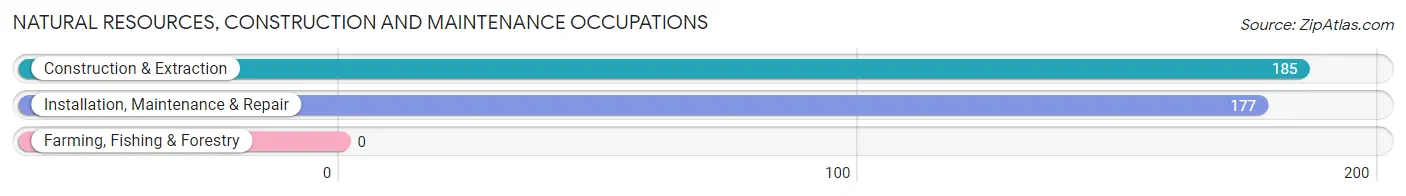
Natural Resources, Construction and Maintenance Occupations
The most common Natural Resources, Construction and Maintenance occupations in Fort Valley are Construction & Extraction (185 | 5.7%), and Installation, Maintenance & Repair (177 | 5.4%).
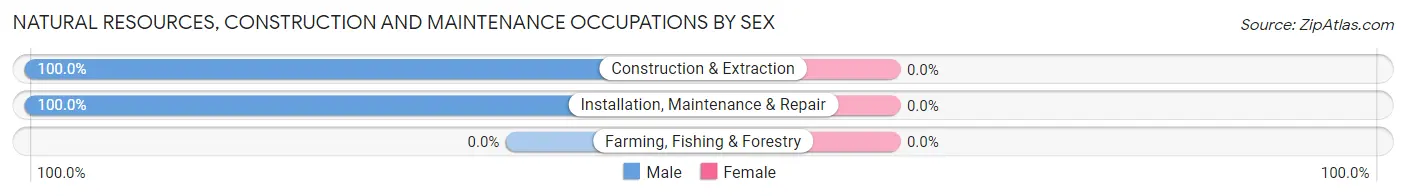
Natural Resources, Construction and Maintenance Occupations by Sex
| Occupation | Male | Female |
| Farming, Fishing & Forestry | 0 (0.0%) | 0 (0.0%) |
| Construction & Extraction | 185 (100.0%) | 0 (0.0%) |
| Installation, Maintenance & Repair | 177 (100.0%) | 0 (0.0%) |
| Total (Category) | 362 (100.0%) | 0 (0.0%) |
| Total (Overall) | 1,731 (53.0%) | 1,536 (47.0%) |
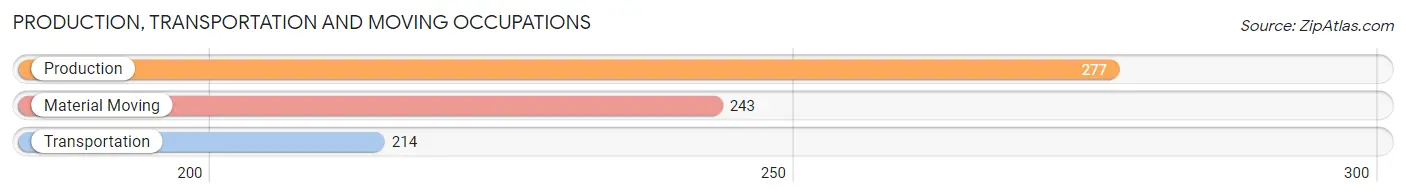
Production, Transportation and Moving Occupations
The most common Production, Transportation and Moving occupations in Fort Valley are Production (277 | 8.5%), Material Moving (243 | 7.4%), and Transportation (214 | 6.6%).
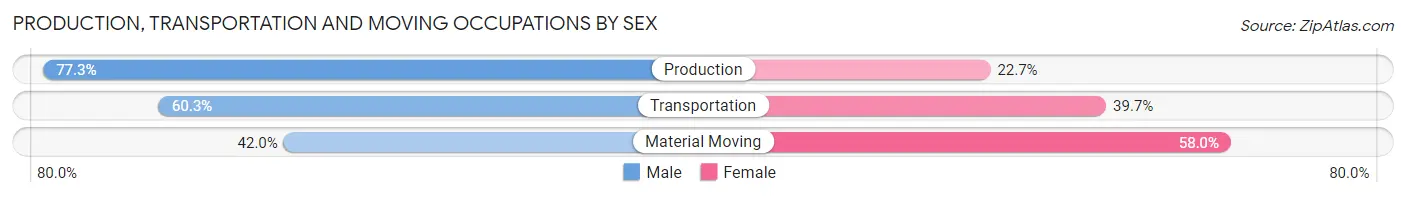
Production, Transportation and Moving Occupations by Sex
| Occupation | Male | Female |
| Production | 214 (77.3%) | 63 (22.7%) |
| Transportation | 129 (60.3%) | 85 (39.7%) |
| Material Moving | 102 (42.0%) | 141 (58.0%) |
| Total (Category) | 445 (60.6%) | 289 (39.4%) |
| Total (Overall) | 1,731 (53.0%) | 1,536 (47.0%) |
Employment Industries by Sex in Fort Valley
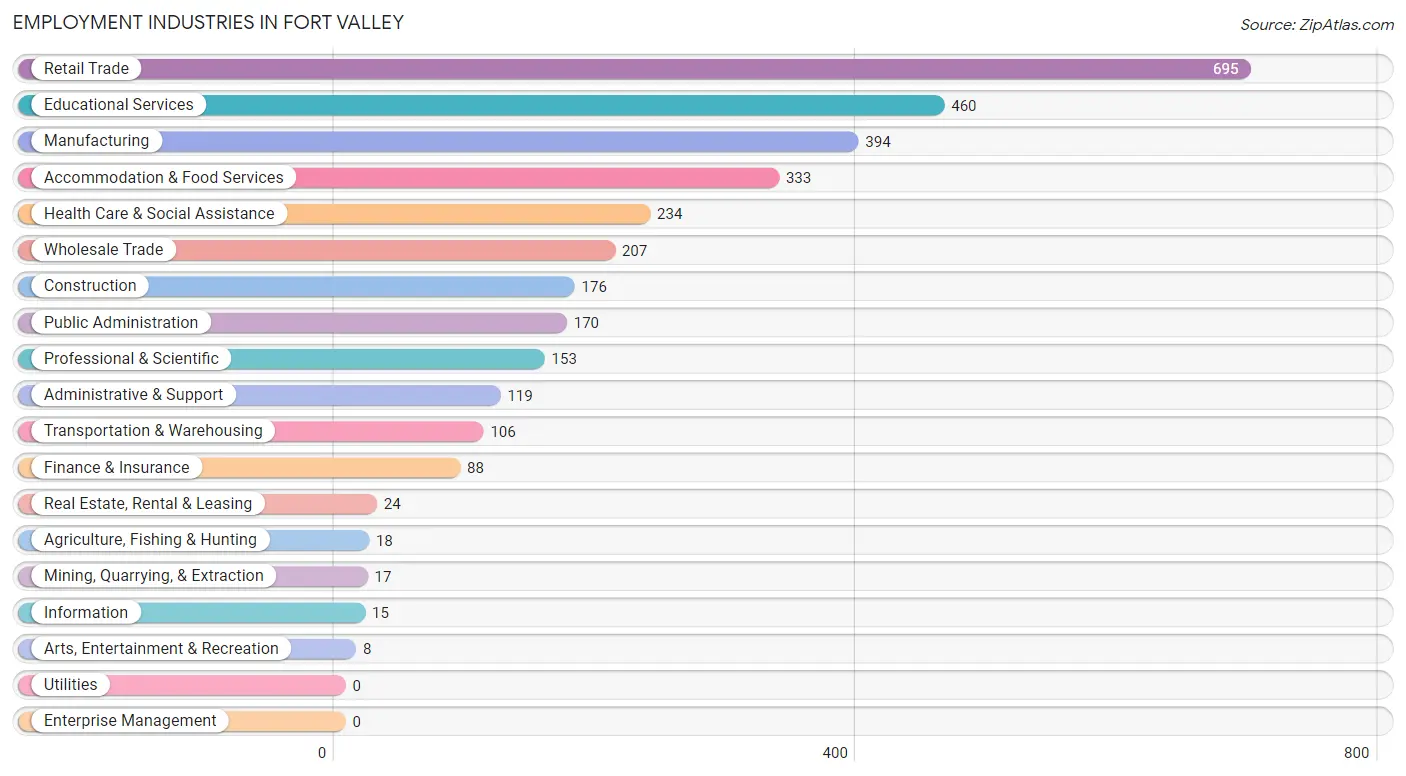
Employment Industries in Fort Valley
The major employment industries in Fort Valley include Retail Trade (695 | 21.3%), Educational Services (460 | 14.1%), Manufacturing (394 | 12.1%), Accommodation & Food Services (333 | 10.2%), and Health Care & Social Assistance (234 | 7.2%).
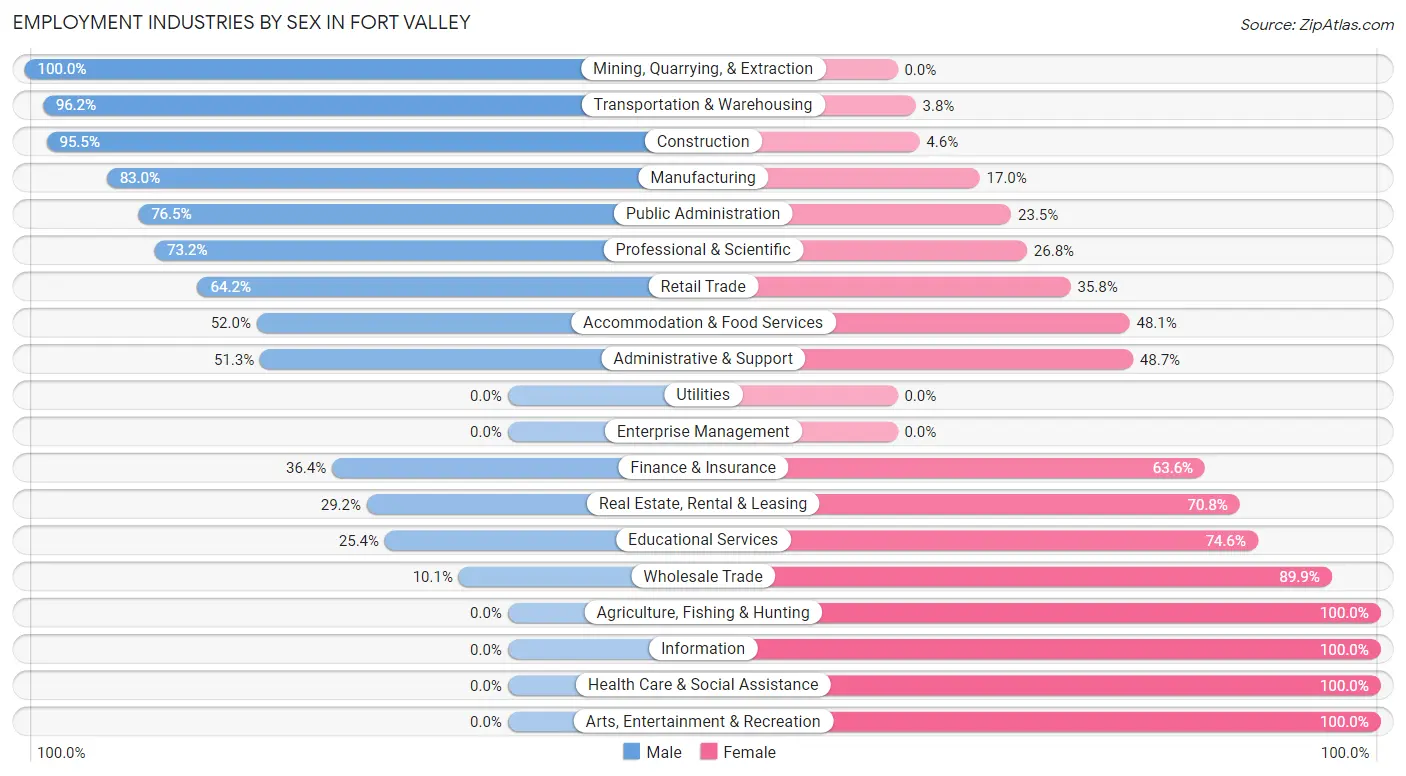
Employment Industries by Sex in Fort Valley
The Fort Valley industries that see more men than women are Mining, Quarrying, & Extraction (100.0%), Transportation & Warehousing (96.2%), and Construction (95.5%), whereas the industries that tend to have a higher number of women are Agriculture, Fishing & Hunting (100.0%), Information (100.0%), and Health Care & Social Assistance (100.0%).
| Industry | Male | Female |
| Agriculture, Fishing & Hunting | 0 (0.0%) | 18 (100.0%) |
| Mining, Quarrying, & Extraction | 17 (100.0%) | 0 (0.0%) |
| Construction | 168 (95.5%) | 8 (4.5%) |
| Manufacturing | 327 (83.0%) | 67 (17.0%) |
| Wholesale Trade | 21 (10.1%) | 186 (89.9%) |
| Retail Trade | 446 (64.2%) | 249 (35.8%) |
| Transportation & Warehousing | 102 (96.2%) | 4 (3.8%) |
| Utilities | 0 (0.0%) | 0 (0.0%) |
| Information | 0 (0.0%) | 15 (100.0%) |
| Finance & Insurance | 32 (36.4%) | 56 (63.6%) |
| Real Estate, Rental & Leasing | 7 (29.2%) | 17 (70.8%) |
| Professional & Scientific | 112 (73.2%) | 41 (26.8%) |
| Enterprise Management | 0 (0.0%) | 0 (0.0%) |
| Administrative & Support | 61 (51.3%) | 58 (48.7%) |
| Educational Services | 117 (25.4%) | 343 (74.6%) |
| Health Care & Social Assistance | 0 (0.0%) | 234 (100.0%) |
| Arts, Entertainment & Recreation | 0 (0.0%) | 8 (100.0%) |
| Accommodation & Food Services | 173 (51.9%) | 160 (48.0%) |
| Public Administration | 130 (76.5%) | 40 (23.5%) |
| Total | 1,731 (53.0%) | 1,536 (47.0%) |
Education in Fort Valley
School Enrollment in Fort Valley
The most common levels of schooling among the 3,174 students in Fort Valley are college / undergraduate (1,895 | 59.7%), middle school (436 | 13.7%), and high school (390 | 12.3%).
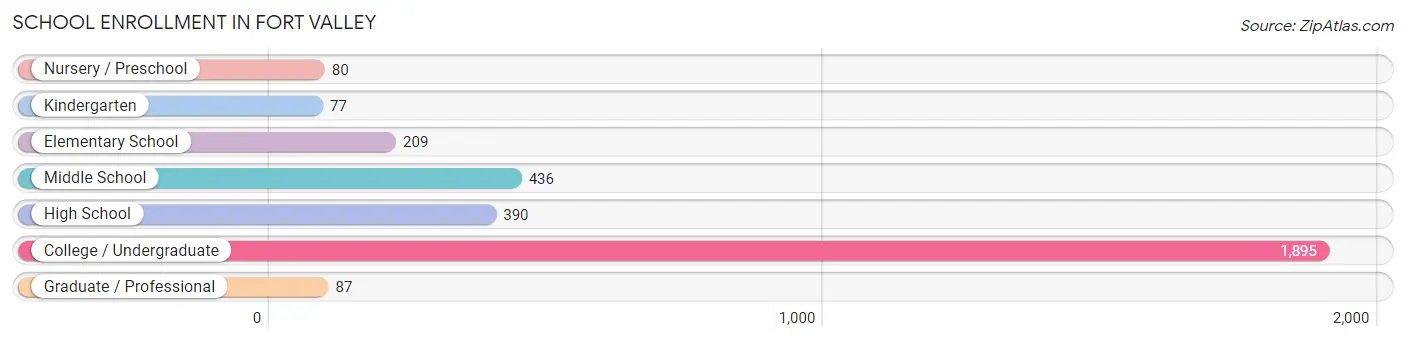
| School Level | # Students | % Students |
| Nursery / Preschool | 80 | 2.5% |
| Kindergarten | 77 | 2.4% |
| Elementary School | 209 | 6.6% |
| Middle School | 436 | 13.7% |
| High School | 390 | 12.3% |
| College / Undergraduate | 1,895 | 59.7% |
| Graduate / Professional | 87 | 2.7% |
| Total | 3,174 | 100.0% |
School Enrollment by Age by Funding Source in Fort Valley
Out of a total of 3,174 students who are enrolled in schools in Fort Valley, 190 (6.0%) attend a private institution, while the remaining 2,984 (94.0%) are enrolled in public schools. The age group of 18 to 19 year olds has the highest likelihood of being enrolled in private schools, with 81 (8.5% in the age bracket) enrolled. Conversely, the age group of 25 to 34 year olds has the lowest likelihood of being enrolled in a private school, with 71 (100.0% in the age bracket) attending a public institution.
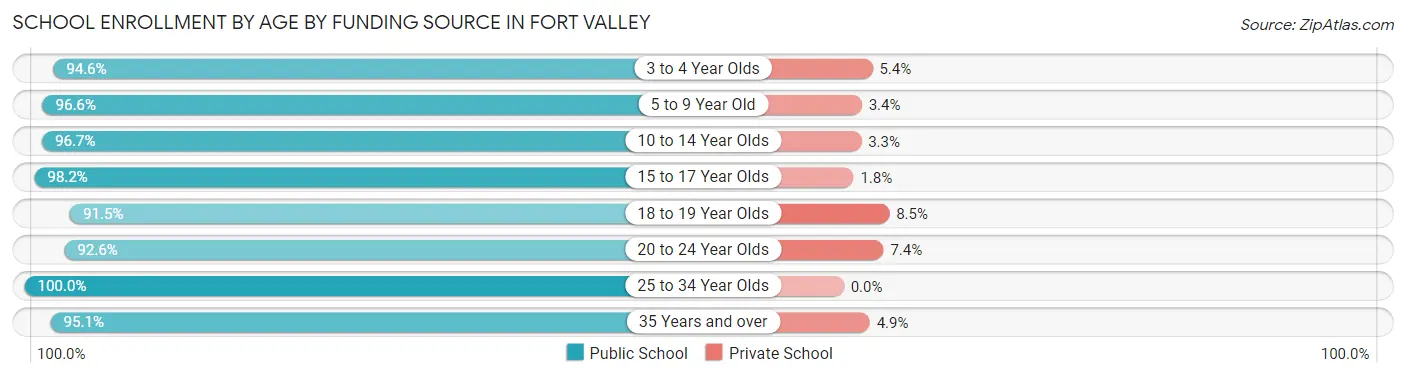
| Age Bracket | Public School | Private School |
| 3 to 4 Year Olds | 53 (94.6%) | 3 (5.4%) |
| 5 to 9 Year Old | 288 (96.6%) | 10 (3.4%) |
| 10 to 14 Year Olds | 474 (96.7%) | 16 (3.3%) |
| 15 to 17 Year Olds | 214 (98.2%) | 4 (1.8%) |
| 18 to 19 Year Olds | 873 (91.5%) | 81 (8.5%) |
| 20 to 24 Year Olds | 873 (92.6%) | 70 (7.4%) |
| 25 to 34 Year Olds | 71 (100.0%) | 0 (0.0%) |
| 35 Years and over | 137 (95.1%) | 7 (4.9%) |
| Total | 2,984 (94.0%) | 190 (6.0%) |
Educational Attainment by Field of Study in Fort Valley
Science & technology (211 | 20.3%), education (192 | 18.5%), literature & languages (185 | 17.8%), business (94 | 9.1%), and bio, nature & agricultural (88 | 8.5%) are the most common fields of study among 1,037 individuals in Fort Valley who have obtained a bachelor's degree or higher.
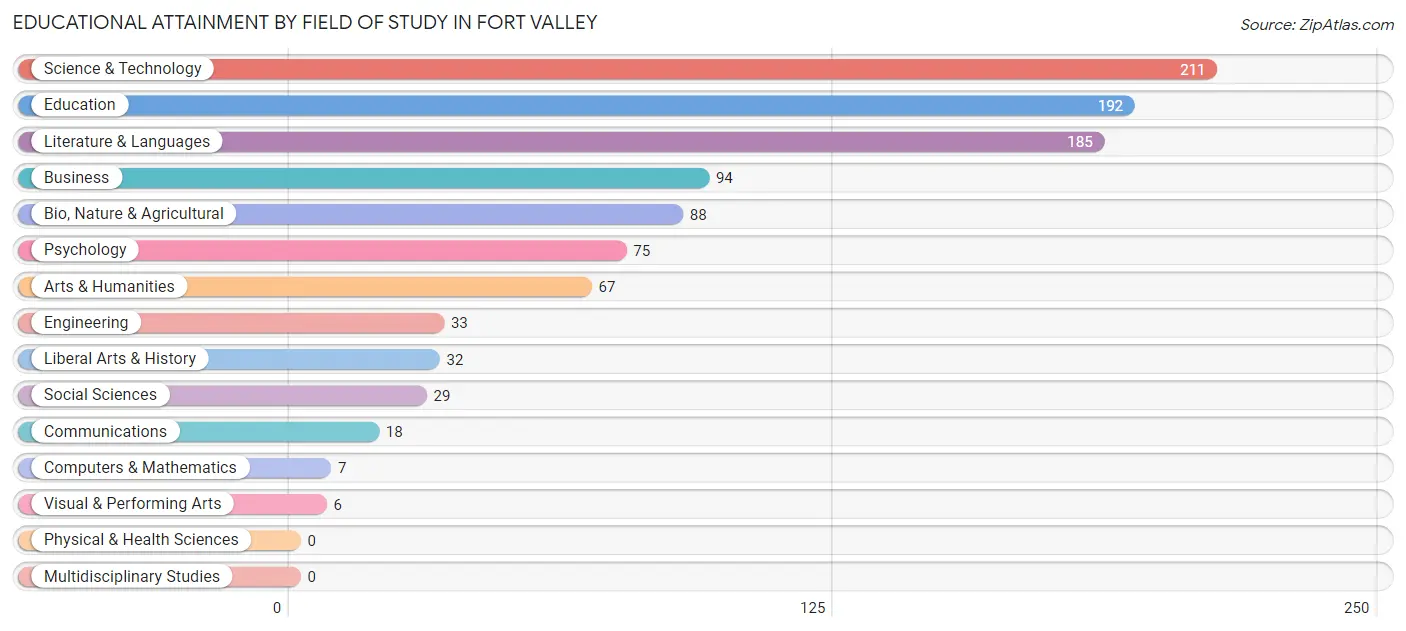
| Field of Study | # Graduates | % Graduates |
| Computers & Mathematics | 7 | 0.7% |
| Bio, Nature & Agricultural | 88 | 8.5% |
| Physical & Health Sciences | 0 | 0.0% |
| Psychology | 75 | 7.2% |
| Social Sciences | 29 | 2.8% |
| Engineering | 33 | 3.2% |
| Multidisciplinary Studies | 0 | 0.0% |
| Science & Technology | 211 | 20.3% |
| Business | 94 | 9.1% |
| Education | 192 | 18.5% |
| Literature & Languages | 185 | 17.8% |
| Liberal Arts & History | 32 | 3.1% |
| Visual & Performing Arts | 6 | 0.6% |
| Communications | 18 | 1.7% |
| Arts & Humanities | 67 | 6.5% |
| Total | 1,037 | 100.0% |
Transportation & Commute in Fort Valley
Vehicle Availability by Sex in Fort Valley
The most prevalent vehicle ownership categories in Fort Valley are males with 2 vehicles (544, accounting for 34.2%) and females with 2 vehicles (268, making up 42.0%).
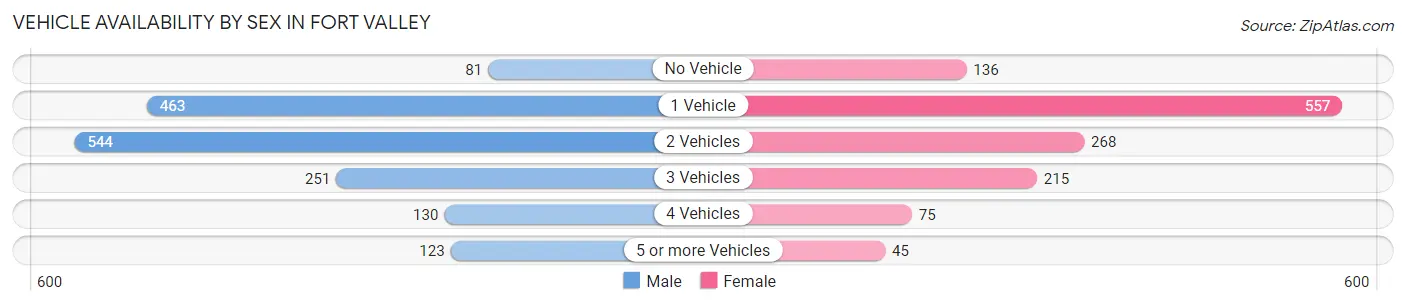
| Vehicles Available | Male | Female |
| No Vehicle | 81 (5.1%) | 136 (10.5%) |
| 1 Vehicle | 463 (29.1%) | 557 (43.0%) |
| 2 Vehicles | 544 (34.2%) | 268 (20.7%) |
| 3 Vehicles | 251 (15.8%) | 215 (16.6%) |
| 4 Vehicles | 130 (8.2%) | 75 (5.8%) |
| 5 or more Vehicles | 123 (7.7%) | 45 (3.5%) |
| Total | 1,592 (100.0%) | 1,296 (100.0%) |
Commute Time in Fort Valley
The most frequently occuring commute durations in Fort Valley are 30 to 34 minutes (704 commuters, 23.3%), 10 to 14 minutes (473 commuters, 15.6%), and 20 to 24 minutes (468 commuters, 15.5%).
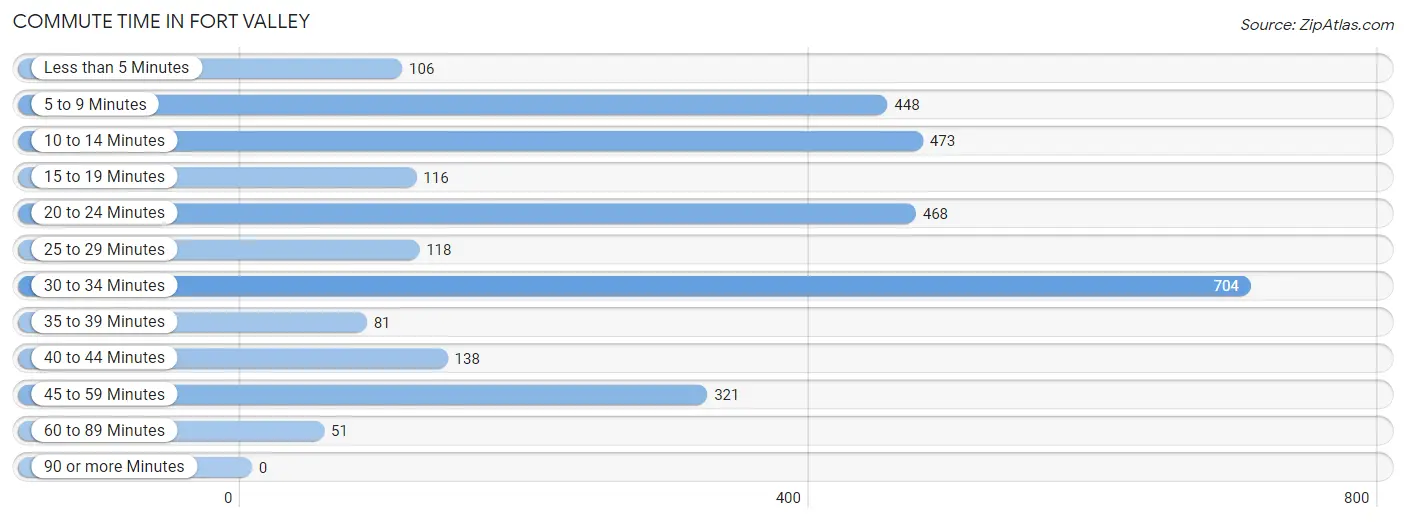
| Commute Time | # Commuters | % Commuters |
| Less than 5 Minutes | 106 | 3.5% |
| 5 to 9 Minutes | 448 | 14.8% |
| 10 to 14 Minutes | 473 | 15.6% |
| 15 to 19 Minutes | 116 | 3.8% |
| 20 to 24 Minutes | 468 | 15.5% |
| 25 to 29 Minutes | 118 | 3.9% |
| 30 to 34 Minutes | 704 | 23.3% |
| 35 to 39 Minutes | 81 | 2.7% |
| 40 to 44 Minutes | 138 | 4.6% |
| 45 to 59 Minutes | 321 | 10.6% |
| 60 to 89 Minutes | 51 | 1.7% |
| 90 or more Minutes | 0 | 0.0% |
Commute Time by Sex in Fort Valley
The most common commute times in Fort Valley are 30 to 34 minutes (403 commuters, 24.0%) for males and 30 to 34 minutes (301 commuters, 22.4%) for females.
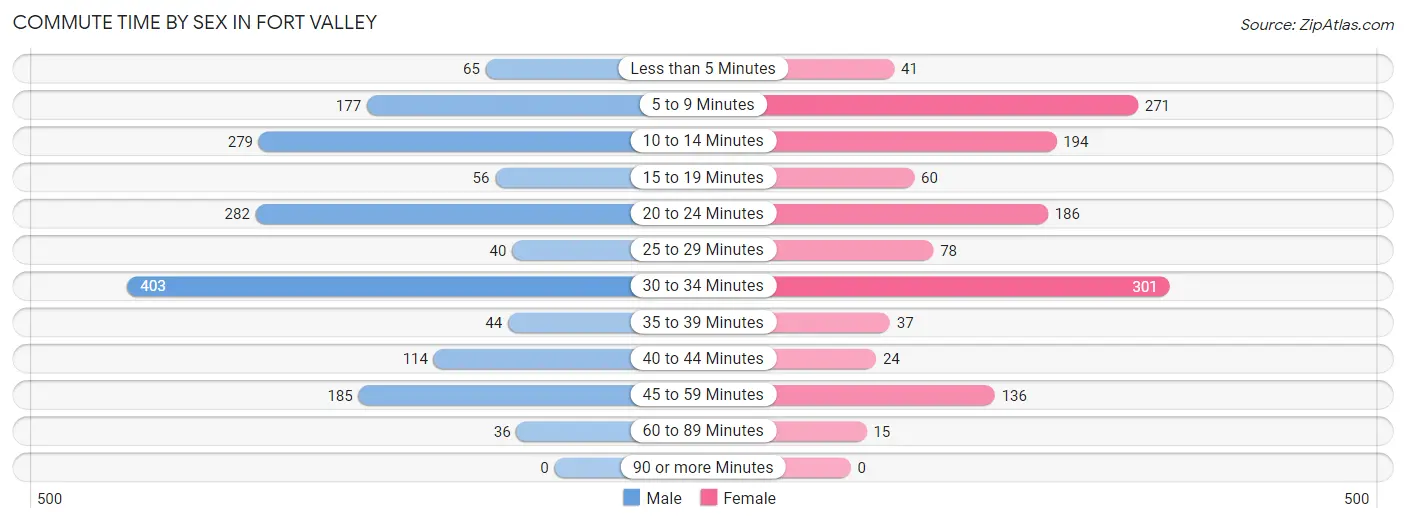
| Commute Time | Male | Female |
| Less than 5 Minutes | 65 (3.9%) | 41 (3.0%) |
| 5 to 9 Minutes | 177 (10.5%) | 271 (20.2%) |
| 10 to 14 Minutes | 279 (16.6%) | 194 (14.4%) |
| 15 to 19 Minutes | 56 (3.3%) | 60 (4.5%) |
| 20 to 24 Minutes | 282 (16.8%) | 186 (13.9%) |
| 25 to 29 Minutes | 40 (2.4%) | 78 (5.8%) |
| 30 to 34 Minutes | 403 (24.0%) | 301 (22.4%) |
| 35 to 39 Minutes | 44 (2.6%) | 37 (2.8%) |
| 40 to 44 Minutes | 114 (6.8%) | 24 (1.8%) |
| 45 to 59 Minutes | 185 (11.0%) | 136 (10.1%) |
| 60 to 89 Minutes | 36 (2.1%) | 15 (1.1%) |
| 90 or more Minutes | 0 (0.0%) | 0 (0.0%) |
Time of Departure to Work by Sex in Fort Valley
The most frequent times of departure to work in Fort Valley are 4:00 PM to 11:59 PM (258, 15.3%) for males and 7:30 AM to 7:59 AM (340, 25.3%) for females.
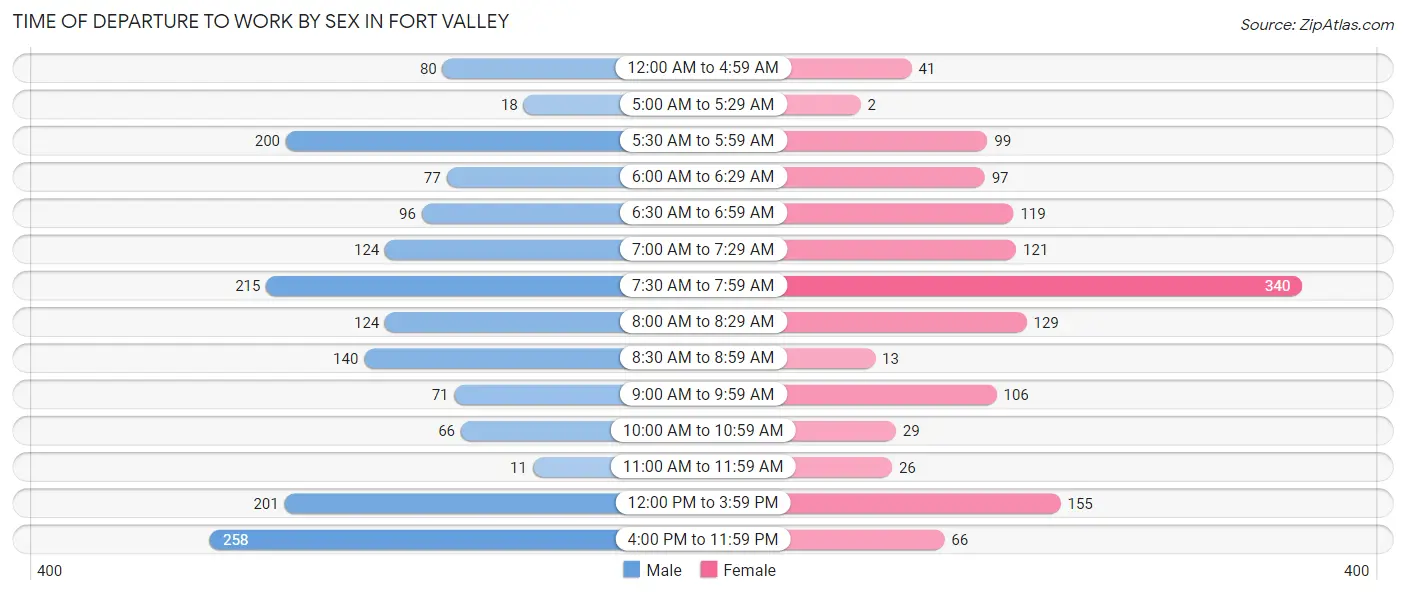
| Time of Departure | Male | Female |
| 12:00 AM to 4:59 AM | 80 (4.8%) | 41 (3.0%) |
| 5:00 AM to 5:29 AM | 18 (1.1%) | 2 (0.2%) |
| 5:30 AM to 5:59 AM | 200 (11.9%) | 99 (7.4%) |
| 6:00 AM to 6:29 AM | 77 (4.6%) | 97 (7.2%) |
| 6:30 AM to 6:59 AM | 96 (5.7%) | 119 (8.9%) |
| 7:00 AM to 7:29 AM | 124 (7.4%) | 121 (9.0%) |
| 7:30 AM to 7:59 AM | 215 (12.8%) | 340 (25.3%) |
| 8:00 AM to 8:29 AM | 124 (7.4%) | 129 (9.6%) |
| 8:30 AM to 8:59 AM | 140 (8.3%) | 13 (1.0%) |
| 9:00 AM to 9:59 AM | 71 (4.2%) | 106 (7.9%) |
| 10:00 AM to 10:59 AM | 66 (3.9%) | 29 (2.2%) |
| 11:00 AM to 11:59 AM | 11 (0.6%) | 26 (1.9%) |
| 12:00 PM to 3:59 PM | 201 (12.0%) | 155 (11.5%) |
| 4:00 PM to 11:59 PM | 258 (15.3%) | 66 (4.9%) |
| Total | 1,681 (100.0%) | 1,343 (100.0%) |
Housing Occupancy in Fort Valley
Occupancy by Ownership in Fort Valley
Of the total 3,118 dwellings in Fort Valley, owner-occupied units account for 1,299 (41.7%), while renter-occupied units make up 1,819 (58.3%).
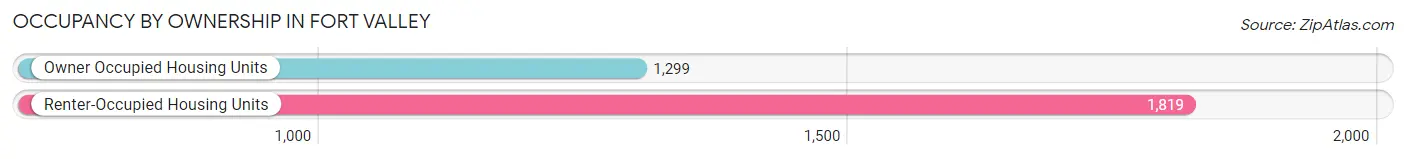
| Occupancy | # Housing Units | % Housing Units |
| Owner Occupied Housing Units | 1,299 | 41.7% |
| Renter-Occupied Housing Units | 1,819 | 58.3% |
| Total Occupied Housing Units | 3,118 | 100.0% |
Occupancy by Household Size in Fort Valley
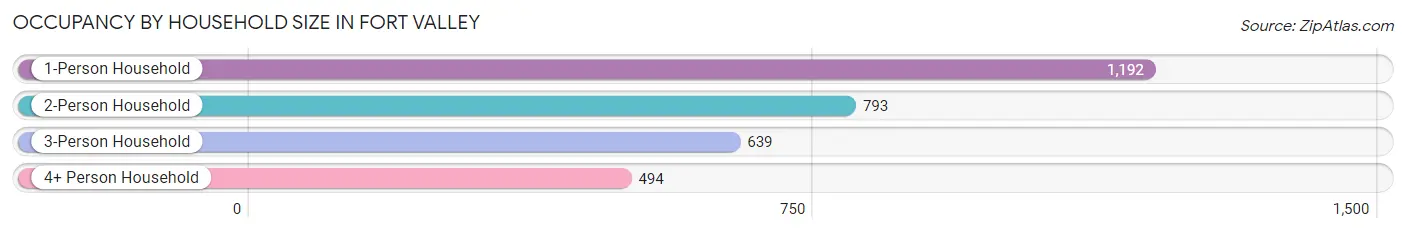
| Household Size | # Housing Units | % Housing Units |
| 1-Person Household | 1,192 | 38.2% |
| 2-Person Household | 793 | 25.4% |
| 3-Person Household | 639 | 20.5% |
| 4+ Person Household | 494 | 15.8% |
| Total Housing Units | 3,118 | 100.0% |
Occupancy by Ownership by Household Size in Fort Valley
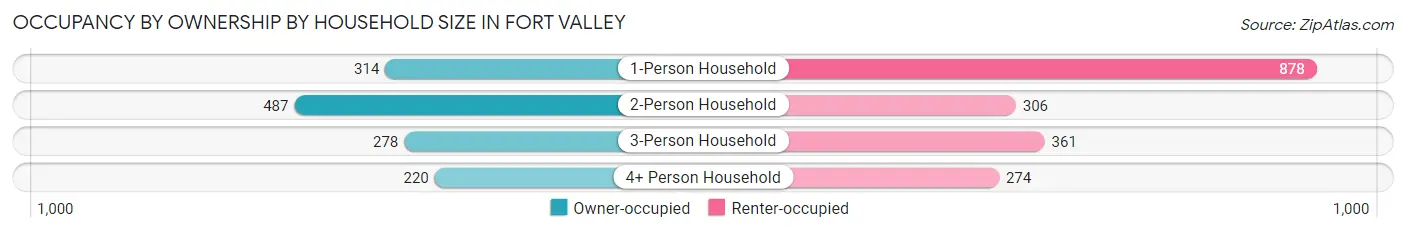
| Household Size | Owner-occupied | Renter-occupied |
| 1-Person Household | 314 (26.3%) | 878 (73.7%) |
| 2-Person Household | 487 (61.4%) | 306 (38.6%) |
| 3-Person Household | 278 (43.5%) | 361 (56.5%) |
| 4+ Person Household | 220 (44.5%) | 274 (55.5%) |
| Total Housing Units | 1,299 (41.7%) | 1,819 (58.3%) |
Occupancy by Educational Attainment in Fort Valley
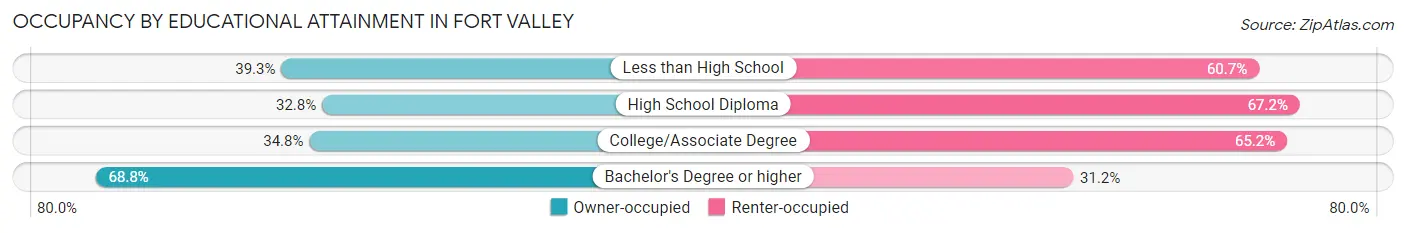
| Household Size | Owner-occupied | Renter-occupied |
| Less than High School | 288 (39.3%) | 445 (60.7%) |
| High School Diploma | 320 (32.8%) | 655 (67.2%) |
| College/Associate Degree | 286 (34.8%) | 535 (65.2%) |
| Bachelor's Degree or higher | 405 (68.8%) | 184 (31.2%) |
Occupancy by Age of Householder in Fort Valley
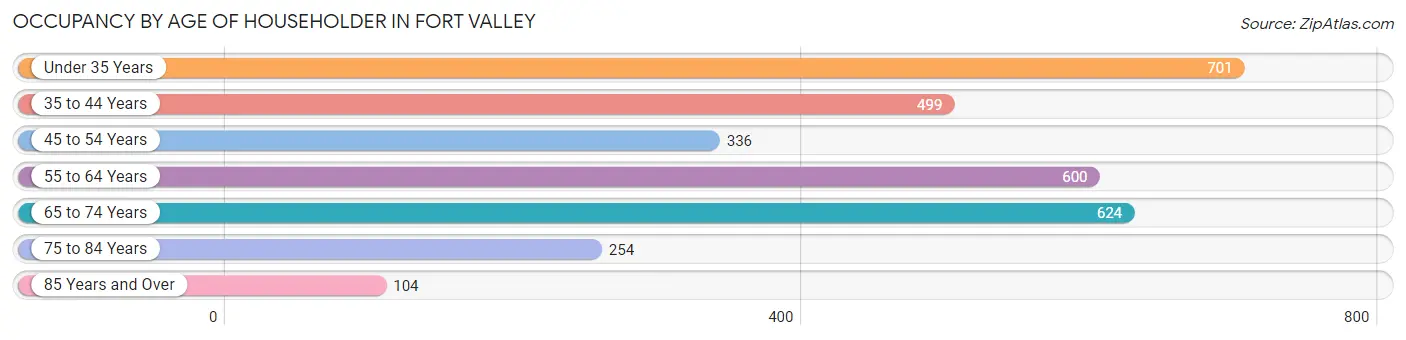
| Age Bracket | # Households | % Households |
| Under 35 Years | 701 | 22.5% |
| 35 to 44 Years | 499 | 16.0% |
| 45 to 54 Years | 336 | 10.8% |
| 55 to 64 Years | 600 | 19.2% |
| 65 to 74 Years | 624 | 20.0% |
| 75 to 84 Years | 254 | 8.2% |
| 85 Years and Over | 104 | 3.3% |
| Total | 3,118 | 100.0% |
Housing Finances in Fort Valley
Median Income by Occupancy in Fort Valley
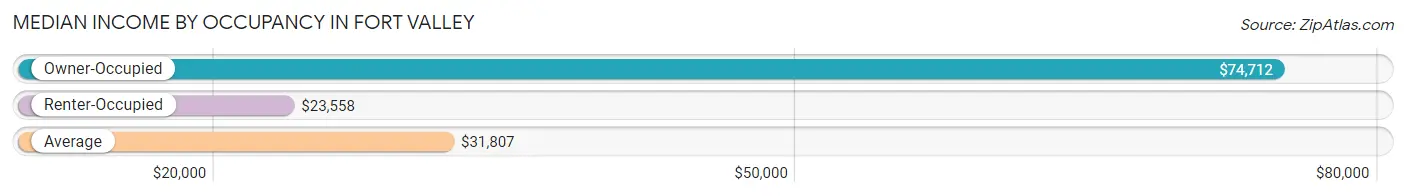
| Occupancy Type | # Households | Median Income |
| Owner-Occupied | 1,299 (41.7%) | $74,712 |
| Renter-Occupied | 1,819 (58.3%) | $23,558 |
| Average | 3,118 (100.0%) | $31,807 |
Occupancy by Householder Income Bracket in Fort Valley

| Income Bracket | Owner-occupied | Renter-occupied |
| Less than $5,000 | 47 (3.6%) | 275 (15.1%) |
| $5,000 to $9,999 | 81 (6.2%) | 187 (10.3%) |
| $10,000 to $14,999 | 40 (3.1%) | 66 (3.6%) |
| $15,000 to $19,999 | 117 (9.0%) | 247 (13.6%) |
| $20,000 to $24,999 | 15 (1.1%) | 202 (11.1%) |
| $25,000 to $34,999 | 36 (2.8%) | 316 (17.4%) |
| $35,000 to $49,999 | 104 (8.0%) | 111 (6.1%) |
| $50,000 to $74,999 | 214 (16.5%) | 351 (19.3%) |
| $75,000 to $99,999 | 138 (10.6%) | 0 (0.0%) |
| $100,000 to $149,999 | 398 (30.6%) | 0 (0.0%) |
| $150,000 or more | 109 (8.4%) | 64 (3.5%) |
| Total | 1,299 (100.0%) | 1,819 (100.0%) |
Monthly Housing Cost Tiers in Fort Valley
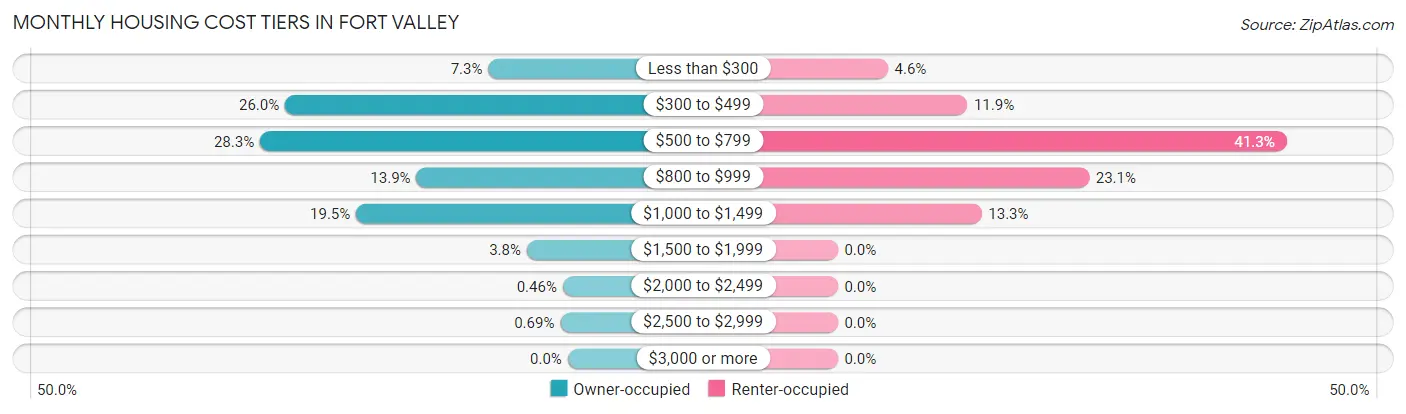
| Monthly Cost | Owner-occupied | Renter-occupied |
| Less than $300 | 95 (7.3%) | 84 (4.6%) |
| $300 to $499 | 338 (26.0%) | 217 (11.9%) |
| $500 to $799 | 368 (28.3%) | 752 (41.3%) |
| $800 to $999 | 181 (13.9%) | 421 (23.1%) |
| $1,000 to $1,499 | 253 (19.5%) | 241 (13.3%) |
| $1,500 to $1,999 | 49 (3.8%) | 0 (0.0%) |
| $2,000 to $2,499 | 6 (0.5%) | 0 (0.0%) |
| $2,500 to $2,999 | 9 (0.7%) | 0 (0.0%) |
| $3,000 or more | 0 (0.0%) | 0 (0.0%) |
| Total | 1,299 (100.0%) | 1,819 (100.0%) |
Physical Housing Characteristics in Fort Valley
Housing Structures in Fort Valley
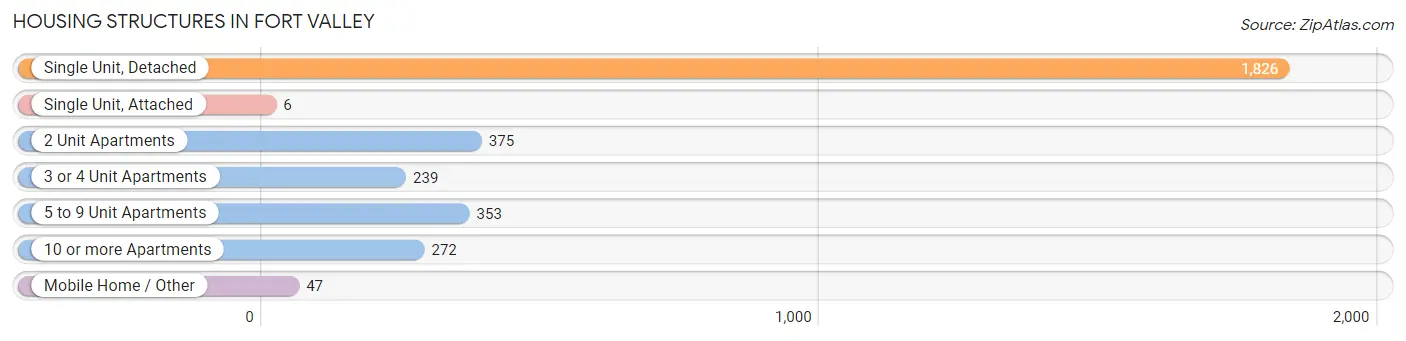
| Structure Type | # Housing Units | % Housing Units |
| Single Unit, Detached | 1,826 | 58.6% |
| Single Unit, Attached | 6 | 0.2% |
| 2 Unit Apartments | 375 | 12.0% |
| 3 or 4 Unit Apartments | 239 | 7.7% |
| 5 to 9 Unit Apartments | 353 | 11.3% |
| 10 or more Apartments | 272 | 8.7% |
| Mobile Home / Other | 47 | 1.5% |
| Total | 3,118 | 100.0% |
Housing Structures by Occupancy in Fort Valley
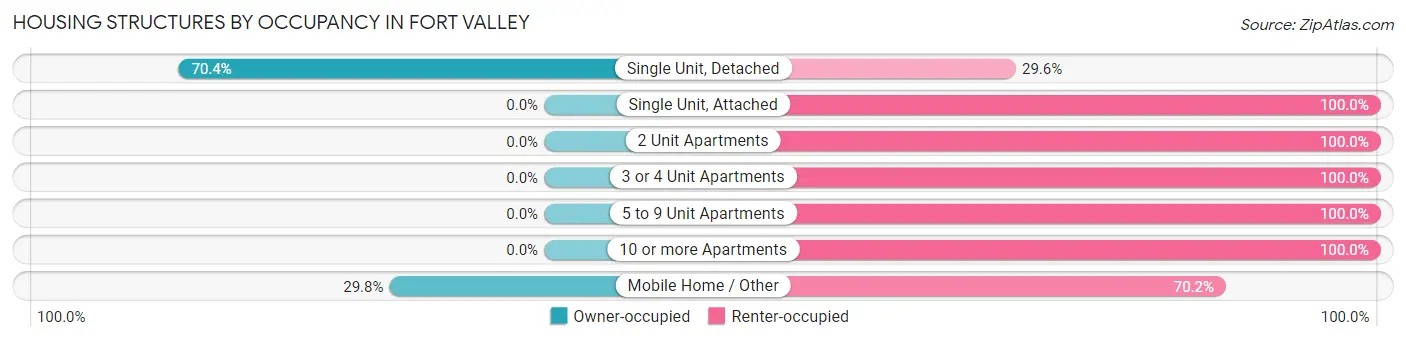
| Structure Type | Owner-occupied | Renter-occupied |
| Single Unit, Detached | 1,285 (70.4%) | 541 (29.6%) |
| Single Unit, Attached | 0 (0.0%) | 6 (100.0%) |
| 2 Unit Apartments | 0 (0.0%) | 375 (100.0%) |
| 3 or 4 Unit Apartments | 0 (0.0%) | 239 (100.0%) |
| 5 to 9 Unit Apartments | 0 (0.0%) | 353 (100.0%) |
| 10 or more Apartments | 0 (0.0%) | 272 (100.0%) |
| Mobile Home / Other | 14 (29.8%) | 33 (70.2%) |
| Total | 1,299 (41.7%) | 1,819 (58.3%) |
Housing Structures by Number of Rooms in Fort Valley
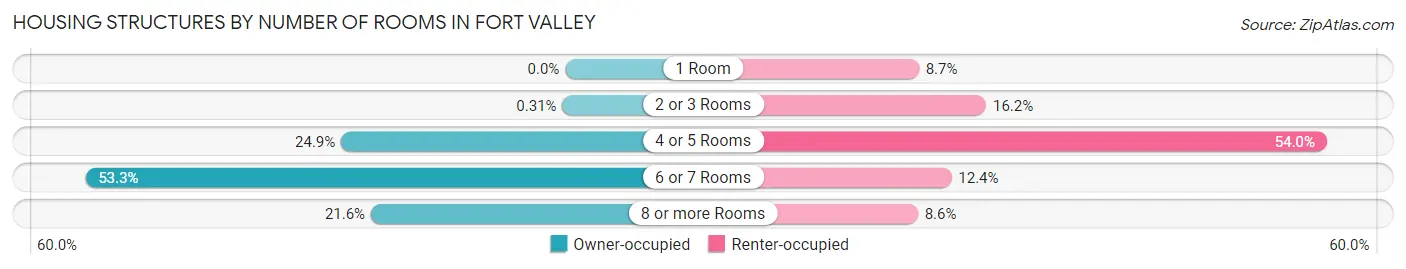
| Number of Rooms | Owner-occupied | Renter-occupied |
| 1 Room | 0 (0.0%) | 159 (8.7%) |
| 2 or 3 Rooms | 4 (0.3%) | 295 (16.2%) |
| 4 or 5 Rooms | 323 (24.9%) | 983 (54.0%) |
| 6 or 7 Rooms | 692 (53.3%) | 225 (12.4%) |
| 8 or more Rooms | 280 (21.6%) | 157 (8.6%) |
| Total | 1,299 (100.0%) | 1,819 (100.0%) |
Housing Structure by Heating Type in Fort Valley
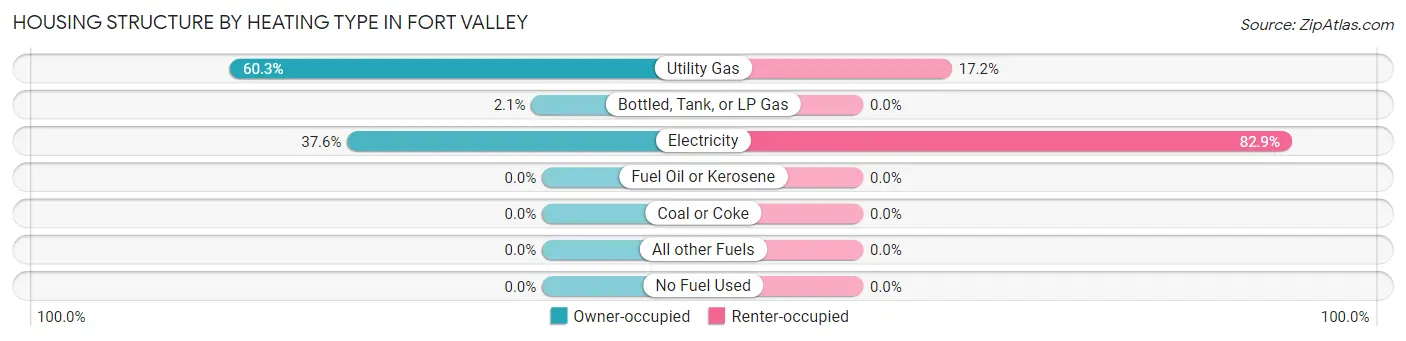
| Heating Type | Owner-occupied | Renter-occupied |
| Utility Gas | 783 (60.3%) | 312 (17.2%) |
| Bottled, Tank, or LP Gas | 27 (2.1%) | 0 (0.0%) |
| Electricity | 489 (37.6%) | 1,507 (82.9%) |
| Fuel Oil or Kerosene | 0 (0.0%) | 0 (0.0%) |
| Coal or Coke | 0 (0.0%) | 0 (0.0%) |
| All other Fuels | 0 (0.0%) | 0 (0.0%) |
| No Fuel Used | 0 (0.0%) | 0 (0.0%) |
| Total | 1,299 (100.0%) | 1,819 (100.0%) |
Household Vehicle Usage in Fort Valley
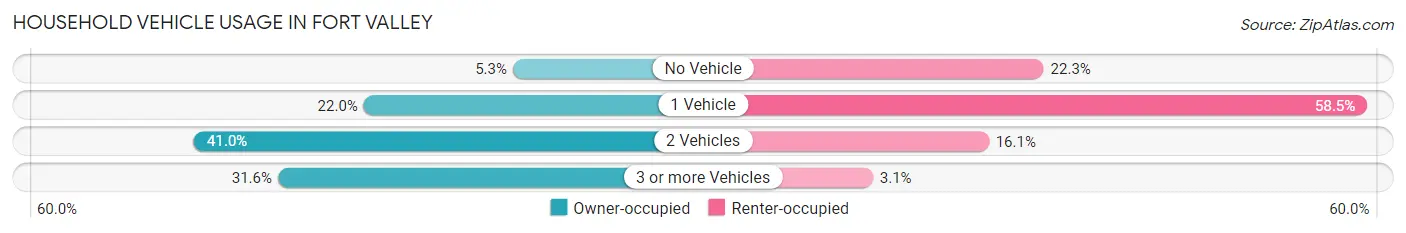
| Vehicles per Household | Owner-occupied | Renter-occupied |
| No Vehicle | 69 (5.3%) | 405 (22.3%) |
| 1 Vehicle | 286 (22.0%) | 1,064 (58.5%) |
| 2 Vehicles | 533 (41.0%) | 293 (16.1%) |
| 3 or more Vehicles | 411 (31.6%) | 57 (3.1%) |
| Total | 1,299 (100.0%) | 1,819 (100.0%) |
Real Estate & Mortgages in Fort Valley
Real Estate and Mortgage Overview in Fort Valley
| Characteristic | Without Mortgage | With Mortgage |
| Housing Units | 815 | 484 |
| Median Property Value | $116,300 | $97,600 |
| Median Household Income | $98,807 | $48 |
| Monthly Housing Costs | $482 | $0 |
| Real Estate Taxes | $1,376 | $42 |
Property Value by Mortgage Status in Fort Valley
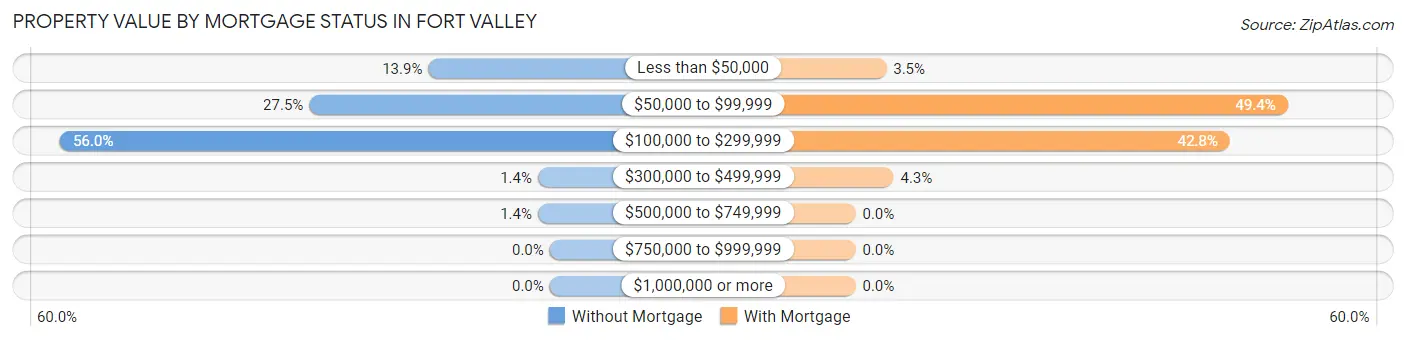
| Property Value | Without Mortgage | With Mortgage |
| Less than $50,000 | 113 (13.9%) | 17 (3.5%) |
| $50,000 to $99,999 | 224 (27.5%) | 239 (49.4%) |
| $100,000 to $299,999 | 456 (55.9%) | 207 (42.8%) |
| $300,000 to $499,999 | 11 (1.3%) | 21 (4.3%) |
| $500,000 to $749,999 | 11 (1.3%) | 0 (0.0%) |
| $750,000 to $999,999 | 0 (0.0%) | 0 (0.0%) |
| $1,000,000 or more | 0 (0.0%) | 0 (0.0%) |
| Total | 815 (100.0%) | 484 (100.0%) |
Household Income by Mortgage Status in Fort Valley
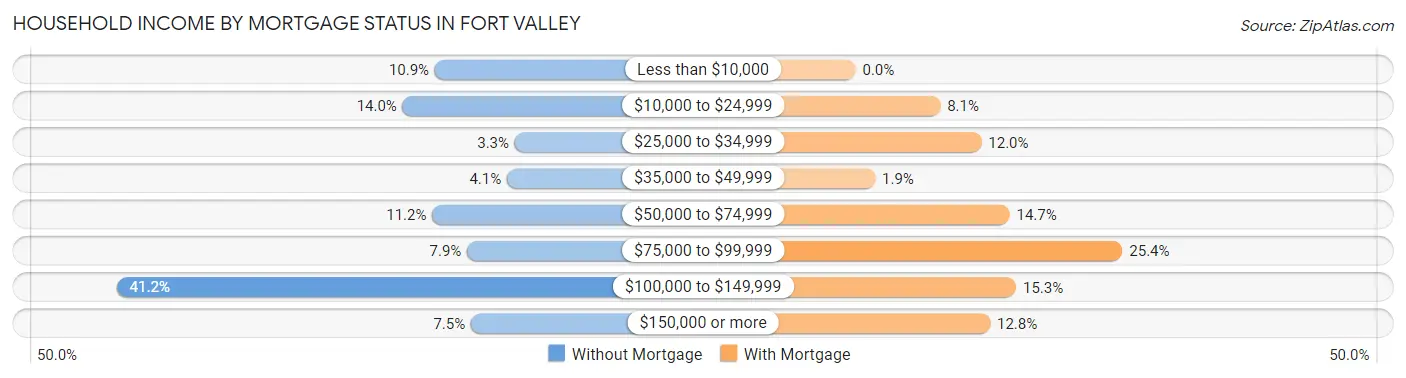
| Household Income | Without Mortgage | With Mortgage |
| Less than $10,000 | 89 (10.9%) | 0 (0.0%) |
| $10,000 to $24,999 | 114 (14.0%) | 39 (8.1%) |
| $25,000 to $34,999 | 27 (3.3%) | 58 (12.0%) |
| $35,000 to $49,999 | 33 (4.1%) | 9 (1.9%) |
| $50,000 to $74,999 | 91 (11.2%) | 71 (14.7%) |
| $75,000 to $99,999 | 64 (7.9%) | 123 (25.4%) |
| $100,000 to $149,999 | 336 (41.2%) | 74 (15.3%) |
| $150,000 or more | 61 (7.5%) | 62 (12.8%) |
| Total | 815 (100.0%) | 484 (100.0%) |
Property Value to Household Income Ratio in Fort Valley
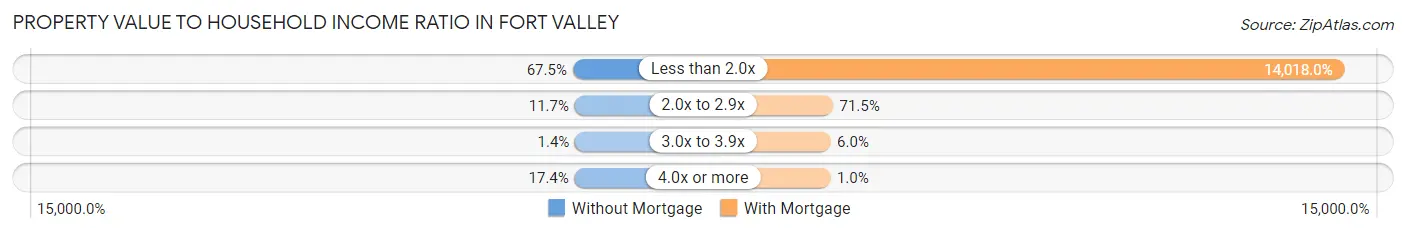
| Value-to-Income Ratio | Without Mortgage | With Mortgage |
| Less than 2.0x | 550 (67.5%) | 67,847 (14,018.0%) |
| 2.0x to 2.9x | 95 (11.7%) | 346 (71.5%) |
| 3.0x to 3.9x | 11 (1.3%) | 29 (6.0%) |
| 4.0x or more | 142 (17.4%) | 5 (1.0%) |
| Total | 815 (100.0%) | 484 (100.0%) |
Real Estate Taxes by Mortgage Status in Fort Valley
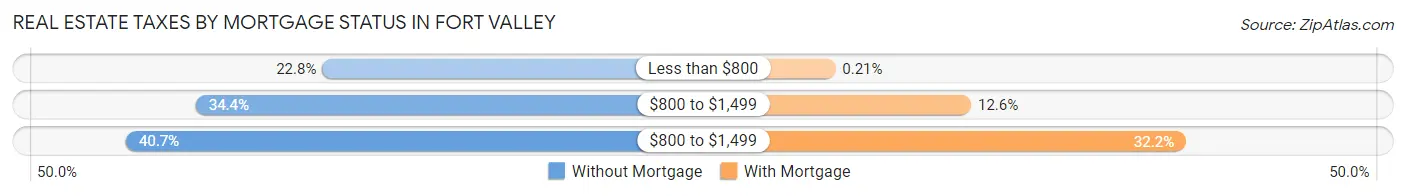
| Property Taxes | Without Mortgage | With Mortgage |
| Less than $800 | 186 (22.8%) | 1 (0.2%) |
| $800 to $1,499 | 280 (34.4%) | 61 (12.6%) |
| $800 to $1,499 | 332 (40.7%) | 156 (32.2%) |
| Total | 815 (100.0%) | 484 (100.0%) |
Health & Disability in Fort Valley
Health Insurance Coverage by Age in Fort Valley
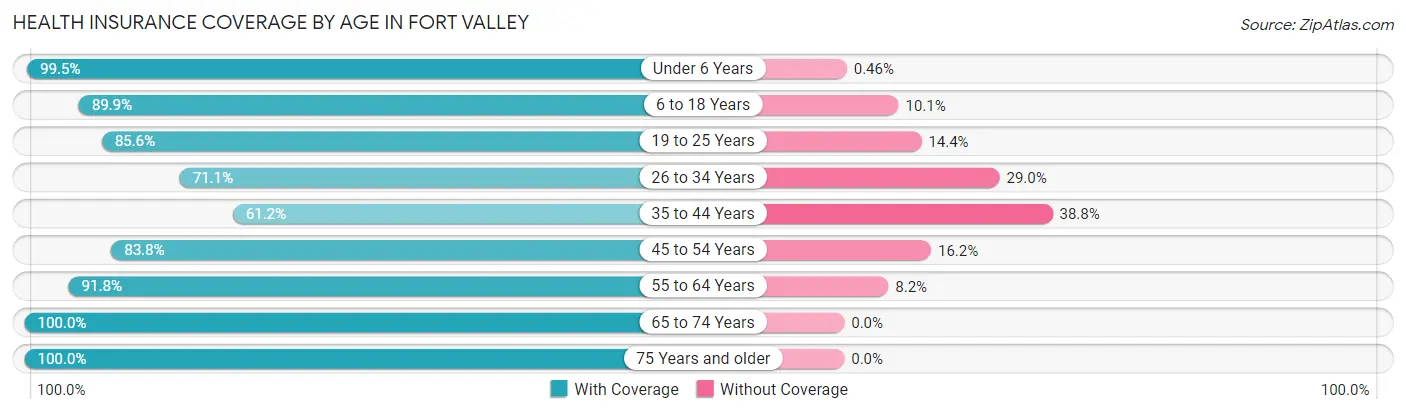
| Age Bracket | With Coverage | Without Coverage |
| Under 6 Years | 651 (99.5%) | 3 (0.5%) |
| 6 to 18 Years | 1,404 (89.9%) | 158 (10.1%) |
| 19 to 25 Years | 1,452 (85.6%) | 244 (14.4%) |
| 26 to 34 Years | 751 (71.1%) | 306 (28.9%) |
| 35 to 44 Years | 603 (61.2%) | 383 (38.8%) |
| 45 to 54 Years | 492 (83.8%) | 95 (16.2%) |
| 55 to 64 Years | 904 (91.8%) | 81 (8.2%) |
| 65 to 74 Years | 810 (100.0%) | 0 (0.0%) |
| 75 Years and older | 449 (100.0%) | 0 (0.0%) |
| Total | 7,516 (85.6%) | 1,270 (14.4%) |
Health Insurance Coverage by Citizenship Status in Fort Valley
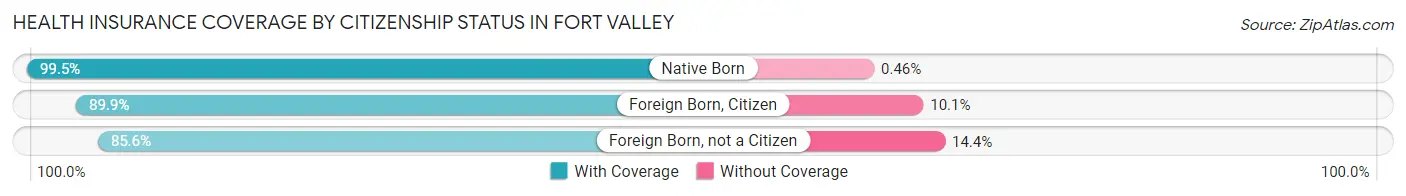
| Citizenship Status | With Coverage | Without Coverage |
| Native Born | 651 (99.5%) | 3 (0.5%) |
| Foreign Born, Citizen | 1,404 (89.9%) | 158 (10.1%) |
| Foreign Born, not a Citizen | 1,452 (85.6%) | 244 (14.4%) |
Health Insurance Coverage by Household Income in Fort Valley
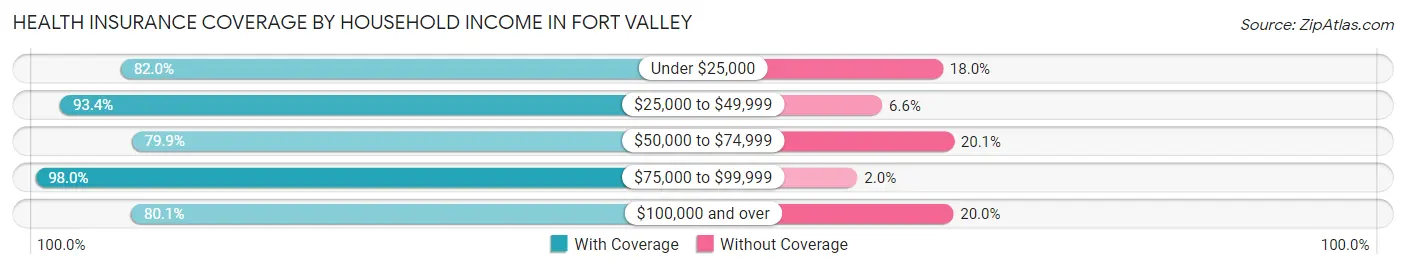
| Household Income | With Coverage | Without Coverage |
| Under $25,000 | 2,130 (82.0%) | 468 (18.0%) |
| $25,000 to $49,999 | 1,422 (93.4%) | 101 (6.6%) |
| $50,000 to $74,999 | 1,036 (79.9%) | 260 (20.1%) |
| $75,000 to $99,999 | 296 (98.0%) | 6 (2.0%) |
| $100,000 and over | 1,280 (80.0%) | 319 (20.0%) |
Public vs Private Health Insurance Coverage by Age in Fort Valley
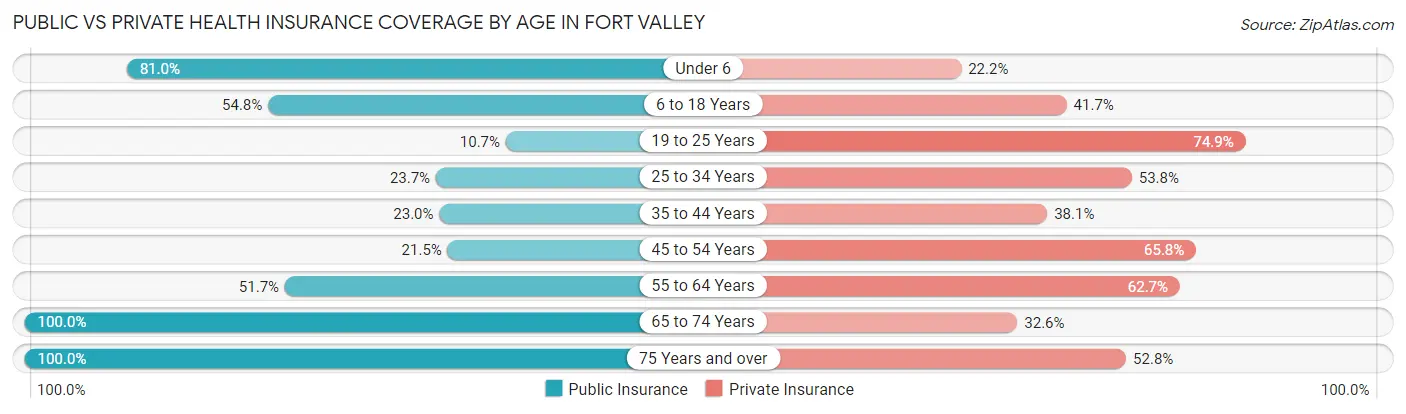
| Age Bracket | Public Insurance | Private Insurance |
| Under 6 | 530 (81.0%) | 145 (22.2%) |
| 6 to 18 Years | 856 (54.8%) | 652 (41.7%) |
| 19 to 25 Years | 181 (10.7%) | 1,271 (74.9%) |
| 25 to 34 Years | 250 (23.6%) | 569 (53.8%) |
| 35 to 44 Years | 227 (23.0%) | 376 (38.1%) |
| 45 to 54 Years | 126 (21.5%) | 386 (65.8%) |
| 55 to 64 Years | 509 (51.7%) | 618 (62.7%) |
| 65 to 74 Years | 810 (100.0%) | 264 (32.6%) |
| 75 Years and over | 449 (100.0%) | 237 (52.8%) |
| Total | 3,938 (44.8%) | 4,518 (51.4%) |
Disability Status by Sex by Age in Fort Valley
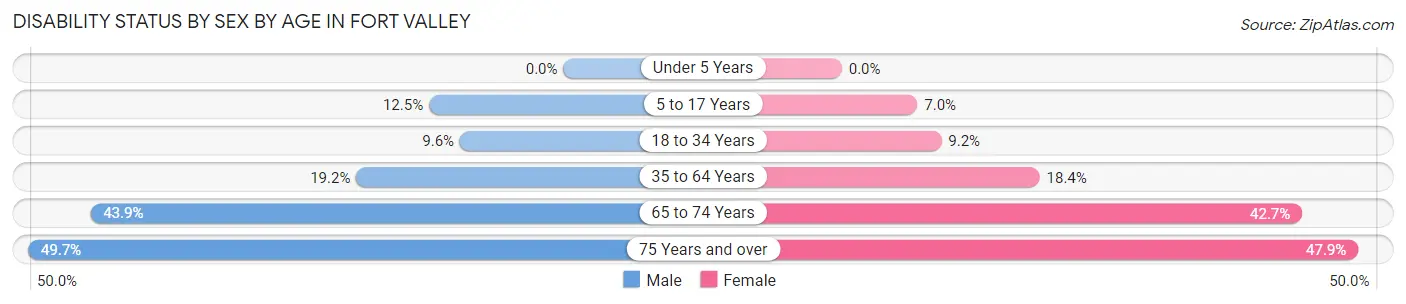
| Age Bracket | Male | Female |
| Under 5 Years | 0 (0.0%) | 0 (0.0%) |
| 5 to 17 Years | 60 (12.5%) | 40 (7.0%) |
| 18 to 34 Years | 162 (9.6%) | 157 (9.2%) |
| 35 to 64 Years | 231 (19.2%) | 249 (18.4%) |
| 65 to 74 Years | 220 (43.9%) | 132 (42.7%) |
| 75 Years and over | 80 (49.7%) | 138 (47.9%) |
Disability Class by Sex by Age in Fort Valley
Disability Class: Hearing Difficulty
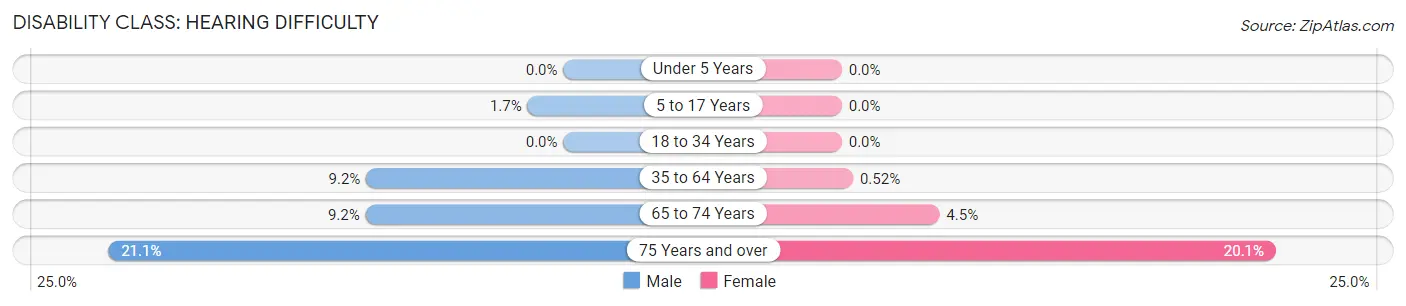
| Age Bracket | Male | Female |
| Under 5 Years | 0 (0.0%) | 0 (0.0%) |
| 5 to 17 Years | 8 (1.7%) | 0 (0.0%) |
| 18 to 34 Years | 0 (0.0%) | 0 (0.0%) |
| 35 to 64 Years | 110 (9.1%) | 7 (0.5%) |
| 65 to 74 Years | 46 (9.2%) | 14 (4.5%) |
| 75 Years and over | 34 (21.1%) | 58 (20.1%) |
Disability Class: Vision Difficulty
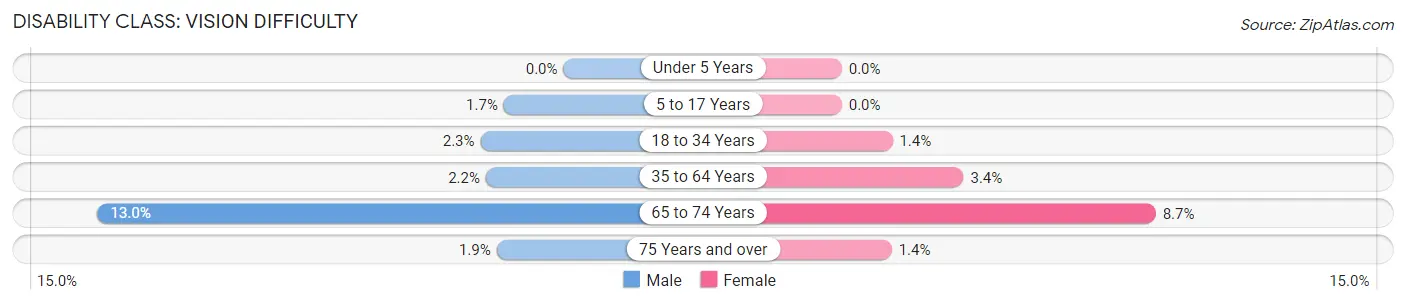
| Age Bracket | Male | Female |
| Under 5 Years | 0 (0.0%) | 0 (0.0%) |
| 5 to 17 Years | 8 (1.7%) | 0 (0.0%) |
| 18 to 34 Years | 39 (2.3%) | 24 (1.4%) |
| 35 to 64 Years | 26 (2.2%) | 46 (3.4%) |
| 65 to 74 Years | 65 (13.0%) | 27 (8.7%) |
| 75 Years and over | 3 (1.9%) | 4 (1.4%) |
Disability Class: Cognitive Difficulty
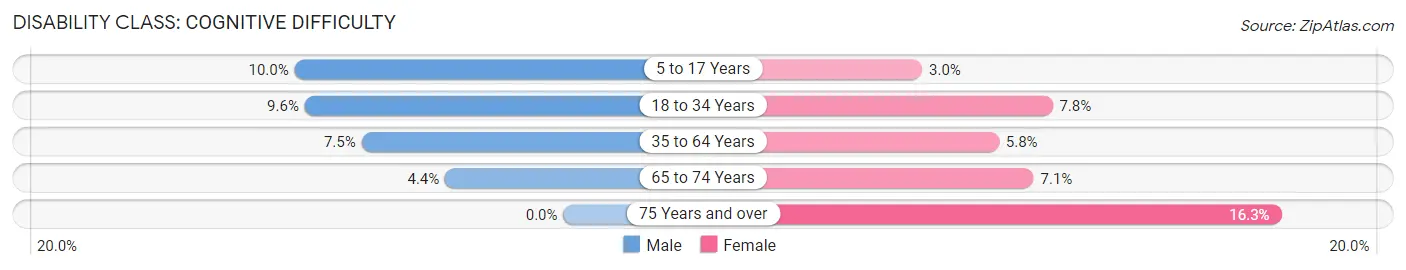
| Age Bracket | Male | Female |
| 5 to 17 Years | 48 (10.0%) | 17 (3.0%) |
| 18 to 34 Years | 162 (9.6%) | 133 (7.8%) |
| 35 to 64 Years | 90 (7.5%) | 79 (5.8%) |
| 65 to 74 Years | 22 (4.4%) | 22 (7.1%) |
| 75 Years and over | 0 (0.0%) | 47 (16.3%) |
Disability Class: Ambulatory Difficulty
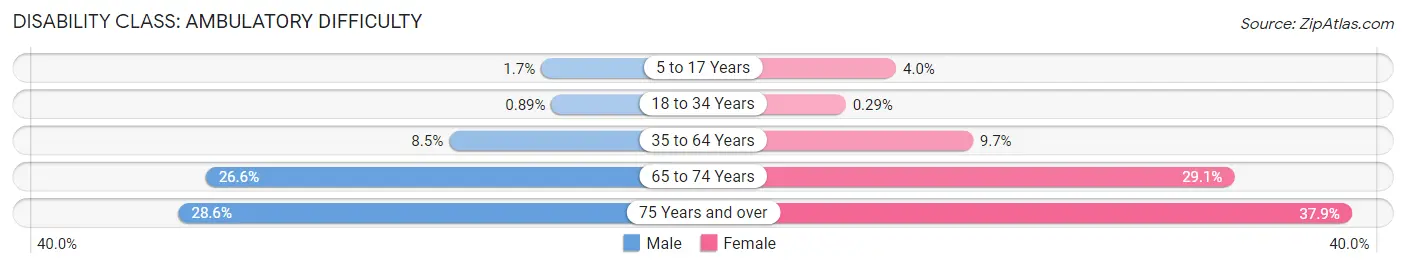
| Age Bracket | Male | Female |
| 5 to 17 Years | 8 (1.7%) | 23 (4.0%) |
| 18 to 34 Years | 15 (0.9%) | 5 (0.3%) |
| 35 to 64 Years | 102 (8.5%) | 132 (9.7%) |
| 65 to 74 Years | 133 (26.6%) | 90 (29.1%) |
| 75 Years and over | 46 (28.6%) | 109 (37.9%) |
Disability Class: Self-Care Difficulty
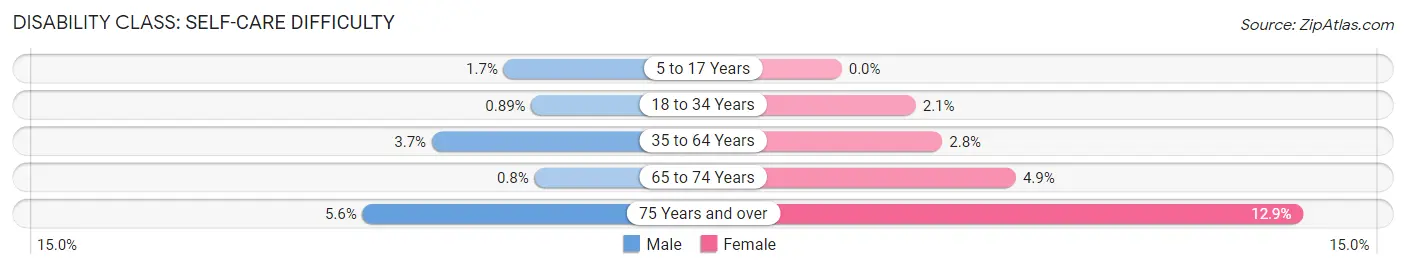
| Age Bracket | Male | Female |
| 5 to 17 Years | 8 (1.7%) | 0 (0.0%) |
| 18 to 34 Years | 15 (0.9%) | 35 (2.1%) |
| 35 to 64 Years | 44 (3.7%) | 38 (2.8%) |
| 65 to 74 Years | 4 (0.8%) | 15 (4.9%) |
| 75 Years and over | 9 (5.6%) | 37 (12.9%) |
Technology Access in Fort Valley
Computing Device Access in Fort Valley
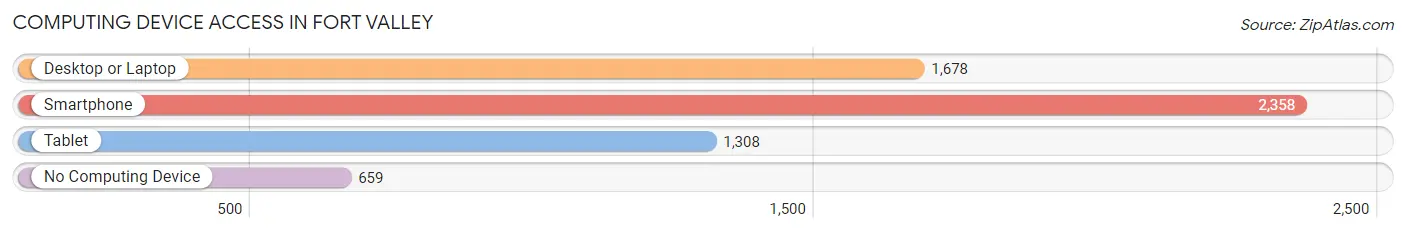
| Device Type | # Households | % Households |
| Desktop or Laptop | 1,678 | 53.8% |
| Smartphone | 2,358 | 75.6% |
| Tablet | 1,308 | 41.9% |
| No Computing Device | 659 | 21.1% |
| Total | 3,118 | 100.0% |
Internet Access in Fort Valley
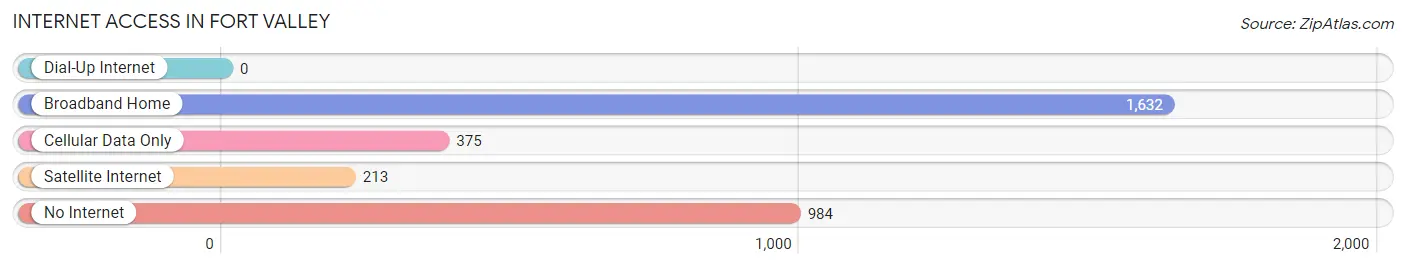
| Internet Type | # Households | % Households |
| Dial-Up Internet | 0 | 0.0% |
| Broadband Home | 1,632 | 52.3% |
| Cellular Data Only | 375 | 12.0% |
| Satellite Internet | 213 | 6.8% |
| No Internet | 984 | 31.6% |
| Total | 3,118 | 100.0% |
Fort Valley Summary
Valley, Georgia is a small city located in Peach County, Georgia. It is part of the Macon Metropolitan Statistical Area and is located approximately 30 miles south of Macon. The city has a population of approximately 9,000 people and is the county seat of Peach County.
History
Valley was founded in 1856 by the Georgia General Assembly as the county seat of Peach County. The city was named after the nearby Fort Valley, which was a military post during the Creek War of 1836. The city was incorporated in 1872 and has remained the county seat ever since.
The city was an important center for the cotton industry in the late 19th and early 20th centuries. The city was also home to a number of prominent businesses, including the Valley Manufacturing Company, which was founded in 1887 and produced cotton gins and other agricultural equipment.
Geography
Valley is located in the central part of Peach County, approximately 30 miles south of Macon. The city is situated in the Flint River Valley, which is part of the larger Ocmulgee River Valley. The city is located at an elevation of approximately 500 feet above sea level.
The city has a total area of 4.3 square miles, all of which is land. The city is located in a humid subtropical climate zone and experiences hot, humid summers and mild winters.
Economy
Valley’s economy is largely based on agriculture and manufacturing. The city is home to a number of agricultural businesses, including cotton gins, feed mills, and poultry processing plants. The city is also home to a number of manufacturing businesses, including a furniture factory, a plastics factory, and a paper mill.
The city is also home to a number of retail businesses, including a Walmart Supercenter, a Lowe’s Home Improvement store, and a number of restaurants and other small businesses.
Demographics
As of the 2010 census, Valley had a population of 8,945 people. The racial makeup of the city was 57.3% White, 37.2% African American, 0.3% Native American, 0.7% Asian, 0.1% Pacific Islander, and 4.4% from other races. Hispanic or Latino of any race were 2.2% of the population.
The median household income in Valley was $30,945, and the median family income was $37,917. The per capita income for the city was $17,845. About 17.2% of families and 20.3% of the population were below the poverty line, including 28.2% of those under age 18 and 16.2% of those age 65 or over.
Common Questions
What is Per Capita Income in Fort Valley?
Per Capita income in Fort Valley is $23,406.
What is the Median Family Income in Fort Valley?
Median Family Income in Fort Valley is $49,643.
What is the Median Household income in Fort Valley?
Median Household Income in Fort Valley is $31,807.
What is Income or Wage Gap in Fort Valley?
Income or Wage Gap in Fort Valley is 50.5%.
Women in Fort Valley earn 49.5 cents for every dollar earned by a man.
What is Family Income Deficit in Fort Valley?
Family Income Deficit in Fort Valley is $12,600.
Families that are below poverty line in Fort Valley earn $12,600 less on average than the poverty threshold level.
What is Inequality or Gini Index in Fort Valley?
Inequality or Gini Index in Fort Valley is 0.53.
What is the Total Population of Fort Valley?
Total Population of Fort Valley is 8,821.
What is the Total Male Population of Fort Valley?
Total Male Population of Fort Valley is 4,331.
What is the Total Female Population of Fort Valley?
Total Female Population of Fort Valley is 4,490.
What is the Ratio of Males per 100 Females in Fort Valley?
There are 96.46 Males per 100 Females in Fort Valley.
What is the Ratio of Females per 100 Males in Fort Valley?
There are 103.67 Females per 100 Males in Fort Valley.
What is the Median Population Age in Fort Valley?
Median Population Age in Fort Valley is 30.6 Years.
What is the Average Family Size in Fort Valley
Average Family Size in Fort Valley is 3.1 People.
What is the Average Household Size in Fort Valley
Average Household Size in Fort Valley is 2.4 People.
How Large is the Labor Force in Fort Valley?
There are 3,603 People in the Labor Forcein in Fort Valley.
What is the Percentage of People in the Labor Force in Fort Valley?
48.8% of People are in the Labor Force in Fort Valley.
What is the Unemployment Rate in Fort Valley?
Unemployment Rate in Fort Valley is 9.4%.