Irwinton, GA Map & Demographics
Irwinton Map
Irwinton Overview
$22,744
PER CAPITA INCOME
$70,972
AVG FAMILY INCOME
$33,929
AVG HOUSEHOLD INCOME
19.0%
WAGE / INCOME GAP [ % ]
81.0¢/ $1
WAGE / INCOME GAP [ $ ]
0.46
INEQUALITY / GINI INDEX
572
TOTAL POPULATION
209
MALE POPULATION
363
FEMALE POPULATION
57.58
MALES / 100 FEMALES
173.68
FEMALES / 100 MALES
40.3
MEDIAN AGE
4.7
AVG FAMILY SIZE
2.7
AVG HOUSEHOLD SIZE
304
LABOR FORCE [ PEOPLE ]
64.3%
PERCENT IN LABOR FORCE
11.5%
UNEMPLOYMENT RATE
Irwinton Zip Codes
Irwinton Area Codes
Income in Irwinton
Income Overview in Irwinton
Per Capita Income in Irwinton is $22,744, while median incomes of families and households are $70,972 and $33,929 respectively.
| Characteristic | Number | Measure |
| Per Capita Income | 572 | $22,744 |
| Median Family Income | 93 | $70,972 |
| Mean Family Income | 93 | $87,423 |
| Median Household Income | 204 | $33,929 |
| Mean Household Income | 204 | $51,582 |
| Income Deficit | 93 | $0 |
| Wage / Income Gap (%) | 572 | 18.99% |
| Wage / Income Gap ($) | 572 | 81.01¢ per $1 |
| Gini / Inequality Index | 572 | 0.46 |
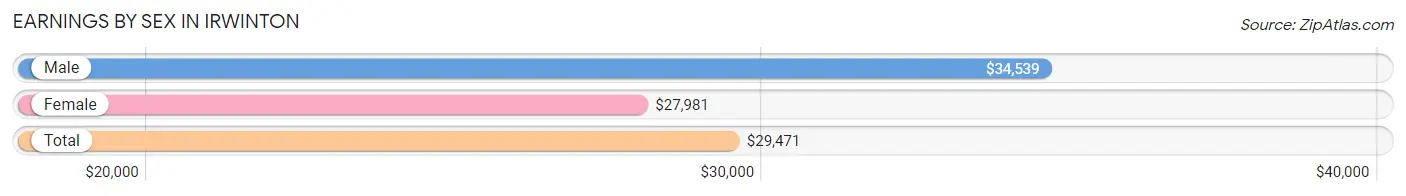
Earnings by Sex in Irwinton
Average Earnings in Irwinton are $29,471, $34,539 for men and $27,981 for women, a difference of 19.0%.
| Sex | Number | Average Earnings |
| Male | 77 (25.9%) | $34,539 |
| Female | 220 (74.1%) | $27,981 |
| Total | 297 (100.0%) | $29,471 |
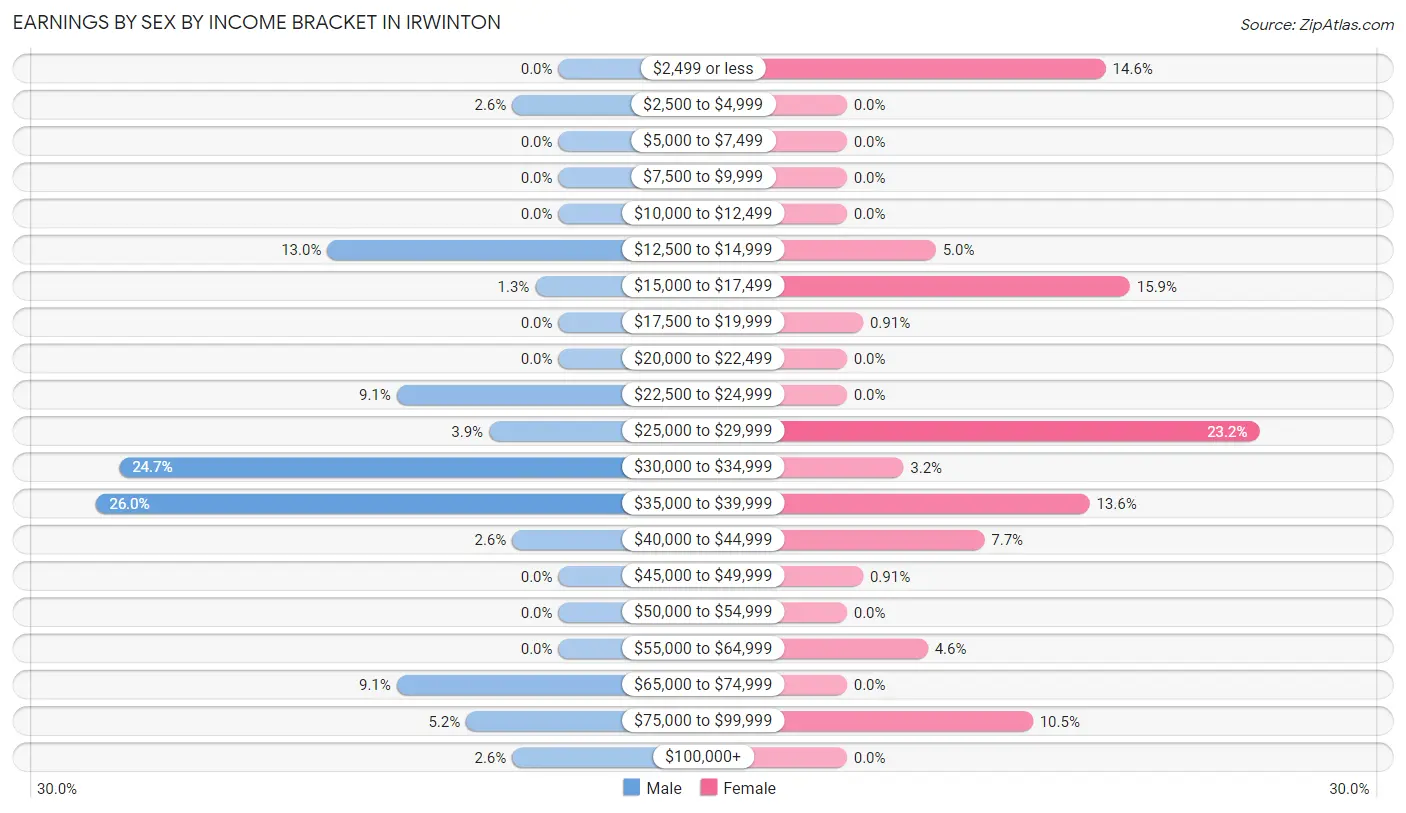
Earnings by Sex by Income Bracket in Irwinton
The most common earnings brackets in Irwinton are $35,000 to $39,999 for men (20 | 26.0%) and $25,000 to $29,999 for women (51 | 23.2%).
| Income | Male | Female |
| $2,499 or less | 0 (0.0%) | 32 (14.5%) |
| $2,500 to $4,999 | 2 (2.6%) | 0 (0.0%) |
| $5,000 to $7,499 | 0 (0.0%) | 0 (0.0%) |
| $7,500 to $9,999 | 0 (0.0%) | 0 (0.0%) |
| $10,000 to $12,499 | 0 (0.0%) | 0 (0.0%) |
| $12,500 to $14,999 | 10 (13.0%) | 11 (5.0%) |
| $15,000 to $17,499 | 1 (1.3%) | 35 (15.9%) |
| $17,500 to $19,999 | 0 (0.0%) | 2 (0.9%) |
| $20,000 to $22,499 | 0 (0.0%) | 0 (0.0%) |
| $22,500 to $24,999 | 7 (9.1%) | 0 (0.0%) |
| $25,000 to $29,999 | 3 (3.9%) | 51 (23.2%) |
| $30,000 to $34,999 | 19 (24.7%) | 7 (3.2%) |
| $35,000 to $39,999 | 20 (26.0%) | 30 (13.6%) |
| $40,000 to $44,999 | 2 (2.6%) | 17 (7.7%) |
| $45,000 to $49,999 | 0 (0.0%) | 2 (0.9%) |
| $50,000 to $54,999 | 0 (0.0%) | 0 (0.0%) |
| $55,000 to $64,999 | 0 (0.0%) | 10 (4.5%) |
| $65,000 to $74,999 | 7 (9.1%) | 0 (0.0%) |
| $75,000 to $99,999 | 4 (5.2%) | 23 (10.4%) |
| $100,000+ | 2 (2.6%) | 0 (0.0%) |
| Total | 77 (100.0%) | 220 (100.0%) |
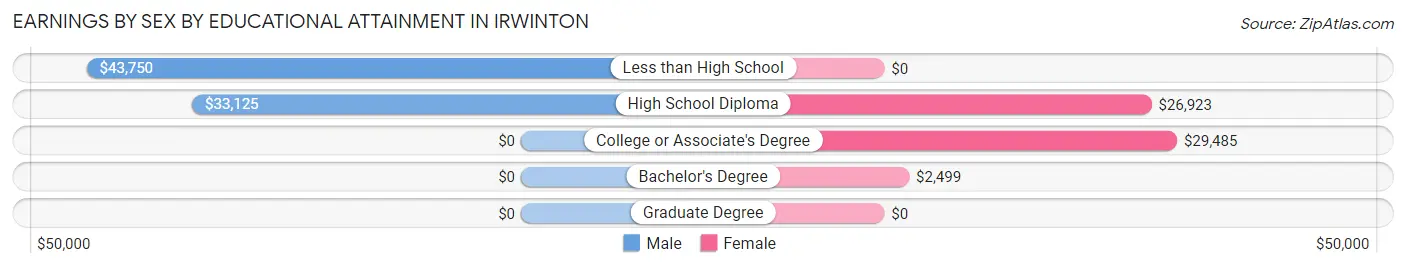
Earnings by Sex by Educational Attainment in Irwinton
Average earnings in Irwinton are $34,792 for men and $27,981 for women, a difference of 19.6%. Men with an educational attainment of less than high school enjoy the highest average annual earnings of $43,750, while those with high school diploma education earn the least with $33,125. Women with an educational attainment of college or associate's degree earn the most with the average annual earnings of $29,485, while those with bachelor's degree education have the smallest earnings of $2,499.
| Educational Attainment | Male Income | Female Income |
| Less than High School | $43,750 | $0 |
| High School Diploma | $33,125 | $26,923 |
| College or Associate's Degree | - | - |
| Bachelor's Degree | - | - |
| Graduate Degree | - | - |
| Total | $34,792 | $27,981 |
Family Income in Irwinton
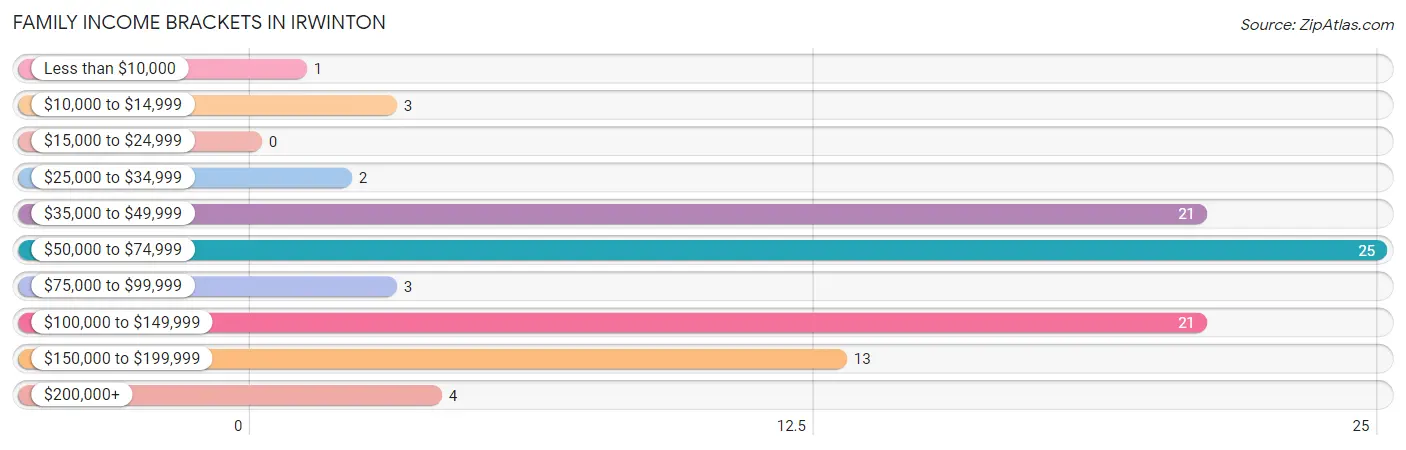
Family Income Brackets in Irwinton
According to the Irwinton family income data, there are 25 families falling into the $50,000 to $74,999 income range, which is the most common income bracket and makes up 26.9% of all families.
| Income Bracket | # Families | % Families |
| Less than $10,000 | 1 | 1.1% |
| $10,000 to $14,999 | 3 | 3.2% |
| $15,000 to $24,999 | 0 | 0.0% |
| $25,000 to $34,999 | 2 | 2.2% |
| $35,000 to $49,999 | 21 | 22.6% |
| $50,000 to $74,999 | 25 | 26.9% |
| $75,000 to $99,999 | 3 | 3.2% |
| $100,000 to $149,999 | 21 | 22.6% |
| $150,000 to $199,999 | 13 | 14.0% |
| $200,000+ | 4 | 4.3% |
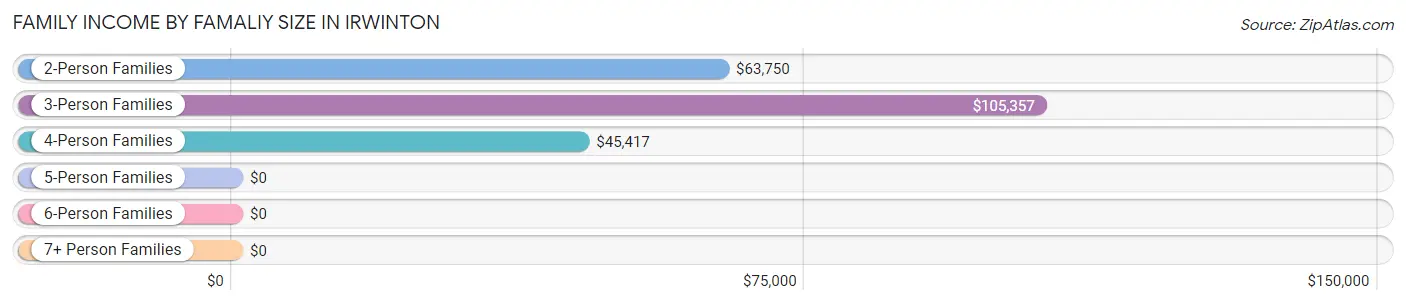
Family Income by Famaliy Size in Irwinton
3-person families (38 | 40.9%) account for the highest median family income in Irwinton with $105,357 per family, while 3-person families (38 | 40.9%) have the highest median income of $35,119 per family member.
| Income Bracket | # Families | Median Income |
| 2-Person Families | 20 (21.5%) | $63,750 |
| 3-Person Families | 38 (40.9%) | $105,357 |
| 4-Person Families | 28 (30.1%) | $45,417 |
| 5-Person Families | 7 (7.5%) | $0 |
| 6-Person Families | 0 (0.0%) | $0 |
| 7+ Person Families | 0 (0.0%) | $0 |
| Total | 93 (100.0%) | $70,972 |
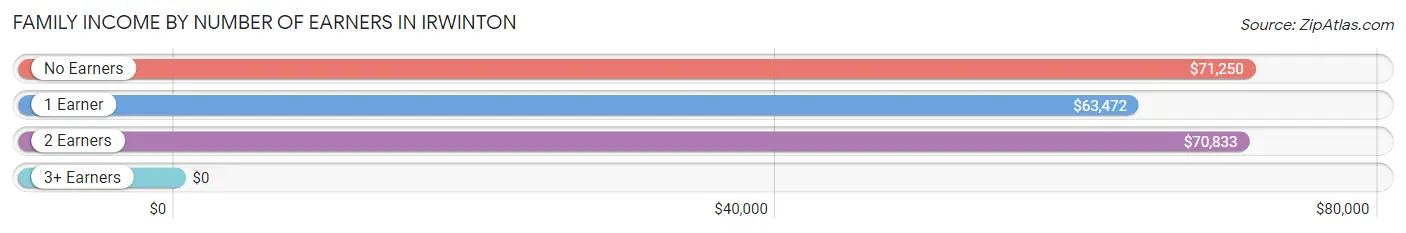
Family Income by Number of Earners in Irwinton
| Number of Earners | # Families | Median Income |
| No Earners | 6 (6.5%) | $71,250 |
| 1 Earner | 27 (29.0%) | $63,472 |
| 2 Earners | 48 (51.6%) | $70,833 |
| 3+ Earners | 12 (12.9%) | $0 |
| Total | 93 (100.0%) | $70,972 |
Household Income in Irwinton
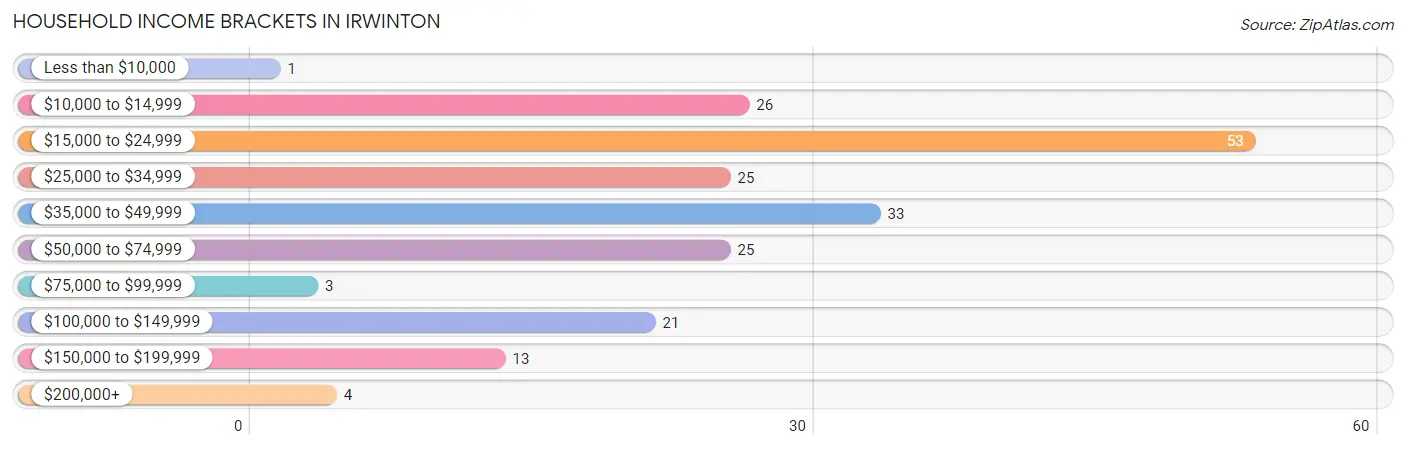
Household Income Brackets in Irwinton
With 53 households falling in the category, the $15,000 to $24,999 income range is the most frequent in Irwinton, accounting for 26.0% of all households. In contrast, only 1 households (0.5%) fall into the less than $10,000 income bracket, making it the least populous group.
| Income Bracket | # Households | % Households |
| Less than $10,000 | 1 | 0.5% |
| $10,000 to $14,999 | 26 | 12.7% |
| $15,000 to $24,999 | 53 | 26.0% |
| $25,000 to $34,999 | 25 | 12.3% |
| $35,000 to $49,999 | 33 | 16.2% |
| $50,000 to $74,999 | 25 | 12.3% |
| $75,000 to $99,999 | 3 | 1.5% |
| $100,000 to $149,999 | 21 | 10.3% |
| $150,000 to $199,999 | 13 | 6.4% |
| $200,000+ | 4 | 2.0% |
Household Income by Householder Age in Irwinton
The median household income in Irwinton is $33,929, with the highest median household income of $45,208 found in the 45 to 64 years age bracket for the primary householder. A total of 122 households (59.8%) fall into this category.
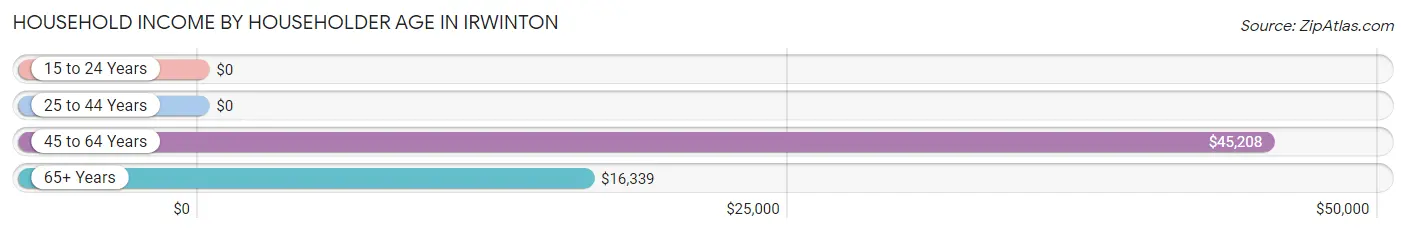
| Income Bracket | # Households | Median Income |
| 15 to 24 Years | 0 (0.0%) | $0 |
| 25 to 44 Years | 21 (10.3%) | $0 |
| 45 to 64 Years | 122 (59.8%) | $45,208 |
| 65+ Years | 61 (29.9%) | $16,339 |
| Total | 204 (100.0%) | $33,929 |
Poverty in Irwinton
Income Below Poverty by Sex and Age in Irwinton
With 7.8% poverty level for males and 10.4% for females among the residents of Irwinton, 12 to 14 year old males and 65 to 74 year old females are the most vulnerable to poverty, with 6 males (100.0%) and 14 females (22.6%) in their respective age groups living below the poverty level.
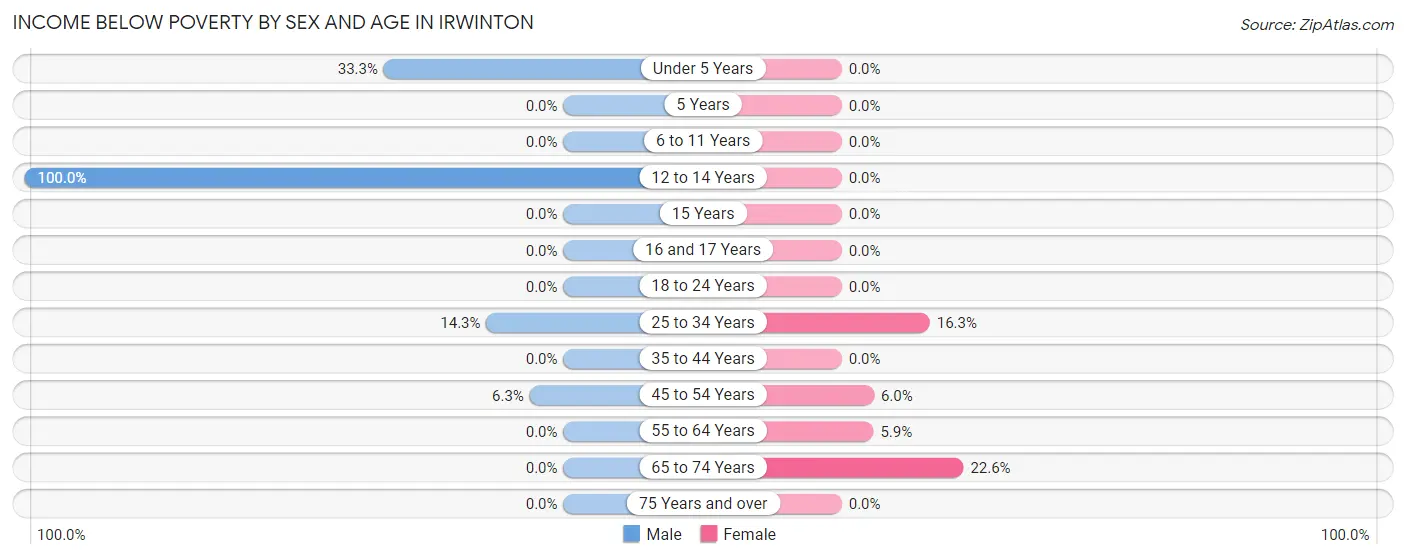
| Age Bracket | Male | Female |
| Under 5 Years | 6 (33.3%) | 0 (0.0%) |
| 5 Years | 0 (0.0%) | 0 (0.0%) |
| 6 to 11 Years | 0 (0.0%) | 0 (0.0%) |
| 12 to 14 Years | 6 (100.0%) | 0 (0.0%) |
| 15 Years | 0 (0.0%) | 0 (0.0%) |
| 16 and 17 Years | 0 (0.0%) | 0 (0.0%) |
| 18 to 24 Years | 0 (0.0%) | 0 (0.0%) |
| 25 to 34 Years | 2 (14.3%) | 16 (16.3%) |
| 35 to 44 Years | 0 (0.0%) | 0 (0.0%) |
| 45 to 54 Years | 1 (6.2%) | 4 (6.0%) |
| 55 to 64 Years | 0 (0.0%) | 3 (5.9%) |
| 65 to 74 Years | 0 (0.0%) | 14 (22.6%) |
| 75 Years and over | 0 (0.0%) | 0 (0.0%) |
| Total | 15 (7.8%) | 37 (10.4%) |
Income Above Poverty by Sex and Age in Irwinton
According to the poverty statistics in Irwinton, males aged 6 to 11 years and females aged under 5 years are the age groups that are most secure financially, with 100.0% of males and 100.0% of females in these age groups living above the poverty line.
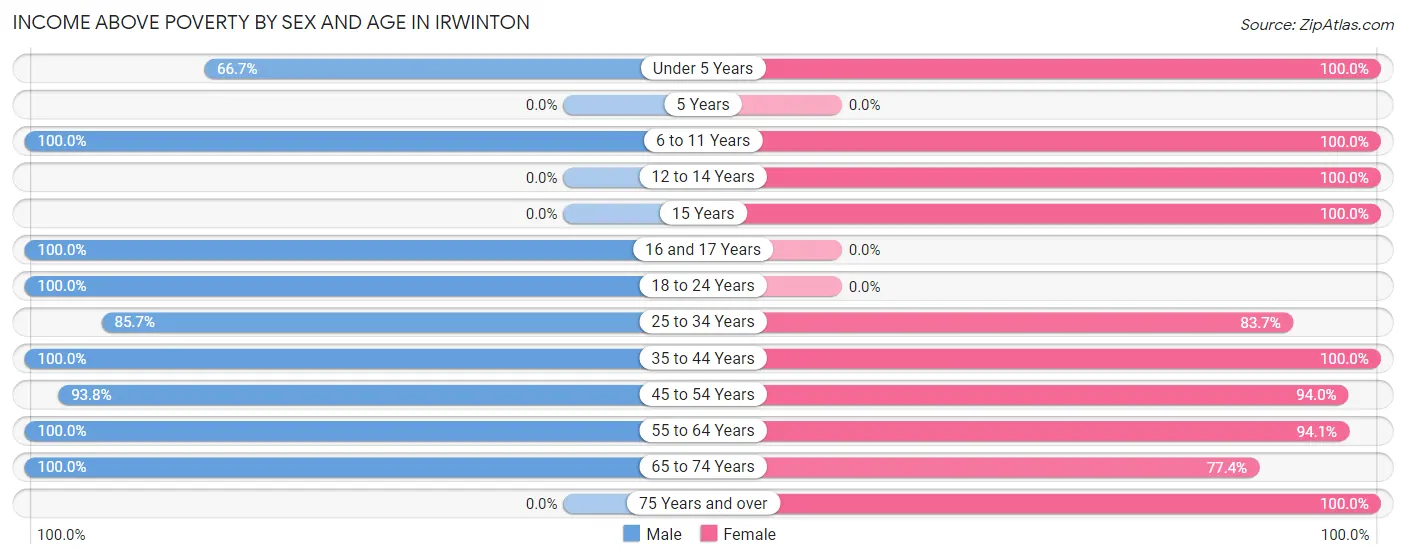
| Age Bracket | Male | Female |
| Under 5 Years | 12 (66.7%) | 16 (100.0%) |
| 5 Years | 0 (0.0%) | 0 (0.0%) |
| 6 to 11 Years | 20 (100.0%) | 9 (100.0%) |
| 12 to 14 Years | 0 (0.0%) | 6 (100.0%) |
| 15 Years | 0 (0.0%) | 24 (100.0%) |
| 16 and 17 Years | 16 (100.0%) | 0 (0.0%) |
| 18 to 24 Years | 34 (100.0%) | 0 (0.0%) |
| 25 to 34 Years | 12 (85.7%) | 82 (83.7%) |
| 35 to 44 Years | 26 (100.0%) | 7 (100.0%) |
| 45 to 54 Years | 15 (93.8%) | 63 (94.0%) |
| 55 to 64 Years | 31 (100.0%) | 48 (94.1%) |
| 65 to 74 Years | 11 (100.0%) | 48 (77.4%) |
| 75 Years and over | 0 (0.0%) | 16 (100.0%) |
| Total | 177 (92.2%) | 319 (89.6%) |
Income Below Poverty Among Married-Couple Families in Irwinton
The poverty statistics for married-couple families in Irwinton show that 2.6% or 1 of the total 39 families live below the poverty line. Families with no children have the highest poverty rate of 5.9%, comprising of 1 families. On the other hand, families with 1 or 2 children have the lowest poverty rate of 0.0%, which includes 0 families.
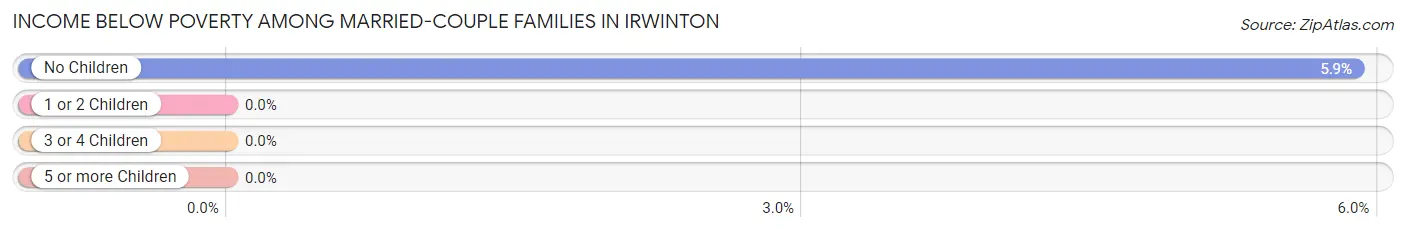
| Children | Above Poverty | Below Poverty |
| No Children | 16 (94.1%) | 1 (5.9%) |
| 1 or 2 Children | 22 (100.0%) | 0 (0.0%) |
| 3 or 4 Children | 0 (0.0%) | 0 (0.0%) |
| 5 or more Children | 0 (0.0%) | 0 (0.0%) |
| Total | 38 (97.4%) | 1 (2.6%) |
Income Below Poverty Among Single-Parent Households in Irwinton
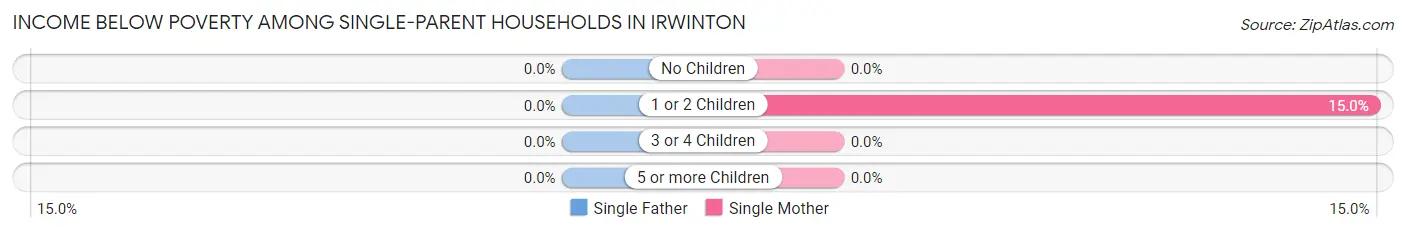
| Children | Single Father | Single Mother |
| No Children | 0 (0.0%) | 0 (0.0%) |
| 1 or 2 Children | 0 (0.0%) | 3 (15.0%) |
| 3 or 4 Children | 0 (0.0%) | 0 (0.0%) |
| 5 or more Children | 0 (0.0%) | 0 (0.0%) |
| Total | 0 (0.0%) | 3 (6.0%) |
Income Below Poverty Among Married-Couple vs Single-Parent Households in Irwinton
The poverty data for Irwinton shows that 1 of the married-couple family households (2.6%) and 3 of the single-parent households (5.6%) are living below the poverty level. Within the married-couple family households, those with no children have the highest poverty rate, with 1 households (5.9%) falling below the poverty line. Among the single-parent households, those with 1 or 2 children have the highest poverty rate, with 3 household (12.5%) living below poverty.
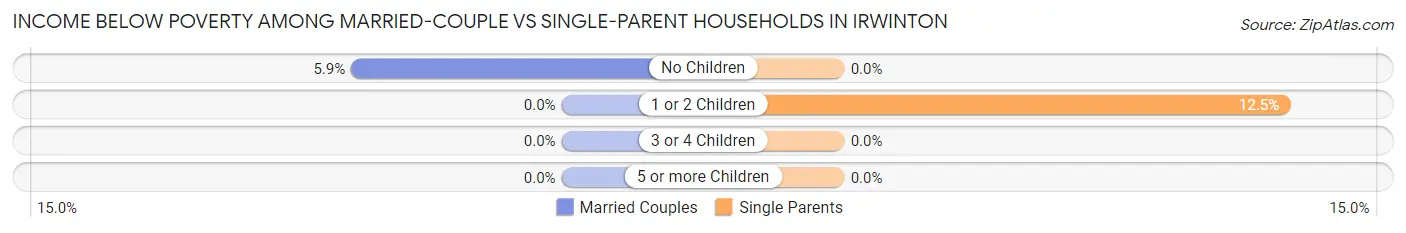
| Children | Married-Couple Families | Single-Parent Households |
| No Children | 1 (5.9%) | 0 (0.0%) |
| 1 or 2 Children | 0 (0.0%) | 3 (12.5%) |
| 3 or 4 Children | 0 (0.0%) | 0 (0.0%) |
| 5 or more Children | 0 (0.0%) | 0 (0.0%) |
| Total | 1 (2.6%) | 3 (5.6%) |
Race in Irwinton
The most populous races in Irwinton are Black / African American (408 | 71.3%), White / Caucasian (131 | 22.9%), and Two or more Races (33 | 5.8%).
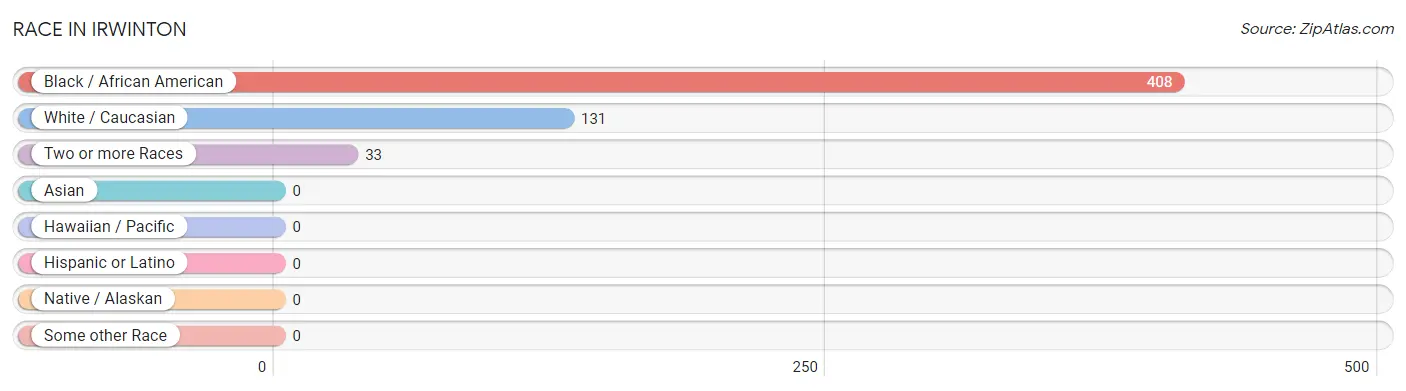
| Race | # Population | % Population |
| Asian | 0 | 0.0% |
| Black / African American | 408 | 71.3% |
| Hawaiian / Pacific | 0 | 0.0% |
| Hispanic or Latino | 0 | 0.0% |
| Native / Alaskan | 0 | 0.0% |
| White / Caucasian | 131 | 22.9% |
| Two or more Races | 33 | 5.8% |
| Some other Race | 0 | 0.0% |
| Total | 572 | 100.0% |
Ancestry in Irwinton
The most populous ancestries reported in Irwinton are American (32 | 5.6%), Canadian (28 | 4.9%), English (23 | 4.0%), Jamaican (16 | 2.8%), and Hungarian (12 | 2.1%), together accounting for 19.4% of all Irwinton residents.
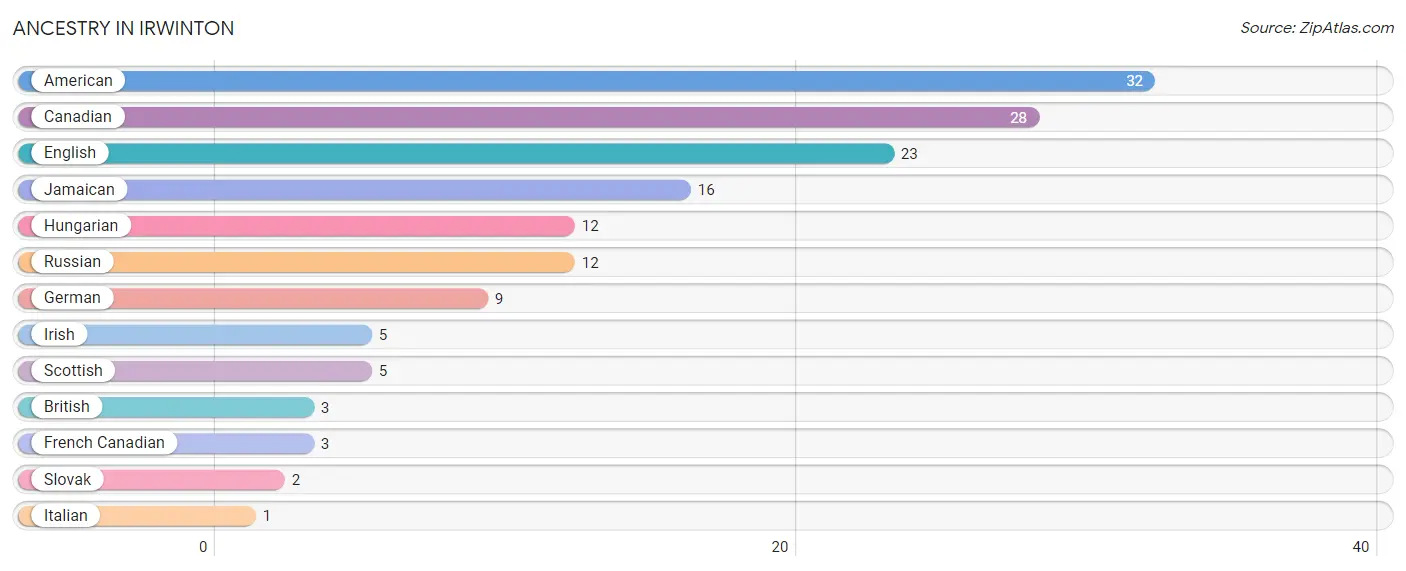
| Ancestry | # Population | % Population |
| American | 32 | 5.6% |
| British | 3 | 0.5% |
| Canadian | 28 | 4.9% |
| English | 23 | 4.0% |
| French Canadian | 3 | 0.5% |
| German | 9 | 1.6% |
| Hungarian | 12 | 2.1% |
| Irish | 5 | 0.9% |
| Italian | 1 | 0.2% |
| Jamaican | 16 | 2.8% |
| Russian | 12 | 2.1% |
| Scottish | 5 | 0.9% |
| Slovak | 2 | 0.4% | View All 13 Rows |
Immigrants in Irwinton
The most numerous immigrant groups reported in Irwinton came from , and Canada (19 | 3.3%), together accounting for 3.3% of all Irwinton residents.

| Immigration Origin | # Population | % Population |
| Canada | 19 | 3.3% | View All 1 Rows |
Sex and Age in Irwinton
Sex and Age in Irwinton
The most populous age groups in Irwinton are 15 to 19 Years (43 | 20.6%) for men and 30 to 34 Years (53 | 14.6%) for women.
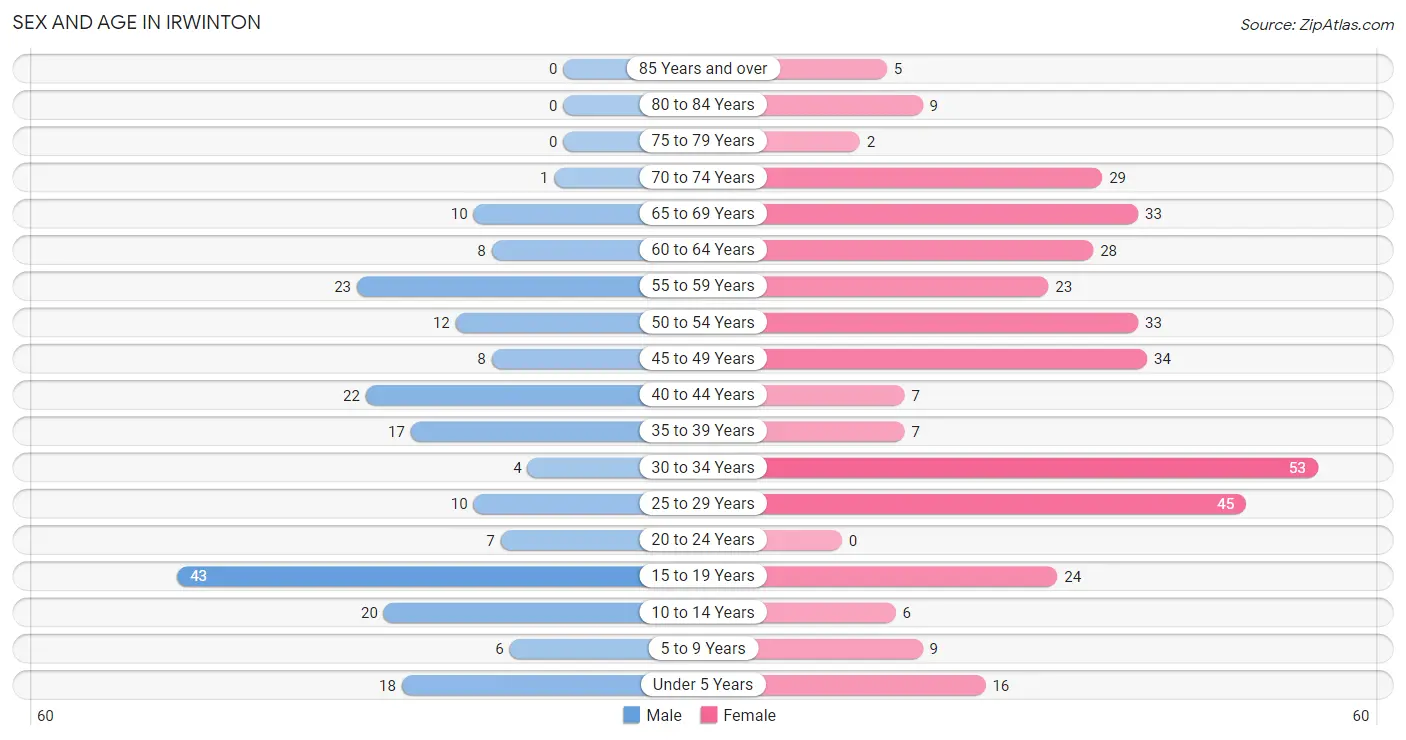
| Age Bracket | Male | Female |
| Under 5 Years | 18 (8.6%) | 16 (4.4%) |
| 5 to 9 Years | 6 (2.9%) | 9 (2.5%) |
| 10 to 14 Years | 20 (9.6%) | 6 (1.7%) |
| 15 to 19 Years | 43 (20.6%) | 24 (6.6%) |
| 20 to 24 Years | 7 (3.4%) | 0 (0.0%) |
| 25 to 29 Years | 10 (4.8%) | 45 (12.4%) |
| 30 to 34 Years | 4 (1.9%) | 53 (14.6%) |
| 35 to 39 Years | 17 (8.1%) | 7 (1.9%) |
| 40 to 44 Years | 22 (10.5%) | 7 (1.9%) |
| 45 to 49 Years | 8 (3.8%) | 34 (9.4%) |
| 50 to 54 Years | 12 (5.7%) | 33 (9.1%) |
| 55 to 59 Years | 23 (11.0%) | 23 (6.3%) |
| 60 to 64 Years | 8 (3.8%) | 28 (7.7%) |
| 65 to 69 Years | 10 (4.8%) | 33 (9.1%) |
| 70 to 74 Years | 1 (0.5%) | 29 (8.0%) |
| 75 to 79 Years | 0 (0.0%) | 2 (0.5%) |
| 80 to 84 Years | 0 (0.0%) | 9 (2.5%) |
| 85 Years and over | 0 (0.0%) | 5 (1.4%) |
| Total | 209 (100.0%) | 363 (100.0%) |
Families and Households in Irwinton
Median Family Size in Irwinton
The median family size in Irwinton is 4.68 persons per family, with single male/father families (4 | 4.3%) accounting for the largest median family size of 9.75 persons per family. On the other hand, married-couple families (39 | 41.9%) represent the smallest median family size with 3.97 persons per family.
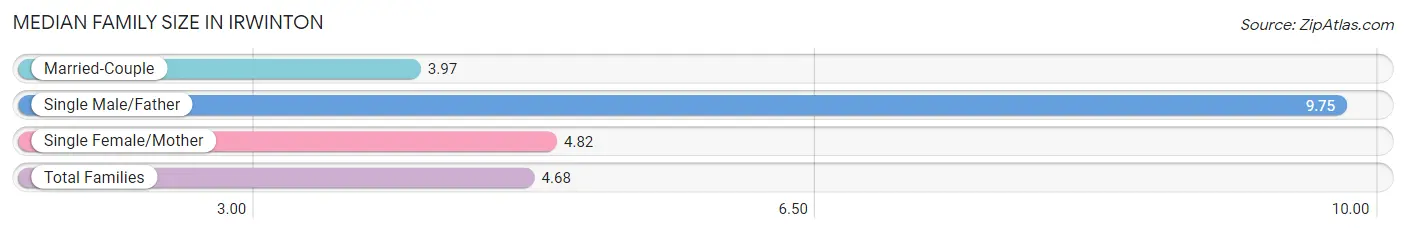
| Family Type | # Families | Family Size |
| Married-Couple | 39 (41.9%) | 3.97 |
| Single Male/Father | 4 (4.3%) | 9.75 |
| Single Female/Mother | 50 (53.8%) | 4.82 |
| Total Families | 93 (100.0%) | 4.68 |
Median Household Size in Irwinton
The median household size in Irwinton is 2.69 persons per household, with single male/father households (4 | 2.0%) accounting for the largest median household size of 9.75 persons per household. non-family households (111 | 54.4%) represent the smallest median household size with 1.02 persons per household.
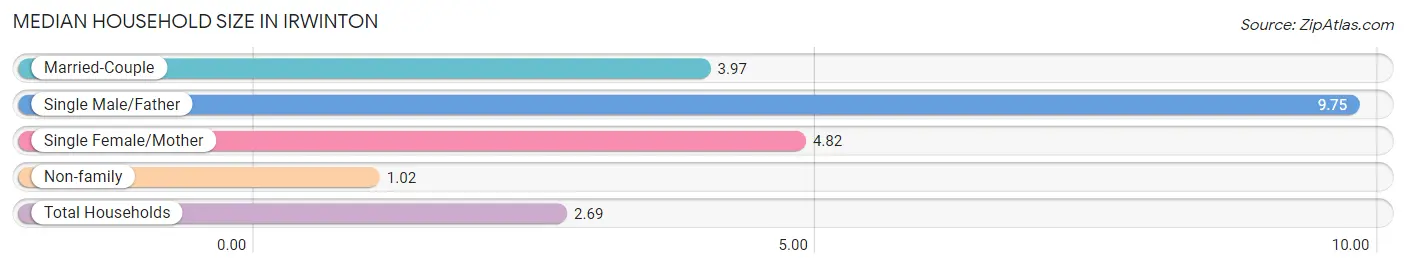
| Household Type | # Households | Household Size |
| Married-Couple | 39 (19.1%) | 3.97 |
| Single Male/Father | 4 (2.0%) | 9.75 |
| Single Female/Mother | 50 (24.5%) | 4.82 |
| Non-family | 111 (54.4%) | 1.02 |
| Total Households | 204 (100.0%) | 2.69 |
Household Size by Marriage Status in Irwinton
Out of a total of 204 households in Irwinton, 93 (45.6%) are family households, while 111 (54.4%) are nonfamily households. The most numerous type of family households are 3-person households, comprising 38, and the most common type of nonfamily households are 1-person households, comprising 108.
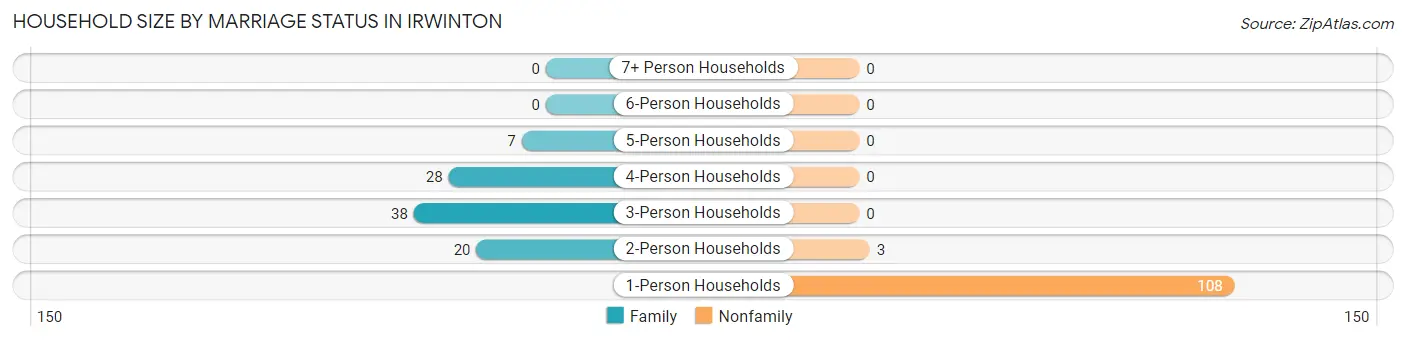
| Household Size | Family Households | Nonfamily Households |
| 1-Person Households | - | 108 (52.9%) |
| 2-Person Households | 20 (9.8%) | 3 (1.5%) |
| 3-Person Households | 38 (18.6%) | 0 (0.0%) |
| 4-Person Households | 28 (13.7%) | 0 (0.0%) |
| 5-Person Households | 7 (3.4%) | 0 (0.0%) |
| 6-Person Households | 0 (0.0%) | 0 (0.0%) |
| 7+ Person Households | 0 (0.0%) | 0 (0.0%) |
| Total | 93 (45.6%) | 111 (54.4%) |
Female Fertility in Irwinton
Fertility by Age in Irwinton
Average fertility rate in Irwinton is 65.0 births per 1,000 women. Women in the age bracket of 35 to 50 years have the highest fertility rate with 146.0 births per 1,000 women. Women in the age bracket of 35 to 50 years acount for 63.6% of all women with births.
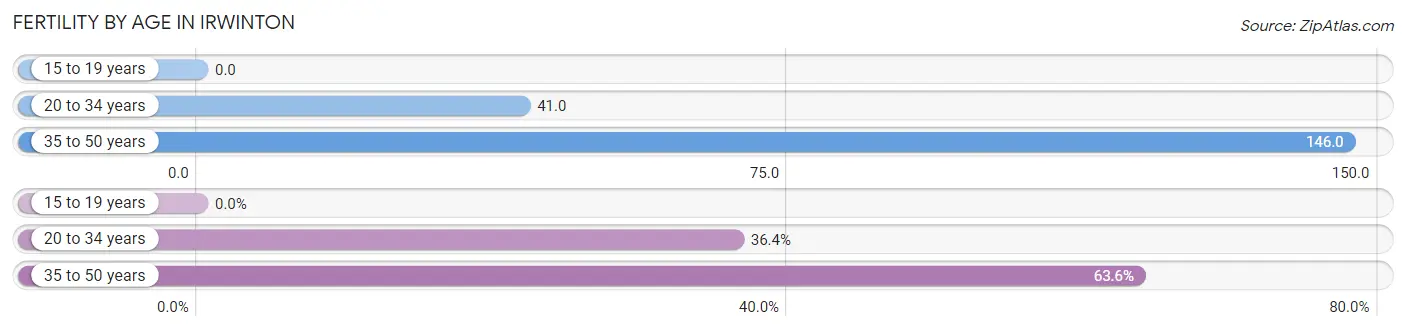
| Age Bracket | Women with Births | Births / 1,000 Women |
| 15 to 19 years | 0 (0.0%) | 0.0 |
| 20 to 34 years | 4 (36.4%) | 41.0 |
| 35 to 50 years | 7 (63.6%) | 146.0 |
| Total | 11 (100.0%) | 65.0 |
Fertility by Age by Marriage Status in Irwinton
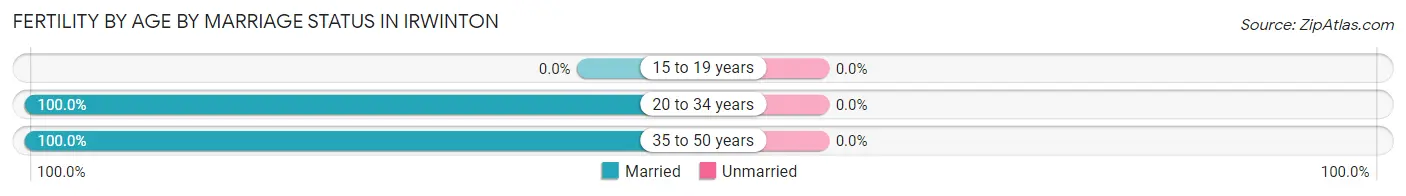
| Age Bracket | Married | Unmarried |
| 15 to 19 years | 0 (0.0%) | 0 (0.0%) |
| 20 to 34 years | 4 (100.0%) | 0 (0.0%) |
| 35 to 50 years | 7 (100.0%) | 0 (0.0%) |
| Total | 11 (100.0%) | 0 (0.0%) |
Fertility by Education in Irwinton
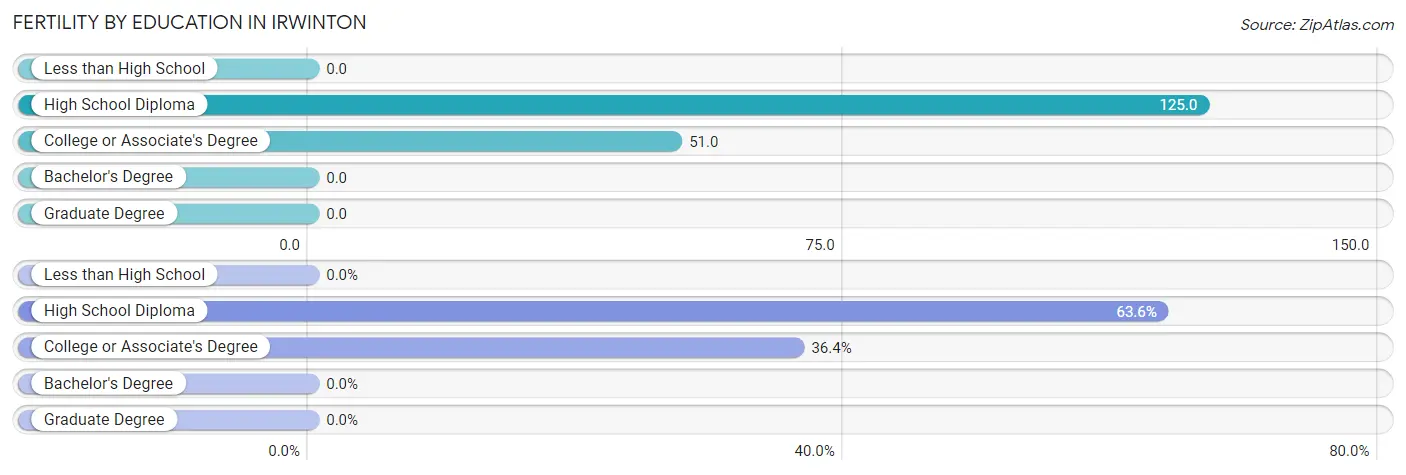
| Educational Attainment | Women with Births | Births / 1,000 Women |
| Less than High School | 0 (0.0%) | 0.0 |
| High School Diploma | 7 (63.6%) | 125.0 |
| College or Associate's Degree | 4 (36.4%) | 51.0 |
| Bachelor's Degree | 0 (0.0%) | 0.0 |
| Graduate Degree | 0 (0.0%) | 0.0 |
| Total | 11 (100.0%) | 65.0 |
Fertility by Education by Marriage Status in Irwinton
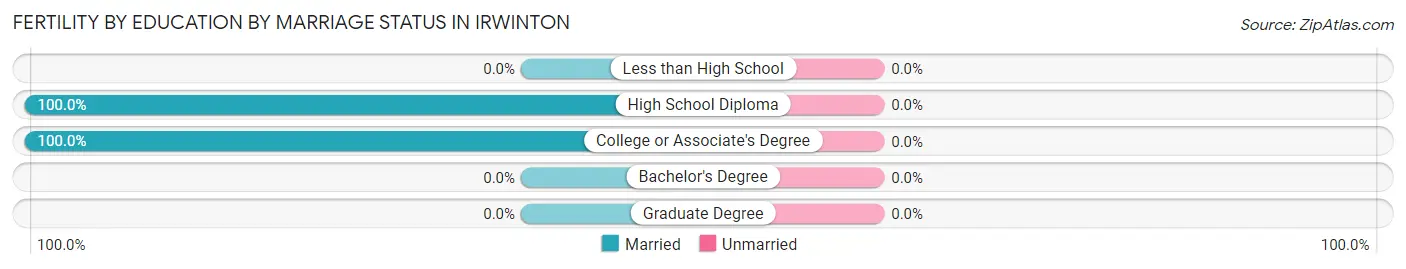
| Educational Attainment | Married | Unmarried |
| Less than High School | 0 (0.0%) | 0 (0.0%) |
| High School Diploma | 7 (100.0%) | 0 (0.0%) |
| College or Associate's Degree | 4 (100.0%) | 0 (0.0%) |
| Bachelor's Degree | 0 (0.0%) | 0 (0.0%) |
| Graduate Degree | 0 (0.0%) | 0 (0.0%) |
| Total | 11 (100.0%) | 0 (0.0%) |
Employment Characteristics in Irwinton
Employment by Class of Employer in Irwinton
Among the 262 employed individuals in Irwinton, private company employees (128 | 48.8%), local government employees (64 | 24.4%), and state government employees (32 | 12.2%) make up the most common classes of employment.
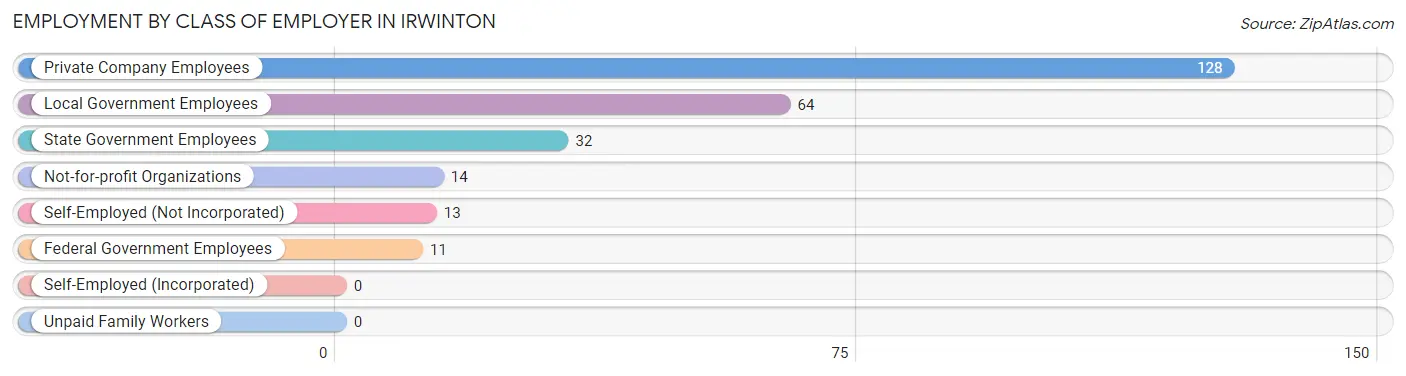
| Employer Class | # Employees | % Employees |
| Private Company Employees | 128 | 48.8% |
| Self-Employed (Incorporated) | 0 | 0.0% |
| Self-Employed (Not Incorporated) | 13 | 5.0% |
| Not-for-profit Organizations | 14 | 5.3% |
| Local Government Employees | 64 | 24.4% |
| State Government Employees | 32 | 12.2% |
| Federal Government Employees | 11 | 4.2% |
| Unpaid Family Workers | 0 | 0.0% |
| Total | 262 | 100.0% |
Employment Status by Age in Irwinton
According to the labor force statistics for Irwinton, out of the total population over 16 years of age (473), 64.3% or 304 individuals are in the labor force, with 11.5% or 35 of them unemployed. The age group with the highest labor force participation rate is 20 to 24 years, with 100.0% or 7 individuals in the labor force. Within the labor force, the 16 to 19 years age range has the highest percentage of unemployed individuals, with 51.9% or 14 of them being unemployed.
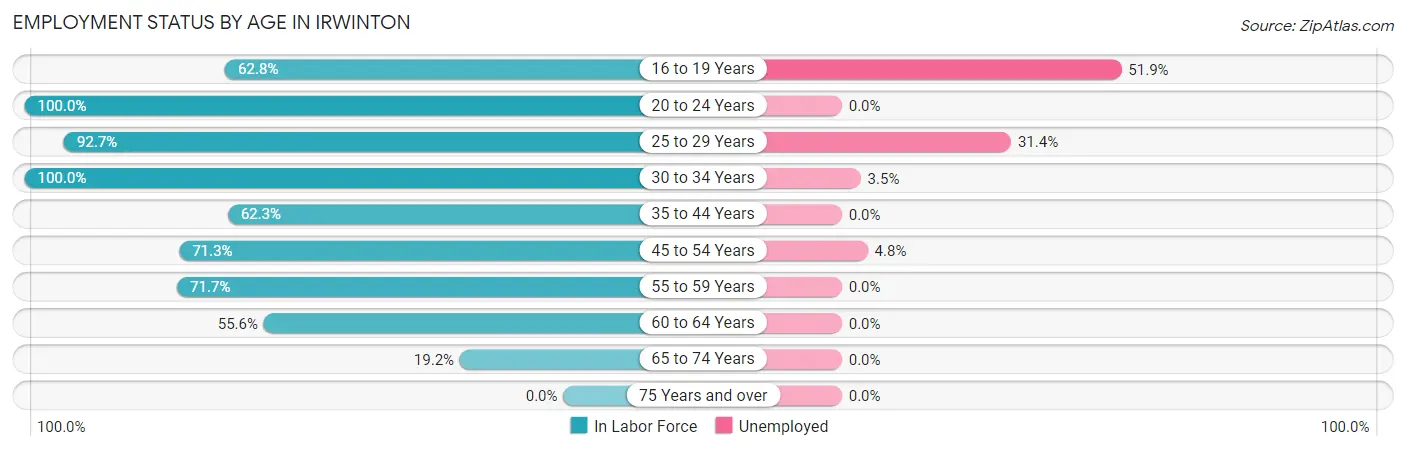
| Age Bracket | In Labor Force | Unemployed |
| 16 to 19 Years | 27 (62.8%) | 14 (51.9%) |
| 20 to 24 Years | 7 (100.0%) | 0 (0.0%) |
| 25 to 29 Years | 51 (92.7%) | 16 (31.4%) |
| 30 to 34 Years | 57 (100.0%) | 2 (3.5%) |
| 35 to 44 Years | 33 (62.3%) | 0 (0.0%) |
| 45 to 54 Years | 62 (71.3%) | 3 (4.8%) |
| 55 to 59 Years | 33 (71.7%) | 0 (0.0%) |
| 60 to 64 Years | 20 (55.6%) | 0 (0.0%) |
| 65 to 74 Years | 14 (19.2%) | 0 (0.0%) |
| 75 Years and over | 0 (0.0%) | 0 (0.0%) |
| Total | 304 (64.3%) | 35 (11.5%) |
Employment Status by Educational Attainment in Irwinton
According to labor force statistics for Irwinton, 76.6% of individuals (256) out of the total population between 25 and 64 years of age (334) are in the labor force, with 8.2% or 21 of them being unemployed. The group with the highest labor force participation rate are those with the educational attainment of college / associate degree, with 86.8% or 105 individuals in the labor force. Within the labor force, individuals with less than high school education have the highest percentage of unemployment, with 17.6% or 3 of them being unemployed.
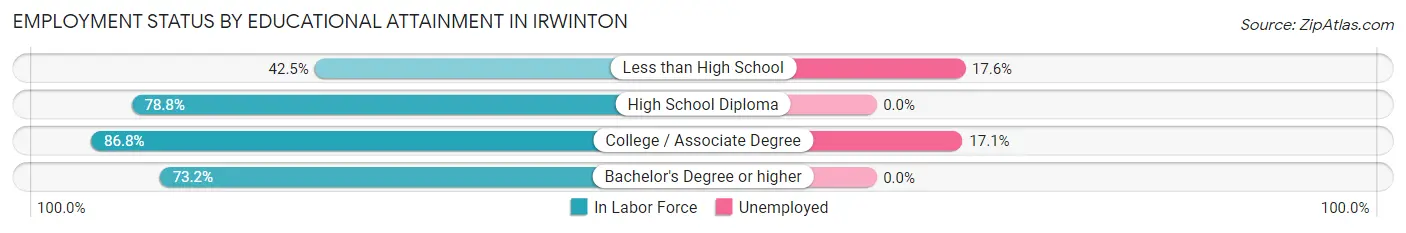
| Educational Attainment | In Labor Force | Unemployed |
| Less than High School | 17 (42.5%) | 7 (17.6%) |
| High School Diploma | 104 (78.8%) | 0 (0.0%) |
| College / Associate Degree | 105 (86.8%) | 21 (17.1%) |
| Bachelor's Degree or higher | 30 (73.2%) | 0 (0.0%) |
| Total | 256 (76.6%) | 27 (8.2%) |
Employment Occupations by Sex in Irwinton
Management, Business, Science and Arts Occupations
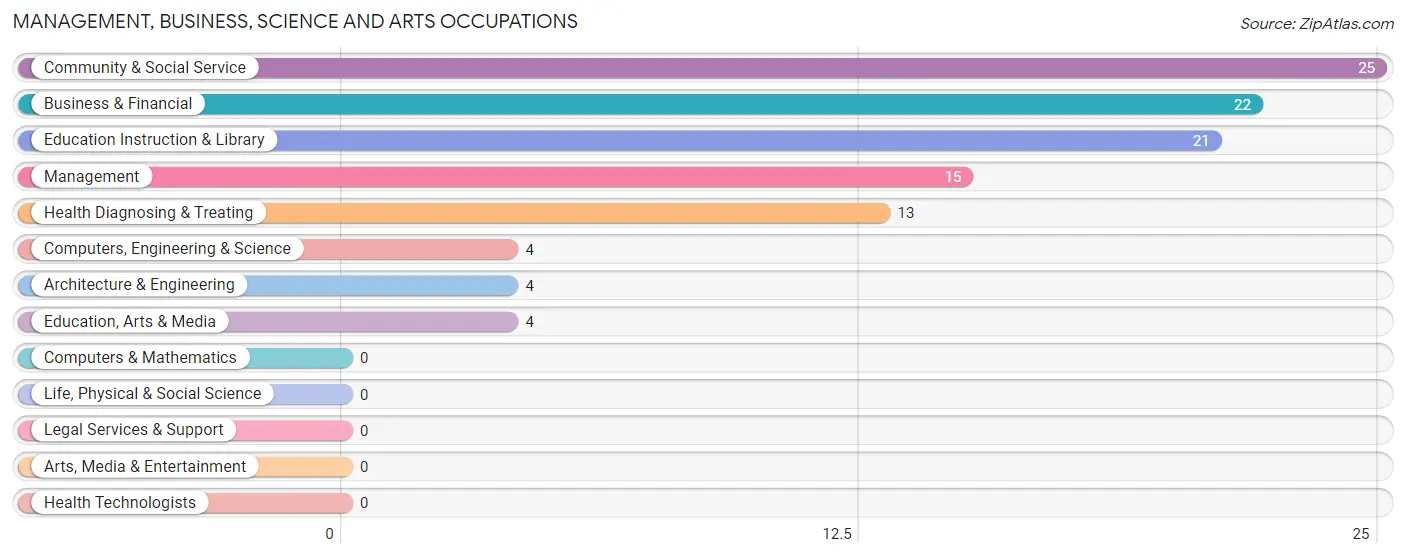
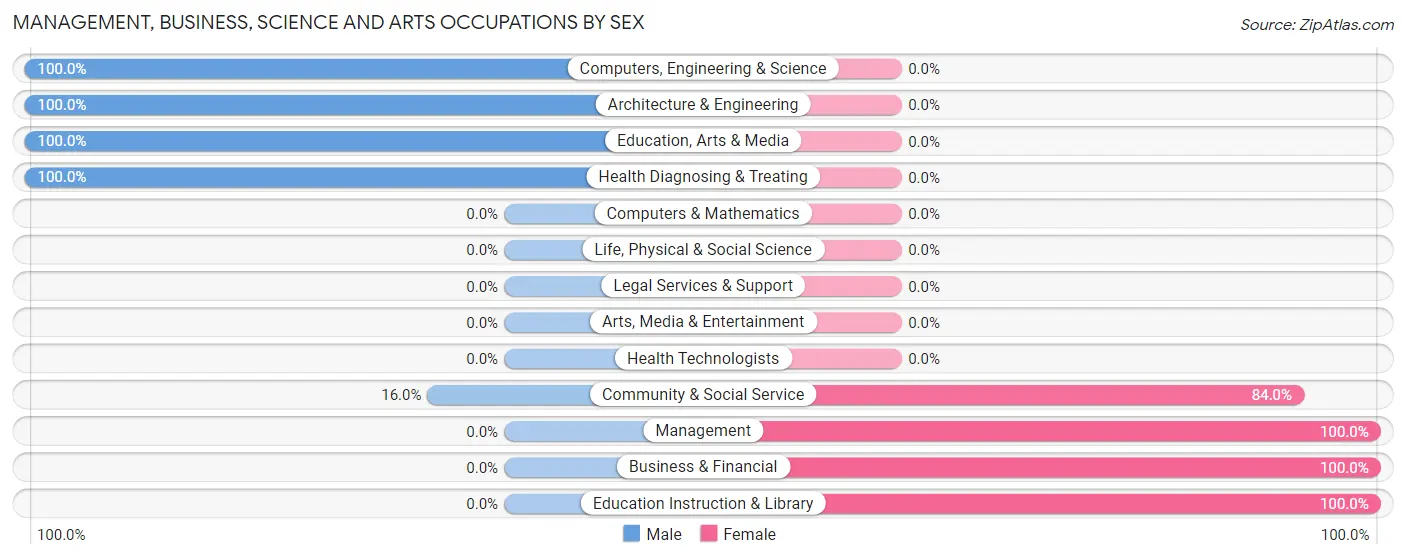
The most common Management, Business, Science and Arts occupations in Irwinton are Community & Social Service (25 | 9.3%), Business & Financial (22 | 8.2%), Education Instruction & Library (21 | 7.8%), Management (15 | 5.6%), and Health Diagnosing & Treating (13 | 4.8%).
Management, Business, Science and Arts Occupations by Sex
Within the Management, Business, Science and Arts occupations in Irwinton, the most male-oriented occupations are Computers, Engineering & Science (100.0%), Architecture & Engineering (100.0%), and Education, Arts & Media (100.0%), while the most female-oriented occupations are Management (100.0%), Business & Financial (100.0%), and Education Instruction & Library (100.0%).
| Occupation | Male | Female |
| Management | 0 (0.0%) | 15 (100.0%) |
| Business & Financial | 0 (0.0%) | 22 (100.0%) |
| Computers, Engineering & Science | 4 (100.0%) | 0 (0.0%) |
| Computers & Mathematics | 0 (0.0%) | 0 (0.0%) |
| Architecture & Engineering | 4 (100.0%) | 0 (0.0%) |
| Life, Physical & Social Science | 0 (0.0%) | 0 (0.0%) |
| Community & Social Service | 4 (16.0%) | 21 (84.0%) |
| Education, Arts & Media | 4 (100.0%) | 0 (0.0%) |
| Legal Services & Support | 0 (0.0%) | 0 (0.0%) |
| Education Instruction & Library | 0 (0.0%) | 21 (100.0%) |
| Arts, Media & Entertainment | 0 (0.0%) | 0 (0.0%) |
| Health Diagnosing & Treating | 13 (100.0%) | 0 (0.0%) |
| Health Technologists | 0 (0.0%) | 0 (0.0%) |
| Total (Category) | 21 (26.6%) | 58 (73.4%) |
| Total (Overall) | 77 (28.6%) | 192 (71.4%) |
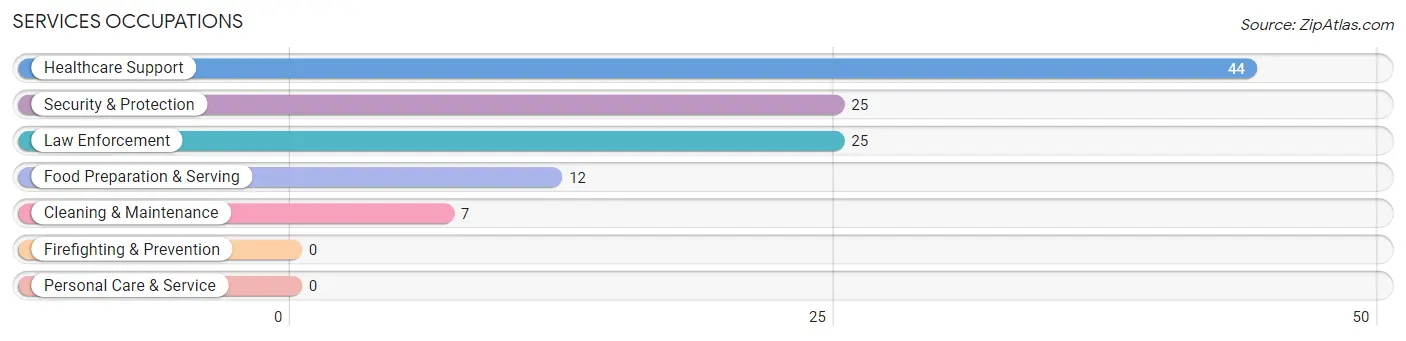
Services Occupations
The most common Services occupations in Irwinton are Healthcare Support (44 | 16.4%), Security & Protection (25 | 9.3%), Law Enforcement (25 | 9.3%), Food Preparation & Serving (12 | 4.5%), and Cleaning & Maintenance (7 | 2.6%).
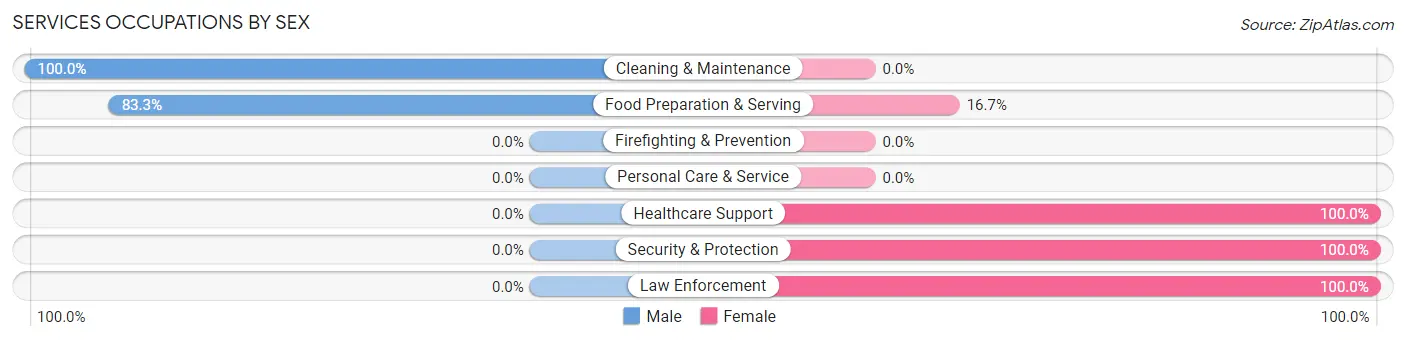
Services Occupations by Sex
Within the Services occupations in Irwinton, the most male-oriented occupations are Cleaning & Maintenance (100.0%), and Food Preparation & Serving (83.3%), while the most female-oriented occupations are Healthcare Support (100.0%), Security & Protection (100.0%), and Law Enforcement (100.0%).
| Occupation | Male | Female |
| Healthcare Support | 0 (0.0%) | 44 (100.0%) |
| Security & Protection | 0 (0.0%) | 25 (100.0%) |
| Firefighting & Prevention | 0 (0.0%) | 0 (0.0%) |
| Law Enforcement | 0 (0.0%) | 25 (100.0%) |
| Food Preparation & Serving | 10 (83.3%) | 2 (16.7%) |
| Cleaning & Maintenance | 7 (100.0%) | 0 (0.0%) |
| Personal Care & Service | 0 (0.0%) | 0 (0.0%) |
| Total (Category) | 17 (19.3%) | 71 (80.7%) |
| Total (Overall) | 77 (28.6%) | 192 (71.4%) |
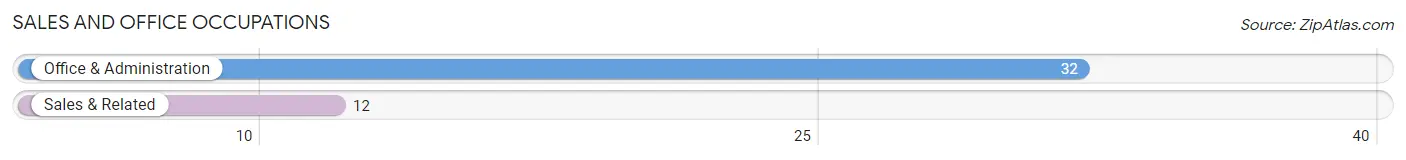
Sales and Office Occupations
The most common Sales and Office occupations in Irwinton are Office & Administration (32 | 11.9%), and Sales & Related (12 | 4.5%).
Sales and Office Occupations by Sex
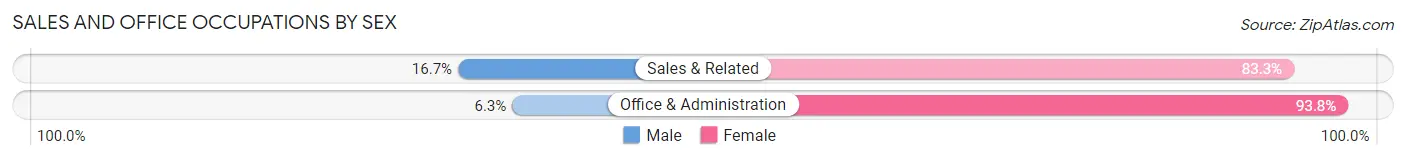
| Occupation | Male | Female |
| Sales & Related | 2 (16.7%) | 10 (83.3%) |
| Office & Administration | 2 (6.2%) | 30 (93.8%) |
| Total (Category) | 4 (9.1%) | 40 (90.9%) |
| Total (Overall) | 77 (28.6%) | 192 (71.4%) |
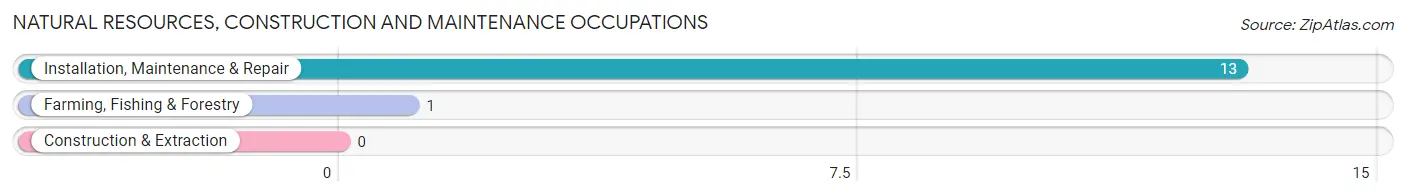
Natural Resources, Construction and Maintenance Occupations
The most common Natural Resources, Construction and Maintenance occupations in Irwinton are Installation, Maintenance & Repair (13 | 4.8%), and Farming, Fishing & Forestry (1 | 0.4%).
Natural Resources, Construction and Maintenance Occupations by Sex
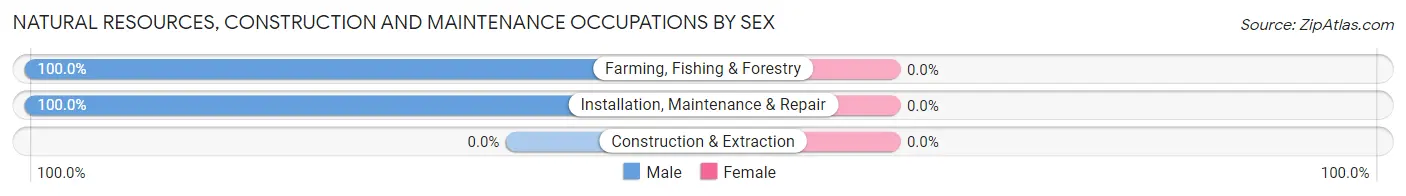
| Occupation | Male | Female |
| Farming, Fishing & Forestry | 1 (100.0%) | 0 (0.0%) |
| Construction & Extraction | 0 (0.0%) | 0 (0.0%) |
| Installation, Maintenance & Repair | 13 (100.0%) | 0 (0.0%) |
| Total (Category) | 14 (100.0%) | 0 (0.0%) |
| Total (Overall) | 77 (28.6%) | 192 (71.4%) |
Production, Transportation and Moving Occupations
The most common Production, Transportation and Moving occupations in Irwinton are Production (21 | 7.8%), Material Moving (19 | 7.1%), and Transportation (4 | 1.5%).
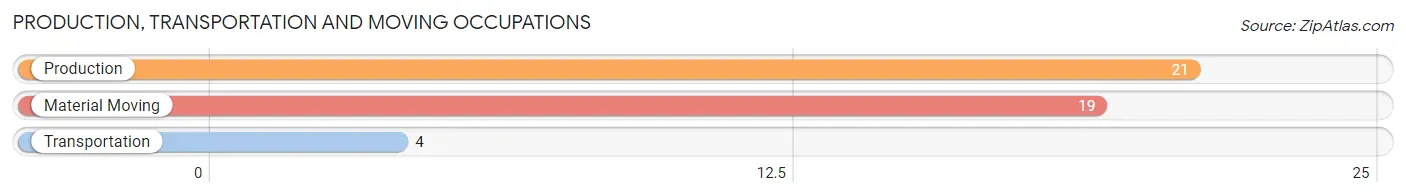
Production, Transportation and Moving Occupations by Sex
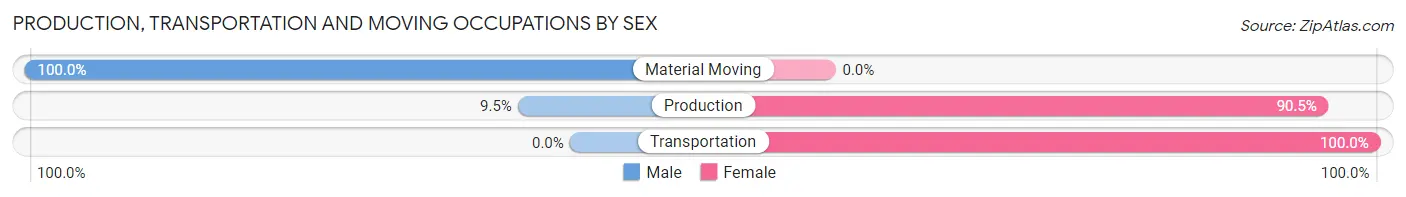
| Occupation | Male | Female |
| Production | 2 (9.5%) | 19 (90.5%) |
| Transportation | 0 (0.0%) | 4 (100.0%) |
| Material Moving | 19 (100.0%) | 0 (0.0%) |
| Total (Category) | 21 (47.7%) | 23 (52.3%) |
| Total (Overall) | 77 (28.6%) | 192 (71.4%) |
Employment Industries by Sex in Irwinton
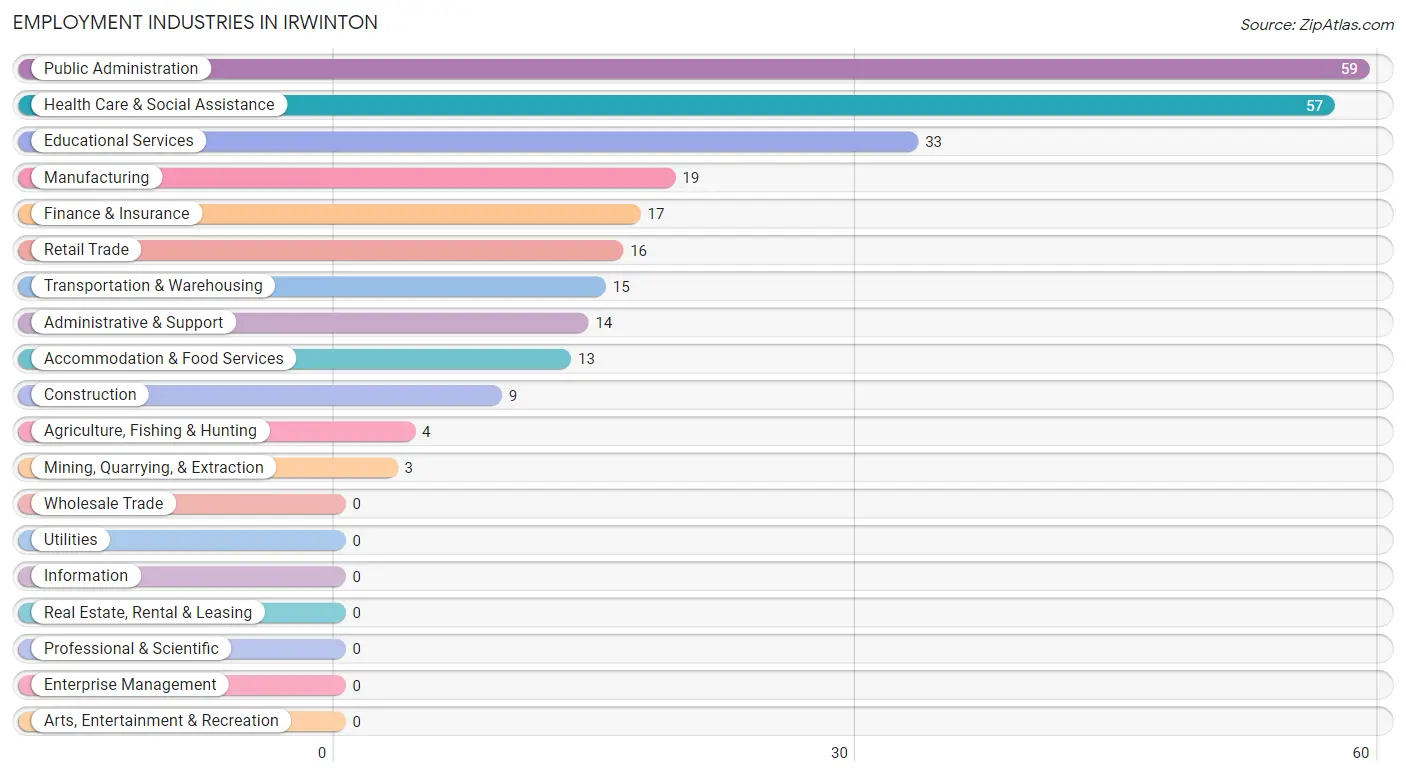
Employment Industries in Irwinton
The major employment industries in Irwinton include Public Administration (59 | 21.9%), Health Care & Social Assistance (57 | 21.2%), Educational Services (33 | 12.3%), Manufacturing (19 | 7.1%), and Finance & Insurance (17 | 6.3%).
Employment Industries by Sex in Irwinton
The Irwinton industries that see more men than women are Agriculture, Fishing & Hunting (100.0%), Mining, Quarrying, & Extraction (100.0%), and Construction (100.0%), whereas the industries that tend to have a higher number of women are Manufacturing (100.0%), Finance & Insurance (100.0%), and Educational Services (100.0%).
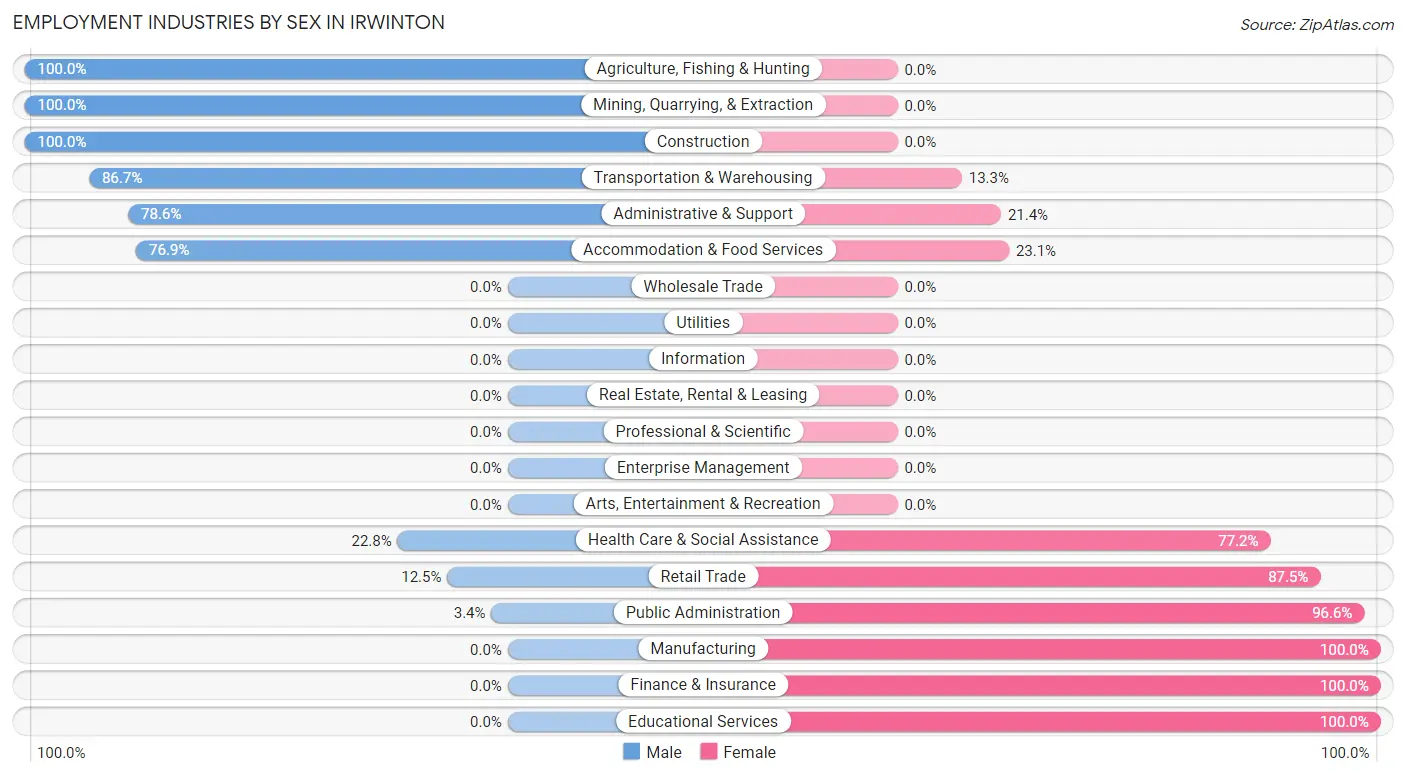
| Industry | Male | Female |
| Agriculture, Fishing & Hunting | 4 (100.0%) | 0 (0.0%) |
| Mining, Quarrying, & Extraction | 3 (100.0%) | 0 (0.0%) |
| Construction | 9 (100.0%) | 0 (0.0%) |
| Manufacturing | 0 (0.0%) | 19 (100.0%) |
| Wholesale Trade | 0 (0.0%) | 0 (0.0%) |
| Retail Trade | 2 (12.5%) | 14 (87.5%) |
| Transportation & Warehousing | 13 (86.7%) | 2 (13.3%) |
| Utilities | 0 (0.0%) | 0 (0.0%) |
| Information | 0 (0.0%) | 0 (0.0%) |
| Finance & Insurance | 0 (0.0%) | 17 (100.0%) |
| Real Estate, Rental & Leasing | 0 (0.0%) | 0 (0.0%) |
| Professional & Scientific | 0 (0.0%) | 0 (0.0%) |
| Enterprise Management | 0 (0.0%) | 0 (0.0%) |
| Administrative & Support | 11 (78.6%) | 3 (21.4%) |
| Educational Services | 0 (0.0%) | 33 (100.0%) |
| Health Care & Social Assistance | 13 (22.8%) | 44 (77.2%) |
| Arts, Entertainment & Recreation | 0 (0.0%) | 0 (0.0%) |
| Accommodation & Food Services | 10 (76.9%) | 3 (23.1%) |
| Public Administration | 2 (3.4%) | 57 (96.6%) |
| Total | 77 (28.6%) | 192 (71.4%) |
Education in Irwinton
School Enrollment in Irwinton
The most common levels of schooling among the 106 students in Irwinton are high school (46 | 43.4%), college / undergraduate (25 | 23.6%), and elementary school (23 | 21.7%).
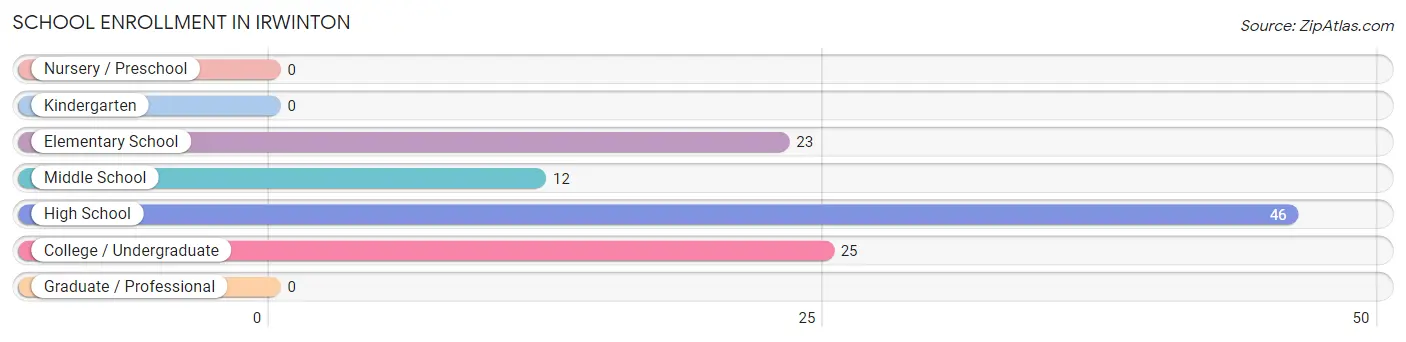
| School Level | # Students | % Students |
| Nursery / Preschool | 0 | 0.0% |
| Kindergarten | 0 | 0.0% |
| Elementary School | 23 | 21.7% |
| Middle School | 12 | 11.3% |
| High School | 46 | 43.4% |
| College / Undergraduate | 25 | 23.6% |
| Graduate / Professional | 0 | 0.0% |
| Total | 106 | 100.0% |
School Enrollment by Age by Funding Source in Irwinton
Out of a total of 106 students who are enrolled in schools in Irwinton, 40 (37.7%) attend a private institution, while the remaining 66 (62.3%) are enrolled in public schools. The age group of 25 to 34 year olds has the highest likelihood of being enrolled in private schools, with 25 (100.0% in the age bracket) enrolled. Conversely, the age group of 5 to 9 year old has the lowest likelihood of being enrolled in a private school, with 15 (100.0% in the age bracket) attending a public institution.
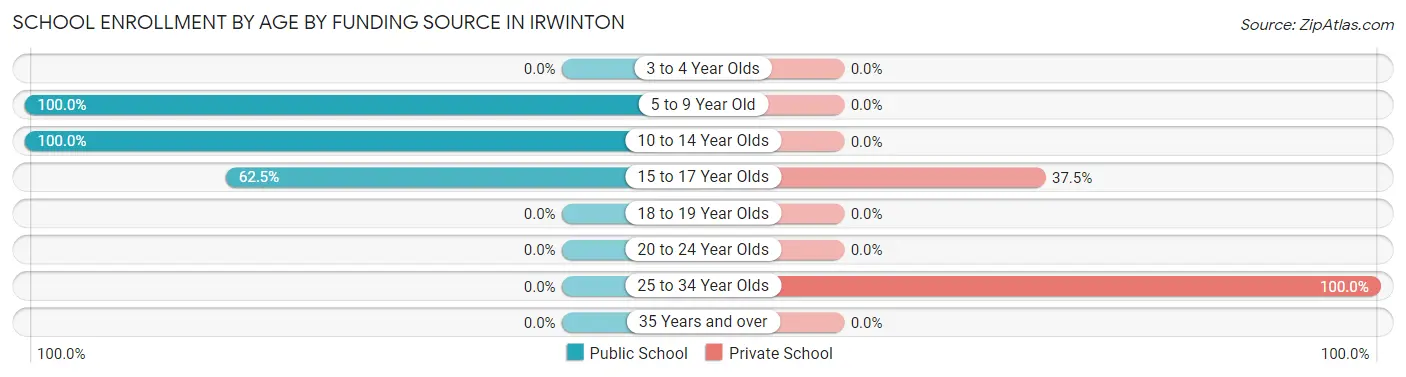
| Age Bracket | Public School | Private School |
| 3 to 4 Year Olds | 0 (0.0%) | 0 (0.0%) |
| 5 to 9 Year Old | 15 (100.0%) | 0 (0.0%) |
| 10 to 14 Year Olds | 26 (100.0%) | 0 (0.0%) |
| 15 to 17 Year Olds | 25 (62.5%) | 15 (37.5%) |
| 18 to 19 Year Olds | 0 (0.0%) | 0 (0.0%) |
| 20 to 24 Year Olds | 0 (0.0%) | 0 (0.0%) |
| 25 to 34 Year Olds | 0 (0.0%) | 25 (100.0%) |
| 35 Years and over | 0 (0.0%) | 0 (0.0%) |
| Total | 66 (62.3%) | 40 (37.7%) |
Educational Attainment by Field of Study in Irwinton
Science & technology (16 | 39.0%), literature & languages (10 | 24.4%), liberal arts & history (8 | 19.5%), business (6 | 14.6%), and arts & humanities (1 | 2.4%) are the most common fields of study among 41 individuals in Irwinton who have obtained a bachelor's degree or higher.
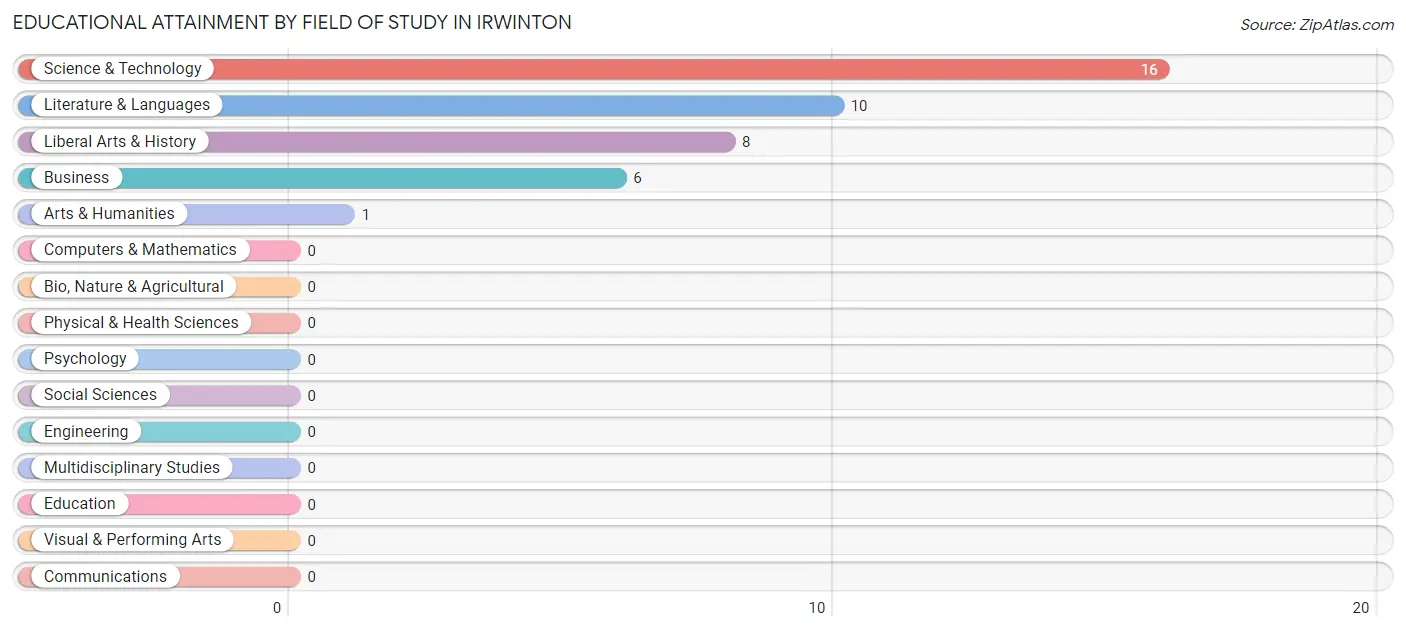
| Field of Study | # Graduates | % Graduates |
| Computers & Mathematics | 0 | 0.0% |
| Bio, Nature & Agricultural | 0 | 0.0% |
| Physical & Health Sciences | 0 | 0.0% |
| Psychology | 0 | 0.0% |
| Social Sciences | 0 | 0.0% |
| Engineering | 0 | 0.0% |
| Multidisciplinary Studies | 0 | 0.0% |
| Science & Technology | 16 | 39.0% |
| Business | 6 | 14.6% |
| Education | 0 | 0.0% |
| Literature & Languages | 10 | 24.4% |
| Liberal Arts & History | 8 | 19.5% |
| Visual & Performing Arts | 0 | 0.0% |
| Communications | 0 | 0.0% |
| Arts & Humanities | 1 | 2.4% |
| Total | 41 | 100.0% |
Transportation & Commute in Irwinton
Vehicle Availability by Sex in Irwinton
The most prevalent vehicle ownership categories in Irwinton are males with 3 vehicles (38, accounting for 54.3%) and females with 3 vehicles (58, making up 19.8%).
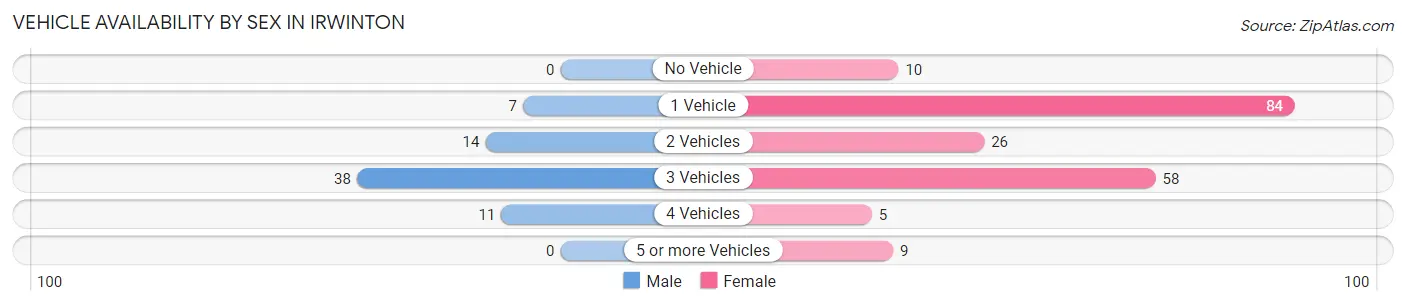
| Vehicles Available | Male | Female |
| No Vehicle | 0 (0.0%) | 10 (5.2%) |
| 1 Vehicle | 7 (10.0%) | 84 (43.8%) |
| 2 Vehicles | 14 (20.0%) | 26 (13.5%) |
| 3 Vehicles | 38 (54.3%) | 58 (30.2%) |
| 4 Vehicles | 11 (15.7%) | 5 (2.6%) |
| 5 or more Vehicles | 0 (0.0%) | 9 (4.7%) |
| Total | 70 (100.0%) | 192 (100.0%) |
Commute Time in Irwinton
The most frequently occuring commute durations in Irwinton are 10 to 14 minutes (53 commuters, 20.2%), 30 to 34 minutes (45 commuters, 17.2%), and 5 to 9 minutes (33 commuters, 12.6%).
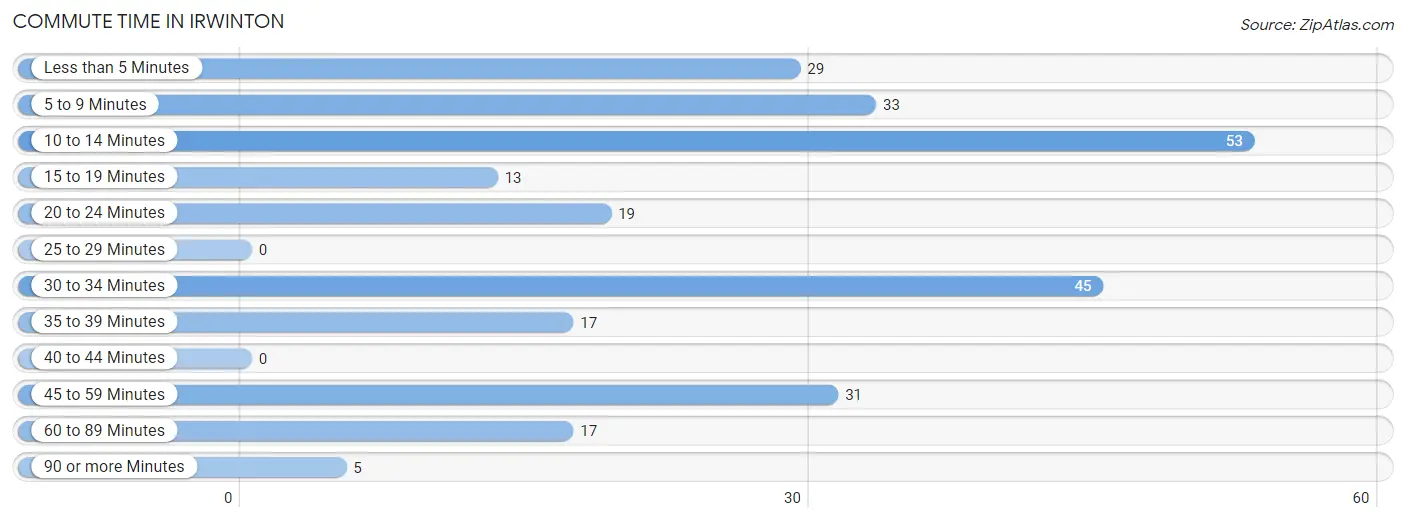
| Commute Time | # Commuters | % Commuters |
| Less than 5 Minutes | 29 | 11.1% |
| 5 to 9 Minutes | 33 | 12.6% |
| 10 to 14 Minutes | 53 | 20.2% |
| 15 to 19 Minutes | 13 | 5.0% |
| 20 to 24 Minutes | 19 | 7.2% |
| 25 to 29 Minutes | 0 | 0.0% |
| 30 to 34 Minutes | 45 | 17.2% |
| 35 to 39 Minutes | 17 | 6.5% |
| 40 to 44 Minutes | 0 | 0.0% |
| 45 to 59 Minutes | 31 | 11.8% |
| 60 to 89 Minutes | 17 | 6.5% |
| 90 or more Minutes | 5 | 1.9% |
Commute Time by Sex in Irwinton
The most common commute times in Irwinton are 30 to 34 minutes (21 commuters, 30.0%) for males and 10 to 14 minutes (53 commuters, 27.6%) for females.
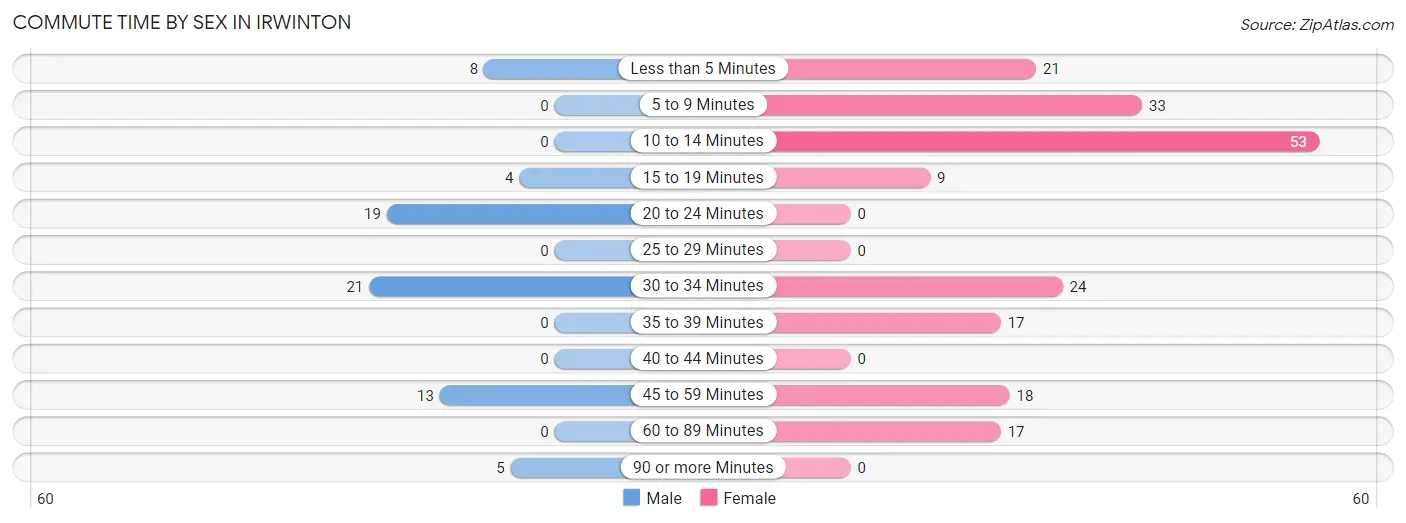
| Commute Time | Male | Female |
| Less than 5 Minutes | 8 (11.4%) | 21 (10.9%) |
| 5 to 9 Minutes | 0 (0.0%) | 33 (17.2%) |
| 10 to 14 Minutes | 0 (0.0%) | 53 (27.6%) |
| 15 to 19 Minutes | 4 (5.7%) | 9 (4.7%) |
| 20 to 24 Minutes | 19 (27.1%) | 0 (0.0%) |
| 25 to 29 Minutes | 0 (0.0%) | 0 (0.0%) |
| 30 to 34 Minutes | 21 (30.0%) | 24 (12.5%) |
| 35 to 39 Minutes | 0 (0.0%) | 17 (8.8%) |
| 40 to 44 Minutes | 0 (0.0%) | 0 (0.0%) |
| 45 to 59 Minutes | 13 (18.6%) | 18 (9.4%) |
| 60 to 89 Minutes | 0 (0.0%) | 17 (8.8%) |
| 90 or more Minutes | 5 (7.1%) | 0 (0.0%) |
Time of Departure to Work by Sex in Irwinton
The most frequent times of departure to work in Irwinton are 7:00 AM to 7:29 AM (29, 41.4%) for males and 7:00 AM to 7:29 AM (55, 28.6%) for females.
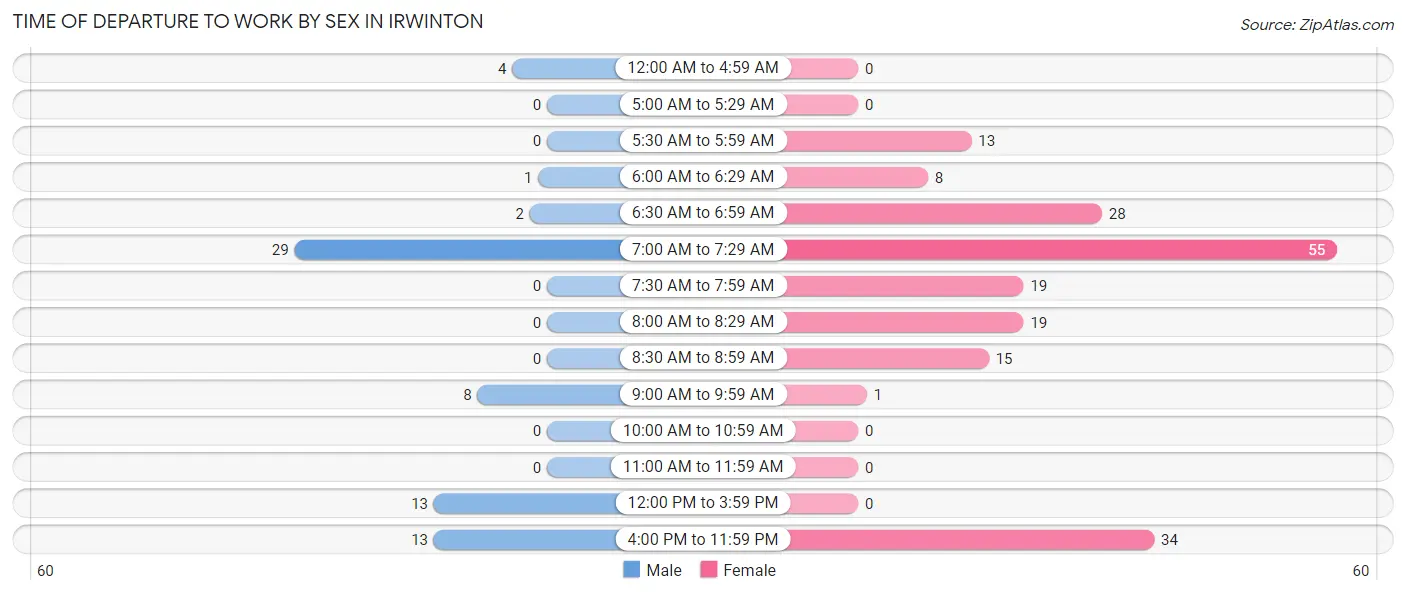
| Time of Departure | Male | Female |
| 12:00 AM to 4:59 AM | 4 (5.7%) | 0 (0.0%) |
| 5:00 AM to 5:29 AM | 0 (0.0%) | 0 (0.0%) |
| 5:30 AM to 5:59 AM | 0 (0.0%) | 13 (6.8%) |
| 6:00 AM to 6:29 AM | 1 (1.4%) | 8 (4.2%) |
| 6:30 AM to 6:59 AM | 2 (2.9%) | 28 (14.6%) |
| 7:00 AM to 7:29 AM | 29 (41.4%) | 55 (28.6%) |
| 7:30 AM to 7:59 AM | 0 (0.0%) | 19 (9.9%) |
| 8:00 AM to 8:29 AM | 0 (0.0%) | 19 (9.9%) |
| 8:30 AM to 8:59 AM | 0 (0.0%) | 15 (7.8%) |
| 9:00 AM to 9:59 AM | 8 (11.4%) | 1 (0.5%) |
| 10:00 AM to 10:59 AM | 0 (0.0%) | 0 (0.0%) |
| 11:00 AM to 11:59 AM | 0 (0.0%) | 0 (0.0%) |
| 12:00 PM to 3:59 PM | 13 (18.6%) | 0 (0.0%) |
| 4:00 PM to 11:59 PM | 13 (18.6%) | 34 (17.7%) |
| Total | 70 (100.0%) | 192 (100.0%) |
Housing Occupancy in Irwinton
Occupancy by Ownership in Irwinton
Of the total 204 dwellings in Irwinton, owner-occupied units account for 151 (74.0%), while renter-occupied units make up 53 (26.0%).
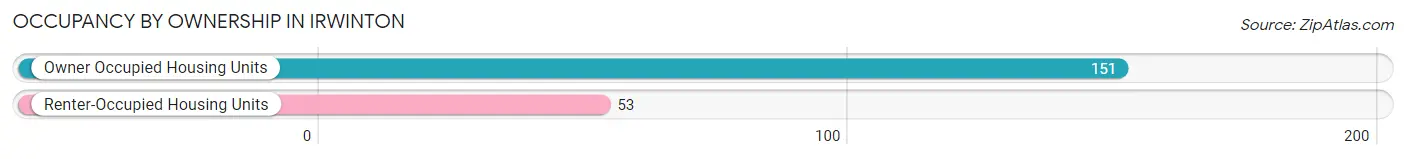
| Occupancy | # Housing Units | % Housing Units |
| Owner Occupied Housing Units | 151 | 74.0% |
| Renter-Occupied Housing Units | 53 | 26.0% |
| Total Occupied Housing Units | 204 | 100.0% |
Occupancy by Household Size in Irwinton
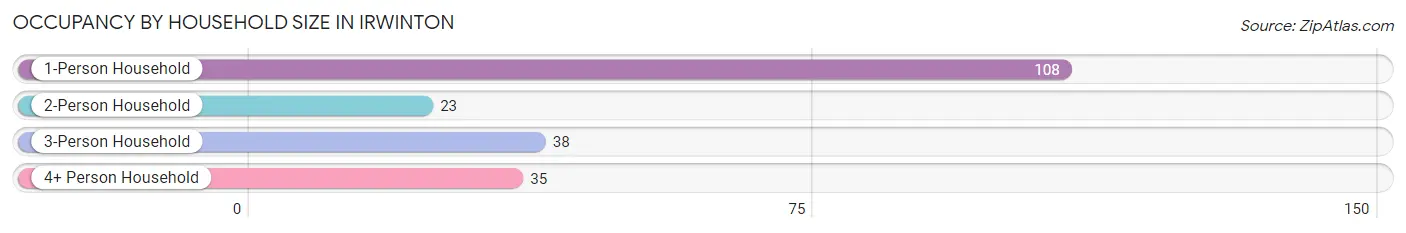
| Household Size | # Housing Units | % Housing Units |
| 1-Person Household | 108 | 52.9% |
| 2-Person Household | 23 | 11.3% |
| 3-Person Household | 38 | 18.6% |
| 4+ Person Household | 35 | 17.2% |
| Total Housing Units | 204 | 100.0% |
Occupancy by Ownership by Household Size in Irwinton
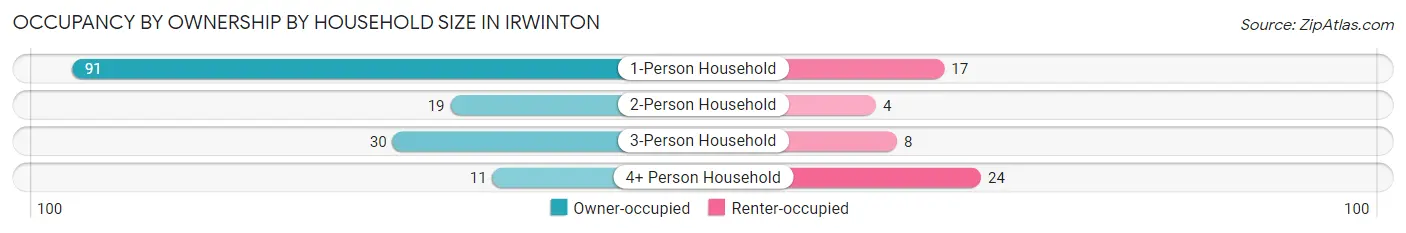
| Household Size | Owner-occupied | Renter-occupied |
| 1-Person Household | 91 (84.3%) | 17 (15.7%) |
| 2-Person Household | 19 (82.6%) | 4 (17.4%) |
| 3-Person Household | 30 (78.9%) | 8 (21.0%) |
| 4+ Person Household | 11 (31.4%) | 24 (68.6%) |
| Total Housing Units | 151 (74.0%) | 53 (26.0%) |
Occupancy by Educational Attainment in Irwinton
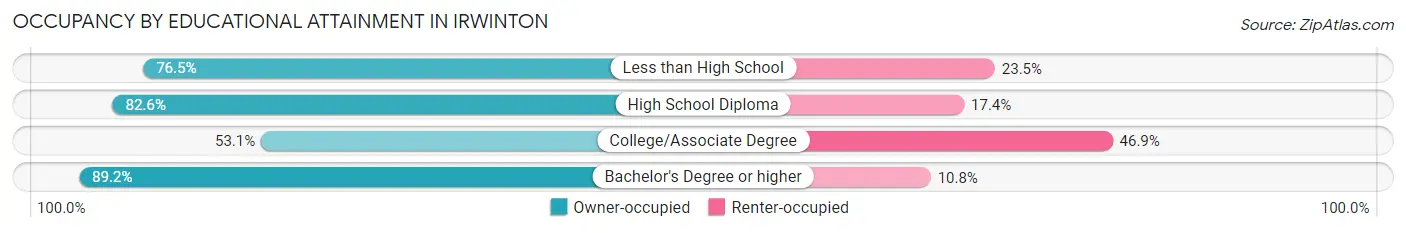
| Household Size | Owner-occupied | Renter-occupied |
| Less than High School | 13 (76.5%) | 4 (23.5%) |
| High School Diploma | 71 (82.6%) | 15 (17.4%) |
| College/Associate Degree | 34 (53.1%) | 30 (46.9%) |
| Bachelor's Degree or higher | 33 (89.2%) | 4 (10.8%) |
Occupancy by Age of Householder in Irwinton
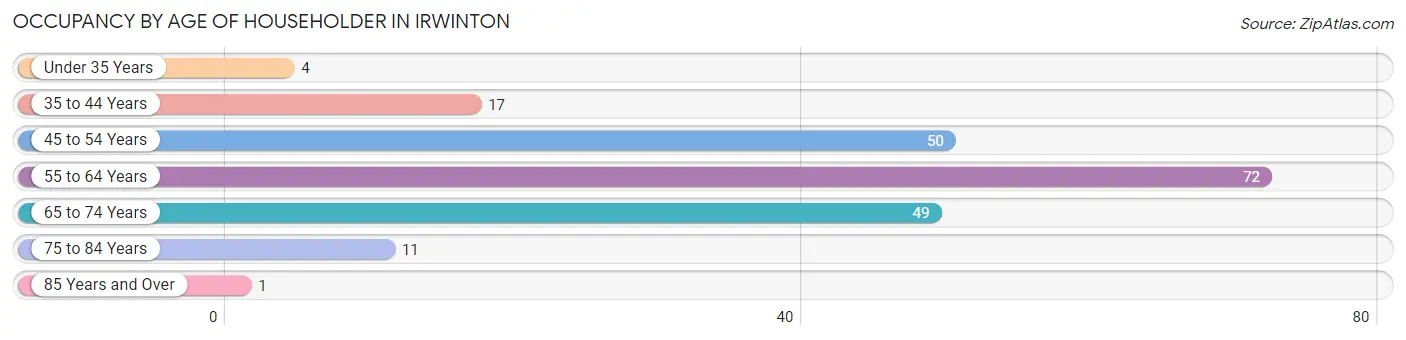
| Age Bracket | # Households | % Households |
| Under 35 Years | 4 | 2.0% |
| 35 to 44 Years | 17 | 8.3% |
| 45 to 54 Years | 50 | 24.5% |
| 55 to 64 Years | 72 | 35.3% |
| 65 to 74 Years | 49 | 24.0% |
| 75 to 84 Years | 11 | 5.4% |
| 85 Years and Over | 1 | 0.5% |
| Total | 204 | 100.0% |
Housing Finances in Irwinton
Median Income by Occupancy in Irwinton
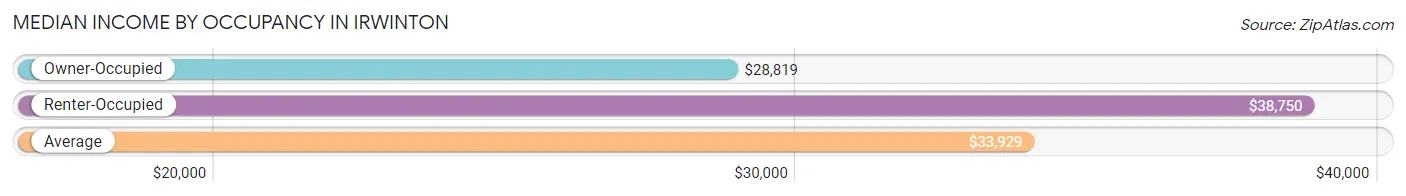
| Occupancy Type | # Households | Median Income |
| Owner-Occupied | 151 (74.0%) | $28,819 |
| Renter-Occupied | 53 (26.0%) | $38,750 |
| Average | 204 (100.0%) | $33,929 |
Occupancy by Householder Income Bracket in Irwinton
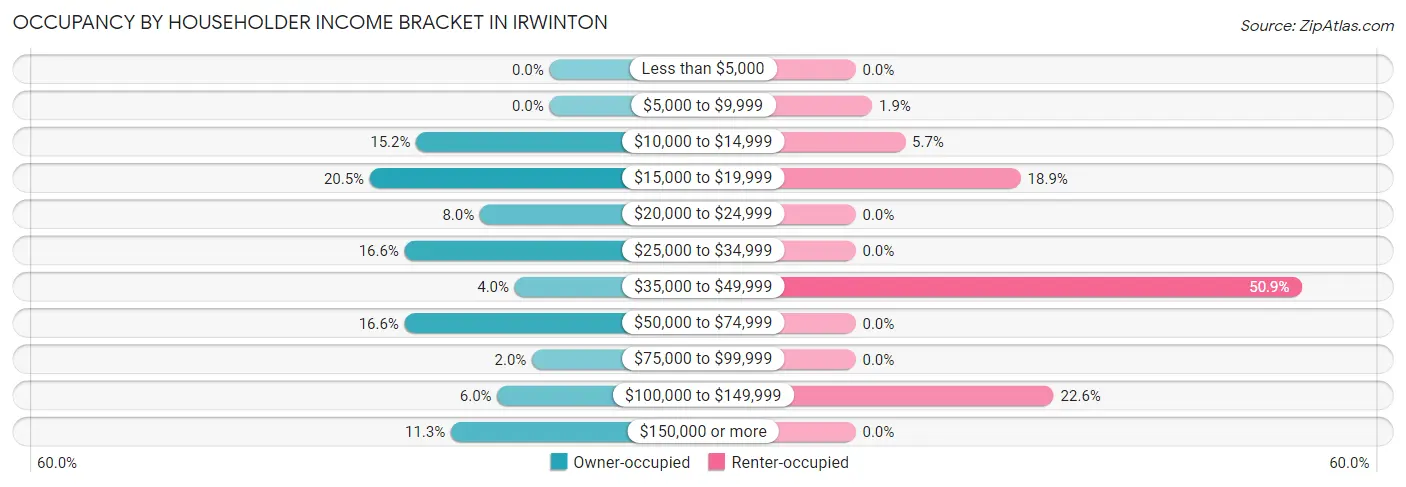
| Income Bracket | Owner-occupied | Renter-occupied |
| Less than $5,000 | 0 (0.0%) | 0 (0.0%) |
| $5,000 to $9,999 | 0 (0.0%) | 1 (1.9%) |
| $10,000 to $14,999 | 23 (15.2%) | 3 (5.7%) |
| $15,000 to $19,999 | 31 (20.5%) | 10 (18.9%) |
| $20,000 to $24,999 | 12 (8.0%) | 0 (0.0%) |
| $25,000 to $34,999 | 25 (16.6%) | 0 (0.0%) |
| $35,000 to $49,999 | 6 (4.0%) | 27 (50.9%) |
| $50,000 to $74,999 | 25 (16.6%) | 0 (0.0%) |
| $75,000 to $99,999 | 3 (2.0%) | 0 (0.0%) |
| $100,000 to $149,999 | 9 (6.0%) | 12 (22.6%) |
| $150,000 or more | 17 (11.3%) | 0 (0.0%) |
| Total | 151 (100.0%) | 53 (100.0%) |
Monthly Housing Cost Tiers in Irwinton
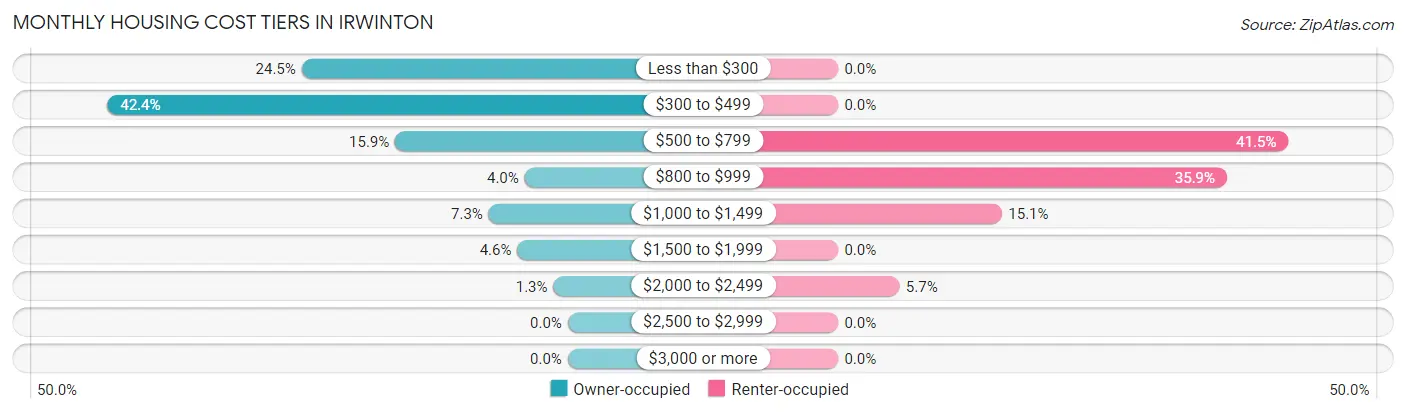
| Monthly Cost | Owner-occupied | Renter-occupied |
| Less than $300 | 37 (24.5%) | 0 (0.0%) |
| $300 to $499 | 64 (42.4%) | 0 (0.0%) |
| $500 to $799 | 24 (15.9%) | 22 (41.5%) |
| $800 to $999 | 6 (4.0%) | 19 (35.8%) |
| $1,000 to $1,499 | 11 (7.3%) | 8 (15.1%) |
| $1,500 to $1,999 | 7 (4.6%) | 0 (0.0%) |
| $2,000 to $2,499 | 2 (1.3%) | 3 (5.7%) |
| $2,500 to $2,999 | 0 (0.0%) | 0 (0.0%) |
| $3,000 or more | 0 (0.0%) | 0 (0.0%) |
| Total | 151 (100.0%) | 53 (100.0%) |
Physical Housing Characteristics in Irwinton
Housing Structures in Irwinton
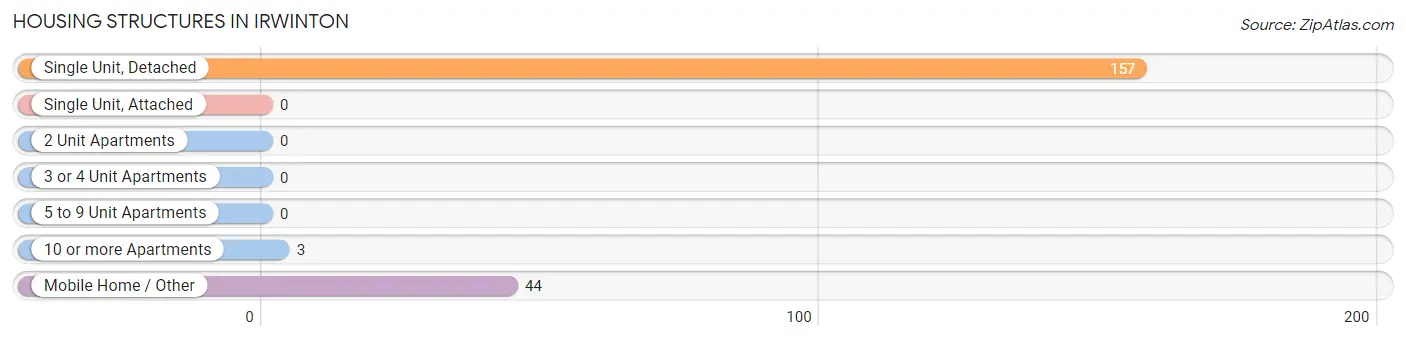
| Structure Type | # Housing Units | % Housing Units |
| Single Unit, Detached | 157 | 77.0% |
| Single Unit, Attached | 0 | 0.0% |
| 2 Unit Apartments | 0 | 0.0% |
| 3 or 4 Unit Apartments | 0 | 0.0% |
| 5 to 9 Unit Apartments | 0 | 0.0% |
| 10 or more Apartments | 3 | 1.5% |
| Mobile Home / Other | 44 | 21.6% |
| Total | 204 | 100.0% |
Housing Structures by Occupancy in Irwinton
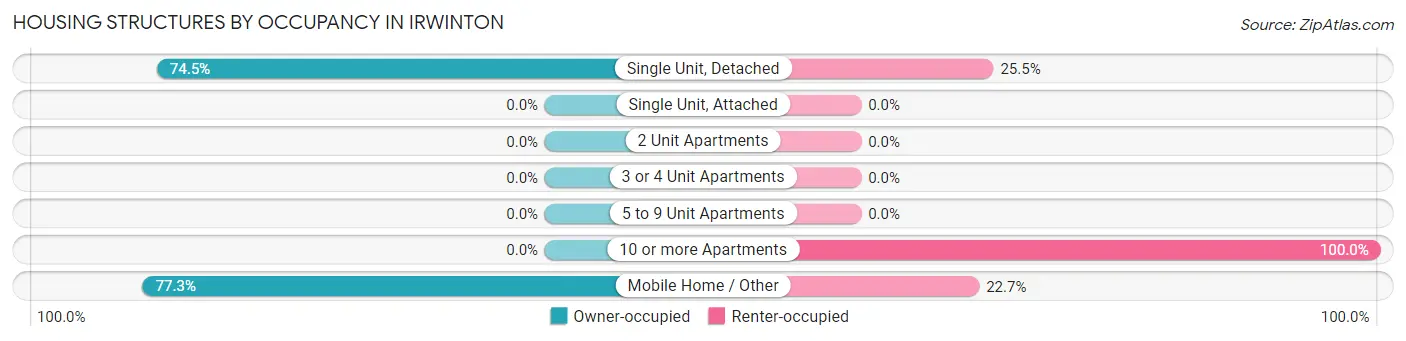
| Structure Type | Owner-occupied | Renter-occupied |
| Single Unit, Detached | 117 (74.5%) | 40 (25.5%) |
| Single Unit, Attached | 0 (0.0%) | 0 (0.0%) |
| 2 Unit Apartments | 0 (0.0%) | 0 (0.0%) |
| 3 or 4 Unit Apartments | 0 (0.0%) | 0 (0.0%) |
| 5 to 9 Unit Apartments | 0 (0.0%) | 0 (0.0%) |
| 10 or more Apartments | 0 (0.0%) | 3 (100.0%) |
| Mobile Home / Other | 34 (77.3%) | 10 (22.7%) |
| Total | 151 (74.0%) | 53 (26.0%) |
Housing Structures by Number of Rooms in Irwinton
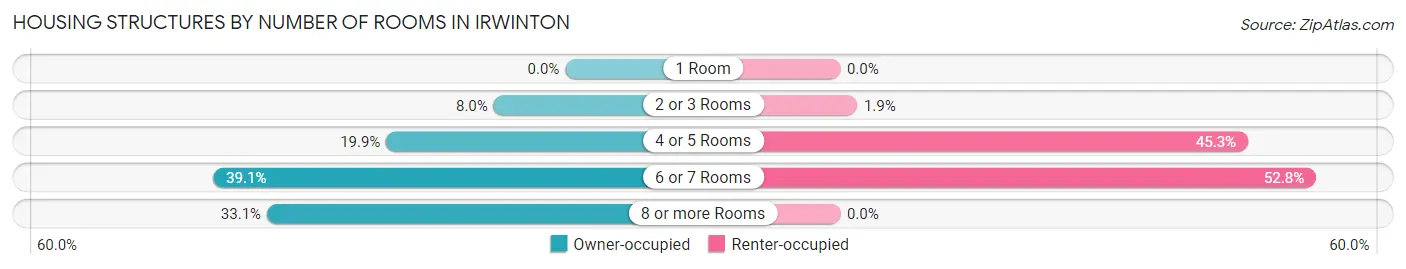
| Number of Rooms | Owner-occupied | Renter-occupied |
| 1 Room | 0 (0.0%) | 0 (0.0%) |
| 2 or 3 Rooms | 12 (8.0%) | 1 (1.9%) |
| 4 or 5 Rooms | 30 (19.9%) | 24 (45.3%) |
| 6 or 7 Rooms | 59 (39.1%) | 28 (52.8%) |
| 8 or more Rooms | 50 (33.1%) | 0 (0.0%) |
| Total | 151 (100.0%) | 53 (100.0%) |
Housing Structure by Heating Type in Irwinton
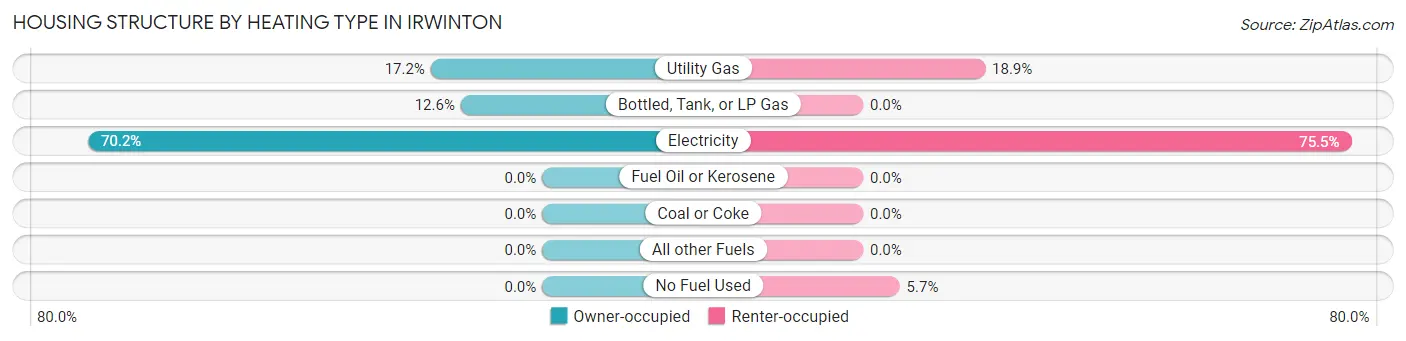
| Heating Type | Owner-occupied | Renter-occupied |
| Utility Gas | 26 (17.2%) | 10 (18.9%) |
| Bottled, Tank, or LP Gas | 19 (12.6%) | 0 (0.0%) |
| Electricity | 106 (70.2%) | 40 (75.5%) |
| Fuel Oil or Kerosene | 0 (0.0%) | 0 (0.0%) |
| Coal or Coke | 0 (0.0%) | 0 (0.0%) |
| All other Fuels | 0 (0.0%) | 0 (0.0%) |
| No Fuel Used | 0 (0.0%) | 3 (5.7%) |
| Total | 151 (100.0%) | 53 (100.0%) |
Household Vehicle Usage in Irwinton
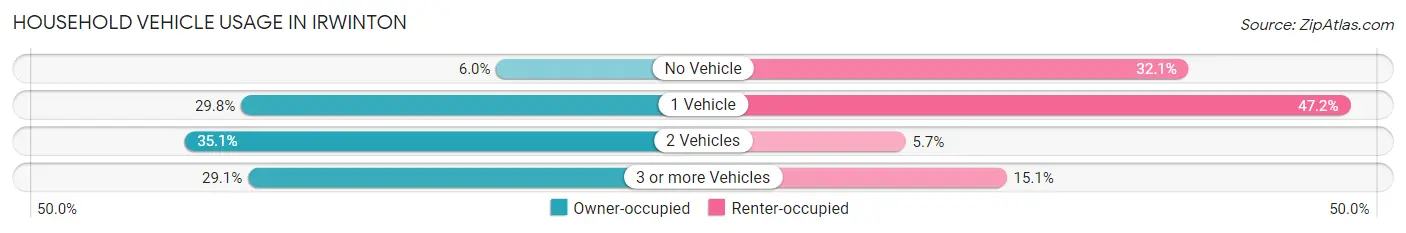
| Vehicles per Household | Owner-occupied | Renter-occupied |
| No Vehicle | 9 (6.0%) | 17 (32.1%) |
| 1 Vehicle | 45 (29.8%) | 25 (47.2%) |
| 2 Vehicles | 53 (35.1%) | 3 (5.7%) |
| 3 or more Vehicles | 44 (29.1%) | 8 (15.1%) |
| Total | 151 (100.0%) | 53 (100.0%) |
Real Estate & Mortgages in Irwinton
Real Estate and Mortgage Overview in Irwinton
| Characteristic | Without Mortgage | With Mortgage |
| Housing Units | 122 | 29 |
| Median Property Value | $82,900 | $121,300 |
| Median Household Income | $28,088 | $10 |
| Monthly Housing Costs | $362 | $0 |
| Real Estate Taxes | $735 | $0 |
Property Value by Mortgage Status in Irwinton
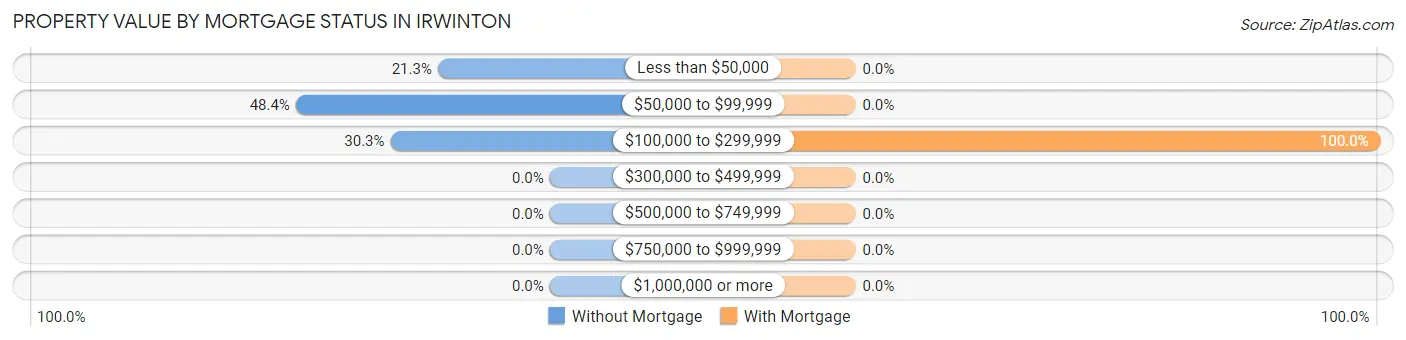
| Property Value | Without Mortgage | With Mortgage |
| Less than $50,000 | 26 (21.3%) | 0 (0.0%) |
| $50,000 to $99,999 | 59 (48.4%) | 0 (0.0%) |
| $100,000 to $299,999 | 37 (30.3%) | 29 (100.0%) |
| $300,000 to $499,999 | 0 (0.0%) | 0 (0.0%) |
| $500,000 to $749,999 | 0 (0.0%) | 0 (0.0%) |
| $750,000 to $999,999 | 0 (0.0%) | 0 (0.0%) |
| $1,000,000 or more | 0 (0.0%) | 0 (0.0%) |
| Total | 122 (100.0%) | 29 (100.0%) |
Household Income by Mortgage Status in Irwinton
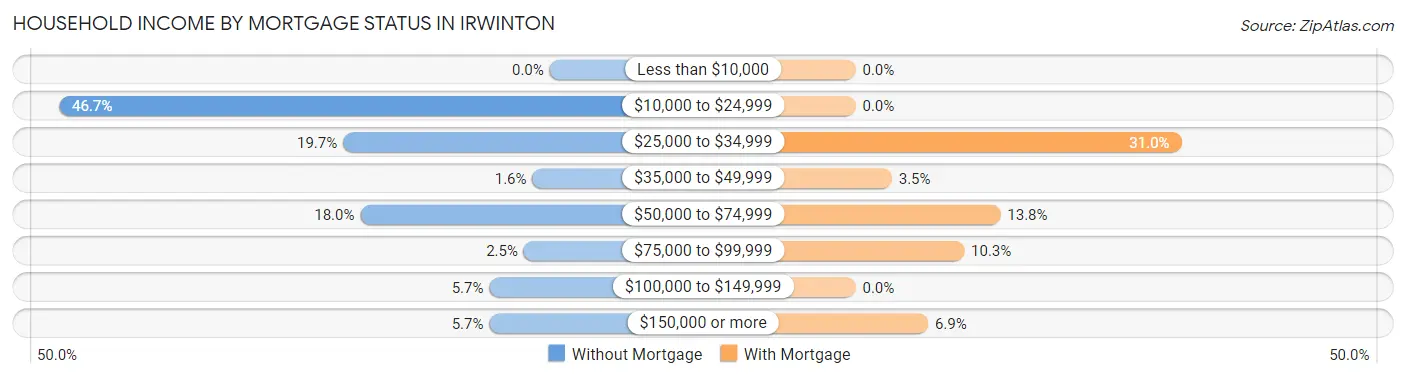
| Household Income | Without Mortgage | With Mortgage |
| Less than $10,000 | 0 (0.0%) | 0 (0.0%) |
| $10,000 to $24,999 | 57 (46.7%) | 0 (0.0%) |
| $25,000 to $34,999 | 24 (19.7%) | 9 (31.0%) |
| $35,000 to $49,999 | 2 (1.6%) | 1 (3.5%) |
| $50,000 to $74,999 | 22 (18.0%) | 4 (13.8%) |
| $75,000 to $99,999 | 3 (2.5%) | 3 (10.3%) |
| $100,000 to $149,999 | 7 (5.7%) | 0 (0.0%) |
| $150,000 or more | 7 (5.7%) | 2 (6.9%) |
| Total | 122 (100.0%) | 29 (100.0%) |
Property Value to Household Income Ratio in Irwinton
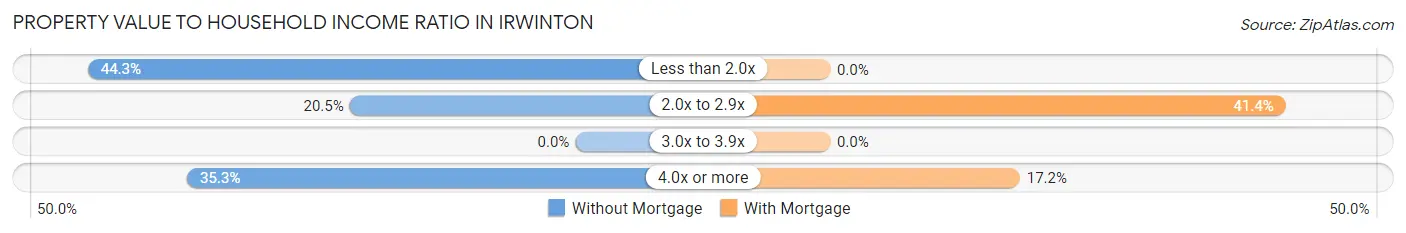
| Value-to-Income Ratio | Without Mortgage | With Mortgage |
| Less than 2.0x | 54 (44.3%) | 0 (0.0%) |
| 2.0x to 2.9x | 25 (20.5%) | 12 (41.4%) |
| 3.0x to 3.9x | 0 (0.0%) | 0 (0.0%) |
| 4.0x or more | 43 (35.2%) | 5 (17.2%) |
| Total | 122 (100.0%) | 29 (100.0%) |
Real Estate Taxes by Mortgage Status in Irwinton
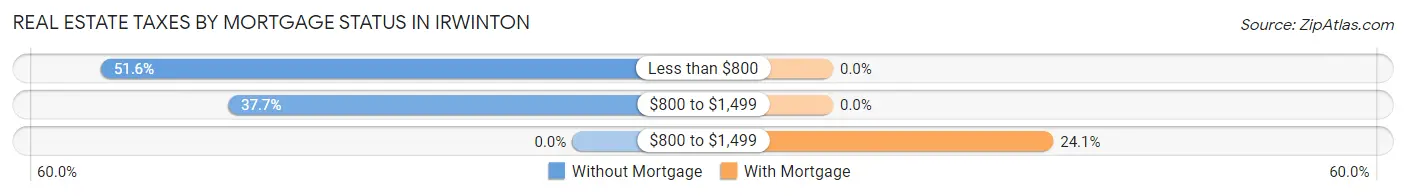
| Property Taxes | Without Mortgage | With Mortgage |
| Less than $800 | 63 (51.6%) | 0 (0.0%) |
| $800 to $1,499 | 46 (37.7%) | 0 (0.0%) |
| $800 to $1,499 | 0 (0.0%) | 7 (24.1%) |
| Total | 122 (100.0%) | 29 (100.0%) |
Health & Disability in Irwinton
Health Insurance Coverage by Age in Irwinton
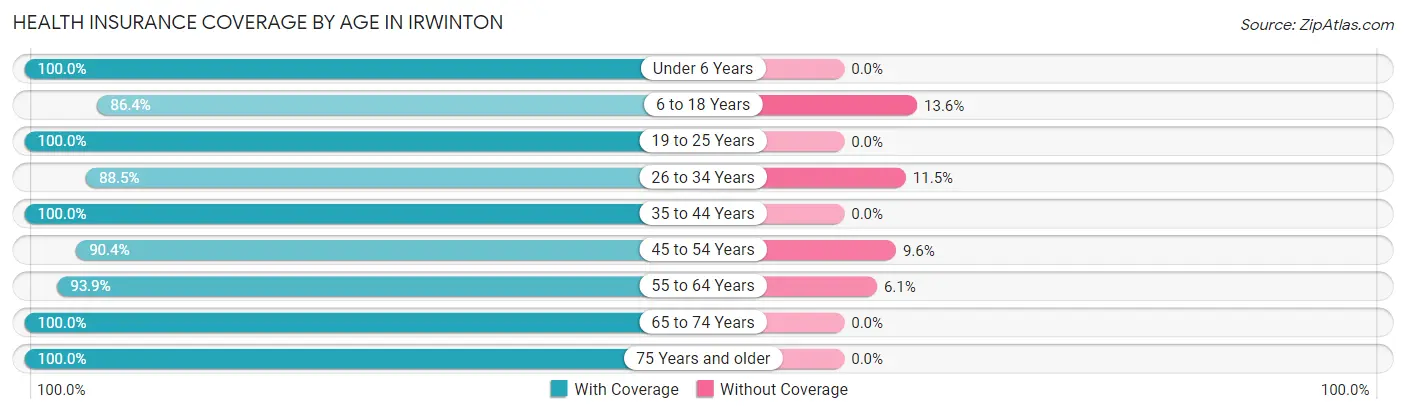
| Age Bracket | With Coverage | Without Coverage |
| Under 6 Years | 34 (100.0%) | 0 (0.0%) |
| 6 to 18 Years | 70 (86.4%) | 11 (13.6%) |
| 19 to 25 Years | 59 (100.0%) | 0 (0.0%) |
| 26 to 34 Years | 77 (88.5%) | 10 (11.5%) |
| 35 to 44 Years | 33 (100.0%) | 0 (0.0%) |
| 45 to 54 Years | 75 (90.4%) | 8 (9.6%) |
| 55 to 64 Years | 77 (93.9%) | 5 (6.1%) |
| 65 to 74 Years | 73 (100.0%) | 0 (0.0%) |
| 75 Years and older | 16 (100.0%) | 0 (0.0%) |
| Total | 514 (93.8%) | 34 (6.2%) |
Health Insurance Coverage by Citizenship Status in Irwinton
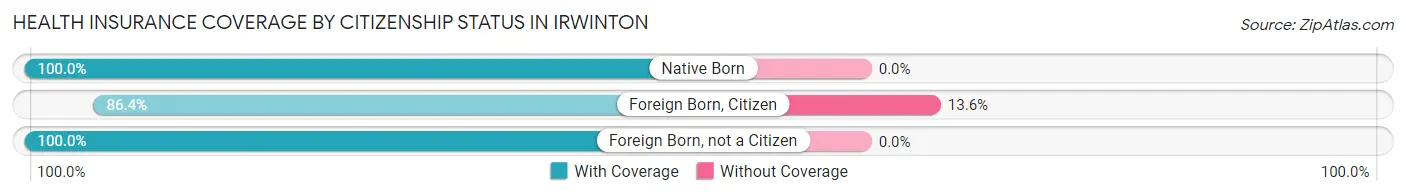
| Citizenship Status | With Coverage | Without Coverage |
| Native Born | 34 (100.0%) | 0 (0.0%) |
| Foreign Born, Citizen | 70 (86.4%) | 11 (13.6%) |
| Foreign Born, not a Citizen | 59 (100.0%) | 0 (0.0%) |
Health Insurance Coverage by Household Income in Irwinton
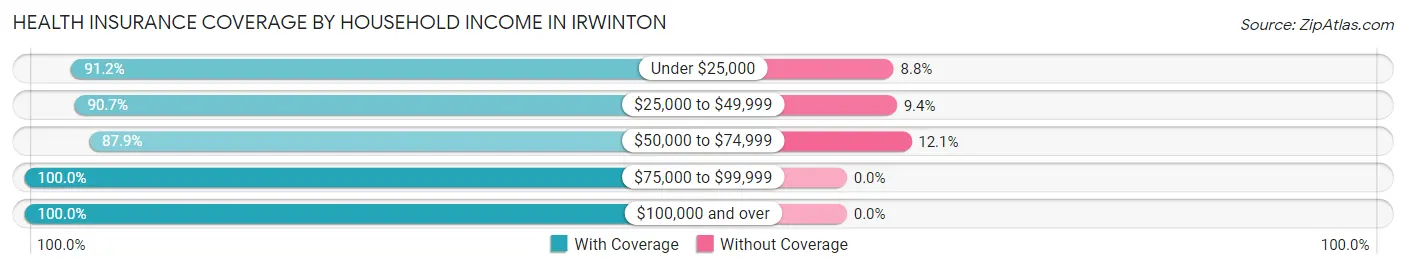
| Household Income | With Coverage | Without Coverage |
| Under $25,000 | 104 (91.2%) | 10 (8.8%) |
| $25,000 to $49,999 | 126 (90.6%) | 13 (9.3%) |
| $50,000 to $74,999 | 80 (87.9%) | 11 (12.1%) |
| $75,000 to $99,999 | 10 (100.0%) | 0 (0.0%) |
| $100,000 and over | 194 (100.0%) | 0 (0.0%) |
Public vs Private Health Insurance Coverage by Age in Irwinton
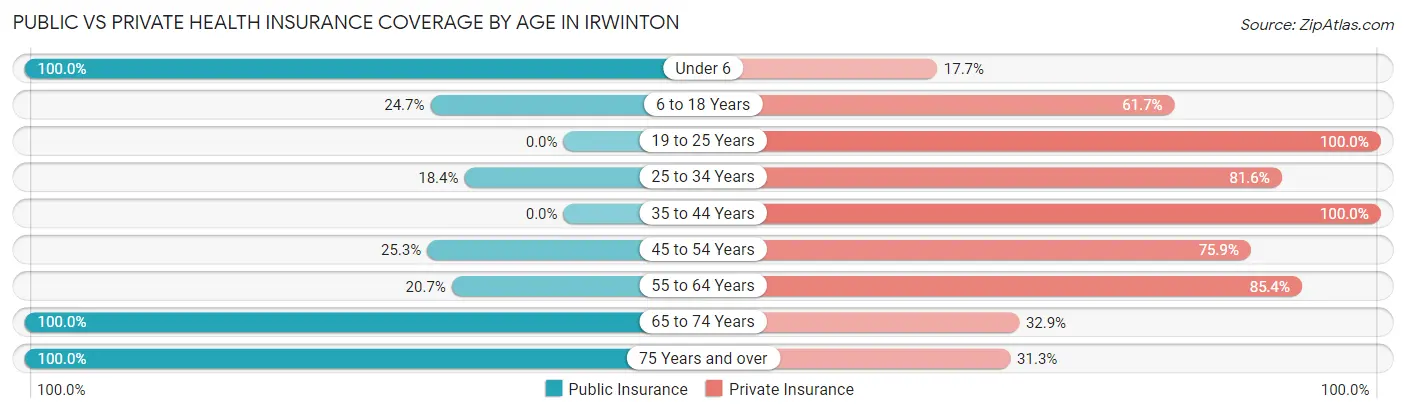
| Age Bracket | Public Insurance | Private Insurance |
| Under 6 | 34 (100.0%) | 6 (17.6%) |
| 6 to 18 Years | 20 (24.7%) | 50 (61.7%) |
| 19 to 25 Years | 0 (0.0%) | 59 (100.0%) |
| 25 to 34 Years | 16 (18.4%) | 71 (81.6%) |
| 35 to 44 Years | 0 (0.0%) | 33 (100.0%) |
| 45 to 54 Years | 21 (25.3%) | 63 (75.9%) |
| 55 to 64 Years | 17 (20.7%) | 70 (85.4%) |
| 65 to 74 Years | 73 (100.0%) | 24 (32.9%) |
| 75 Years and over | 16 (100.0%) | 5 (31.2%) |
| Total | 197 (35.9%) | 381 (69.5%) |
Disability Status by Sex by Age in Irwinton
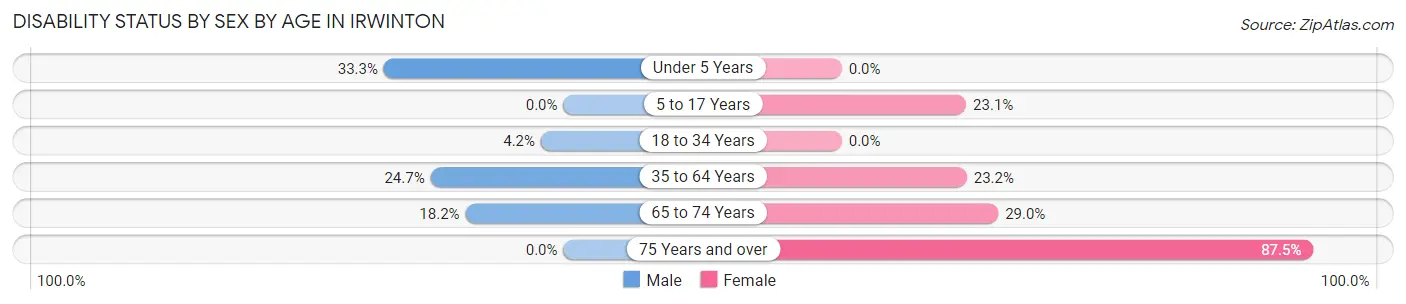
| Age Bracket | Male | Female |
| Under 5 Years | 6 (33.3%) | 0 (0.0%) |
| 5 to 17 Years | 0 (0.0%) | 9 (23.1%) |
| 18 to 34 Years | 2 (4.2%) | 0 (0.0%) |
| 35 to 64 Years | 18 (24.7%) | 29 (23.2%) |
| 65 to 74 Years | 2 (18.2%) | 18 (29.0%) |
| 75 Years and over | 0 (0.0%) | 14 (87.5%) |
Disability Class by Sex by Age in Irwinton
Disability Class: Hearing Difficulty
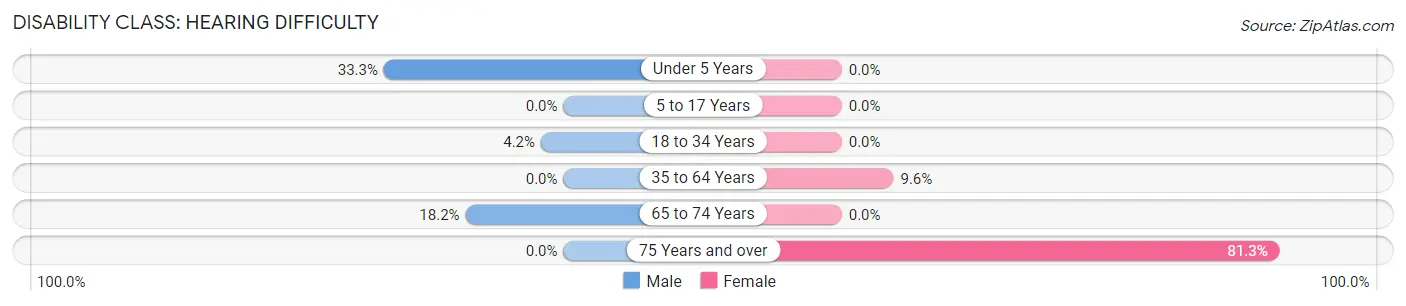
| Age Bracket | Male | Female |
| Under 5 Years | 6 (33.3%) | 0 (0.0%) |
| 5 to 17 Years | 0 (0.0%) | 0 (0.0%) |
| 18 to 34 Years | 2 (4.2%) | 0 (0.0%) |
| 35 to 64 Years | 0 (0.0%) | 12 (9.6%) |
| 65 to 74 Years | 2 (18.2%) | 0 (0.0%) |
| 75 Years and over | 0 (0.0%) | 13 (81.2%) |
Disability Class: Vision Difficulty
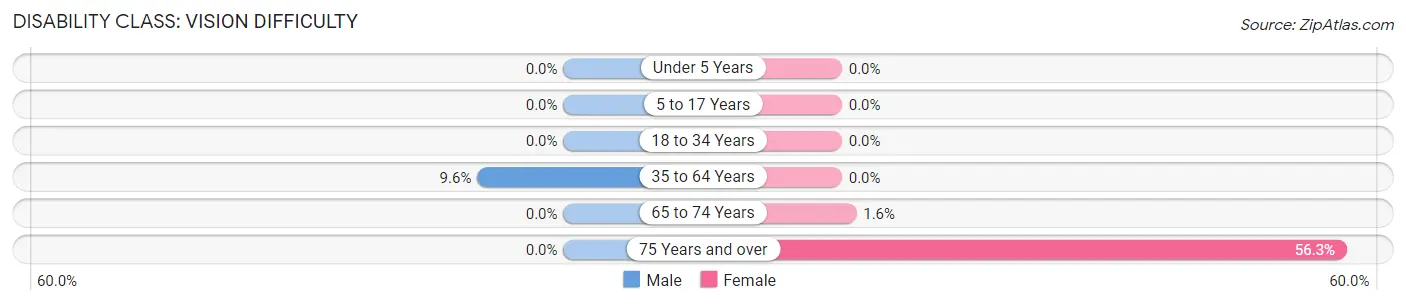
| Age Bracket | Male | Female |
| Under 5 Years | 0 (0.0%) | 0 (0.0%) |
| 5 to 17 Years | 0 (0.0%) | 0 (0.0%) |
| 18 to 34 Years | 0 (0.0%) | 0 (0.0%) |
| 35 to 64 Years | 7 (9.6%) | 0 (0.0%) |
| 65 to 74 Years | 0 (0.0%) | 1 (1.6%) |
| 75 Years and over | 0 (0.0%) | 9 (56.2%) |
Disability Class: Cognitive Difficulty
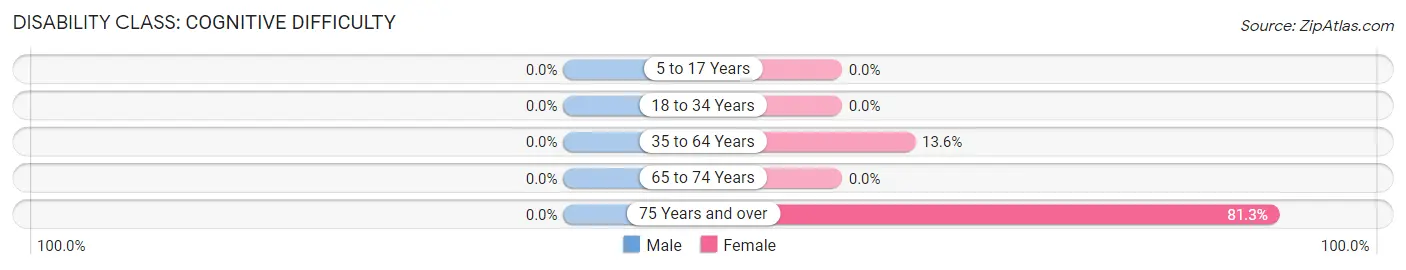
| Age Bracket | Male | Female |
| 5 to 17 Years | 0 (0.0%) | 0 (0.0%) |
| 18 to 34 Years | 0 (0.0%) | 0 (0.0%) |
| 35 to 64 Years | 0 (0.0%) | 17 (13.6%) |
| 65 to 74 Years | 0 (0.0%) | 0 (0.0%) |
| 75 Years and over | 0 (0.0%) | 13 (81.2%) |
Disability Class: Ambulatory Difficulty
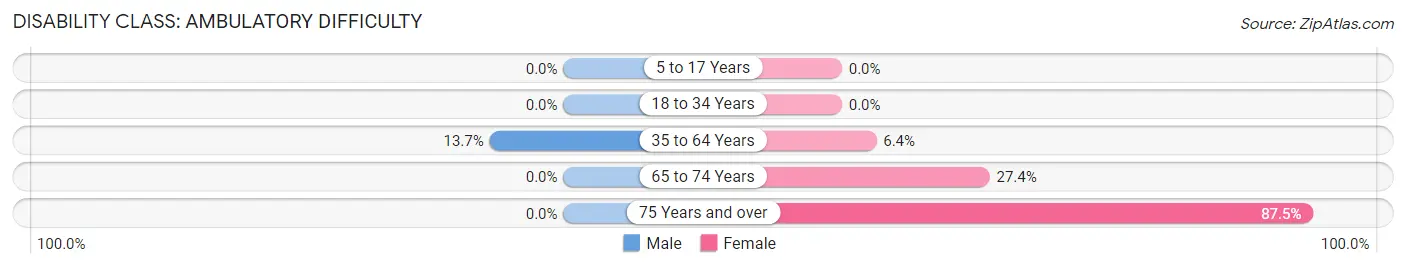
| Age Bracket | Male | Female |
| 5 to 17 Years | 0 (0.0%) | 0 (0.0%) |
| 18 to 34 Years | 0 (0.0%) | 0 (0.0%) |
| 35 to 64 Years | 10 (13.7%) | 8 (6.4%) |
| 65 to 74 Years | 0 (0.0%) | 17 (27.4%) |
| 75 Years and over | 0 (0.0%) | 14 (87.5%) |
Disability Class: Self-Care Difficulty
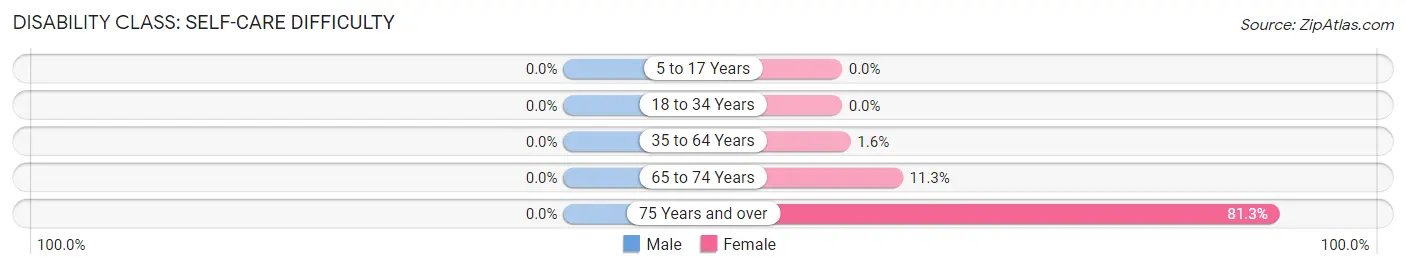
| Age Bracket | Male | Female |
| 5 to 17 Years | 0 (0.0%) | 0 (0.0%) |
| 18 to 34 Years | 0 (0.0%) | 0 (0.0%) |
| 35 to 64 Years | 0 (0.0%) | 2 (1.6%) |
| 65 to 74 Years | 0 (0.0%) | 7 (11.3%) |
| 75 Years and over | 0 (0.0%) | 13 (81.2%) |
Technology Access in Irwinton
Computing Device Access in Irwinton
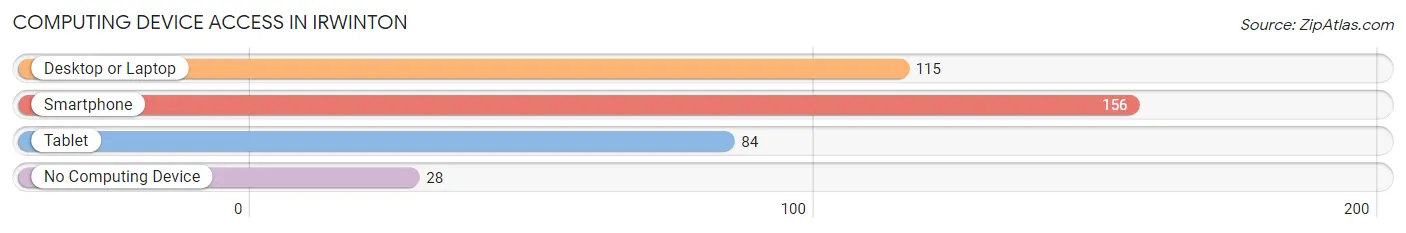
| Device Type | # Households | % Households |
| Desktop or Laptop | 115 | 56.4% |
| Smartphone | 156 | 76.5% |
| Tablet | 84 | 41.2% |
| No Computing Device | 28 | 13.7% |
| Total | 204 | 100.0% |
Internet Access in Irwinton
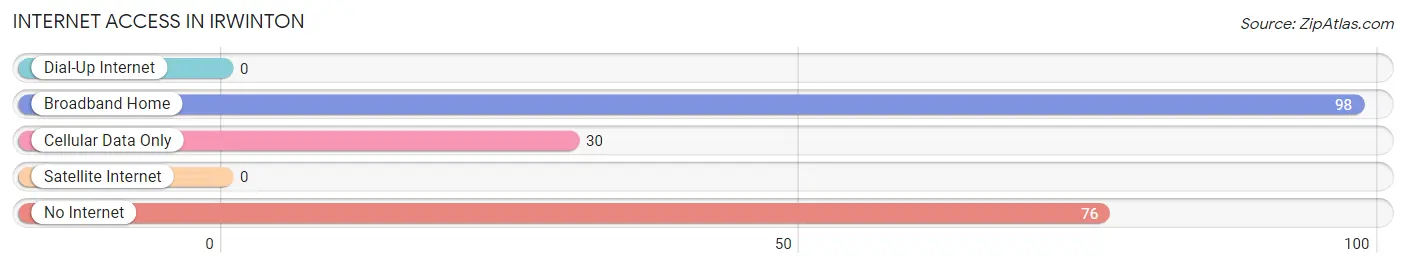
| Internet Type | # Households | % Households |
| Dial-Up Internet | 0 | 0.0% |
| Broadband Home | 98 | 48.0% |
| Cellular Data Only | 30 | 14.7% |
| Satellite Internet | 0 | 0.0% |
| No Internet | 76 | 37.2% |
| Total | 204 | 100.0% |
Irwinton Summary
Irwinton, Georgia is a small town located in Wilkinson County, Georgia. It is situated in the heart of the state, approximately 50 miles southeast of Macon and 90 miles east of Atlanta. The town was founded in 1812 and is named after General James Irvin, a Revolutionary War hero. The population of Irwinton was 1,072 as of the 2010 census.
Geography
Irwinton is located at 32°51'45"N 83°14'45"W (32.8625, -83.2458). The town is situated in the center of Wilkinson County, and is bordered by the cities of Gordon, Toomsboro, and Ivey. The town is located in the Piedmont region of Georgia, and is characterized by rolling hills and forests. The town is located in the Ocmulgee River watershed, and is situated near the Oconee River.
Economy
The economy of Irwinton is largely based on agriculture. The town is home to several farms, which produce a variety of crops, including cotton, corn, soybeans, and peanuts. The town is also home to several small businesses, including a grocery store, a hardware store, and a restaurant.
Demographics
As of the 2010 census, the population of Irwinton was 1,072. The racial makeup of the town was 79.2% White, 18.2% African American, 0.7% Native American, 0.2% Asian, 0.1% Pacific Islander, 0.7% from other races, and 0.9% from two or more races. Hispanic or Latino of any race were 1.7% of the population.
The median income for a household in Irwinton was $30,000, and the median income for a family was $35,000. The per capita income for the town was $14,000. About 18.2% of families and 22.2% of the population were below the poverty line, including 28.2% of those under age 18 and 16.7% of those age 65 or over.
History
Irwinton was founded in 1812 and named after General James Irvin, a Revolutionary War hero. The town was originally a trading post and was known as Irvin's Crossroads. The town was incorporated in 1820 and was the county seat of Wilkinson County until 1825, when the county seat was moved to Gordon.
In the late 19th century, Irwinton was a thriving agricultural center. The town was home to several cotton gins, a sawmill, and a gristmill. The town also had a hotel, a bank, and several stores.
In the early 20th century, Irwinton was a popular tourist destination. The town was home to several resorts, including the Irwinton Hotel, which was built in 1910. The hotel was destroyed by fire in the 1930s.
Today, Irwinton is a quiet, rural town. The town is home to several churches, a post office, and a few small businesses. The town is also home to the Irwinton Historic District, which is listed on the National Register of Historic Places.
Common Questions
What is Per Capita Income in Irwinton?
Per Capita income in Irwinton is $22,744.
What is the Median Family Income in Irwinton?
Median Family Income in Irwinton is $70,972.
What is the Median Household income in Irwinton?
Median Household Income in Irwinton is $33,929.
What is Income or Wage Gap in Irwinton?
Income or Wage Gap in Irwinton is 19.0%.
Women in Irwinton earn 81.0 cents for every dollar earned by a man.
What is Inequality or Gini Index in Irwinton?
Inequality or Gini Index in Irwinton is 0.46.
What is the Total Population of Irwinton?
Total Population of Irwinton is 572.
What is the Total Male Population of Irwinton?
Total Male Population of Irwinton is 209.
What is the Total Female Population of Irwinton?
Total Female Population of Irwinton is 363.
What is the Ratio of Males per 100 Females in Irwinton?
There are 57.58 Males per 100 Females in Irwinton.
What is the Ratio of Females per 100 Males in Irwinton?
There are 173.68 Females per 100 Males in Irwinton.
What is the Median Population Age in Irwinton?
Median Population Age in Irwinton is 40.3 Years.
What is the Average Family Size in Irwinton
Average Family Size in Irwinton is 4.7 People.
What is the Average Household Size in Irwinton
Average Household Size in Irwinton is 2.7 People.
How Large is the Labor Force in Irwinton?
There are 304 People in the Labor Forcein in Irwinton.
What is the Percentage of People in the Labor Force in Irwinton?
64.3% of People are in the Labor Force in Irwinton.
What is the Unemployment Rate in Irwinton?
Unemployment Rate in Irwinton is 11.5%.