Wadley, GA Map & Demographics
Wadley Map
Wadley Overview
$20,460
PER CAPITA INCOME
$43,750
AVG FAMILY INCOME
$36,406
AVG HOUSEHOLD INCOME
23.9%
WAGE / INCOME GAP [ % ]
76.1¢/ $1
WAGE / INCOME GAP [ $ ]
0.48
INEQUALITY / GINI INDEX
2,049
TOTAL POPULATION
816
MALE POPULATION
1,233
FEMALE POPULATION
66.18
MALES / 100 FEMALES
151.10
FEMALES / 100 MALES
36.4
MEDIAN AGE
4.0
AVG FAMILY SIZE
3.1
AVG HOUSEHOLD SIZE
704
LABOR FORCE [ PEOPLE ]
45.7%
PERCENT IN LABOR FORCE
10.1%
UNEMPLOYMENT RATE
Wadley Zip Codes
Wadley Area Codes
Income in Wadley
Income Overview in Wadley
Per Capita Income in Wadley is $20,460, while median incomes of families and households are $43,750 and $36,406 respectively.
| Characteristic | Number | Measure |
| Per Capita Income | 2,049 | $20,460 |
| Median Family Income | 418 | $43,750 |
| Mean Family Income | 418 | $65,315 |
| Median Household Income | 635 | $36,406 |
| Mean Household Income | 635 | $54,840 |
| Income Deficit | 418 | $0 |
| Wage / Income Gap (%) | 2,049 | 23.87% |
| Wage / Income Gap ($) | 2,049 | 76.13¢ per $1 |
| Gini / Inequality Index | 2,049 | 0.48 |
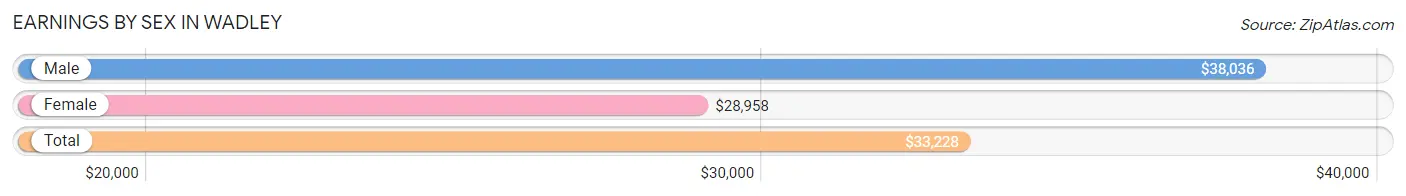
Earnings by Sex in Wadley
Average Earnings in Wadley are $33,228, $38,036 for men and $28,958 for women, a difference of 23.9%.
| Sex | Number | Average Earnings |
| Male | 309 (39.5%) | $38,036 |
| Female | 473 (60.5%) | $28,958 |
| Total | 782 (100.0%) | $33,228 |
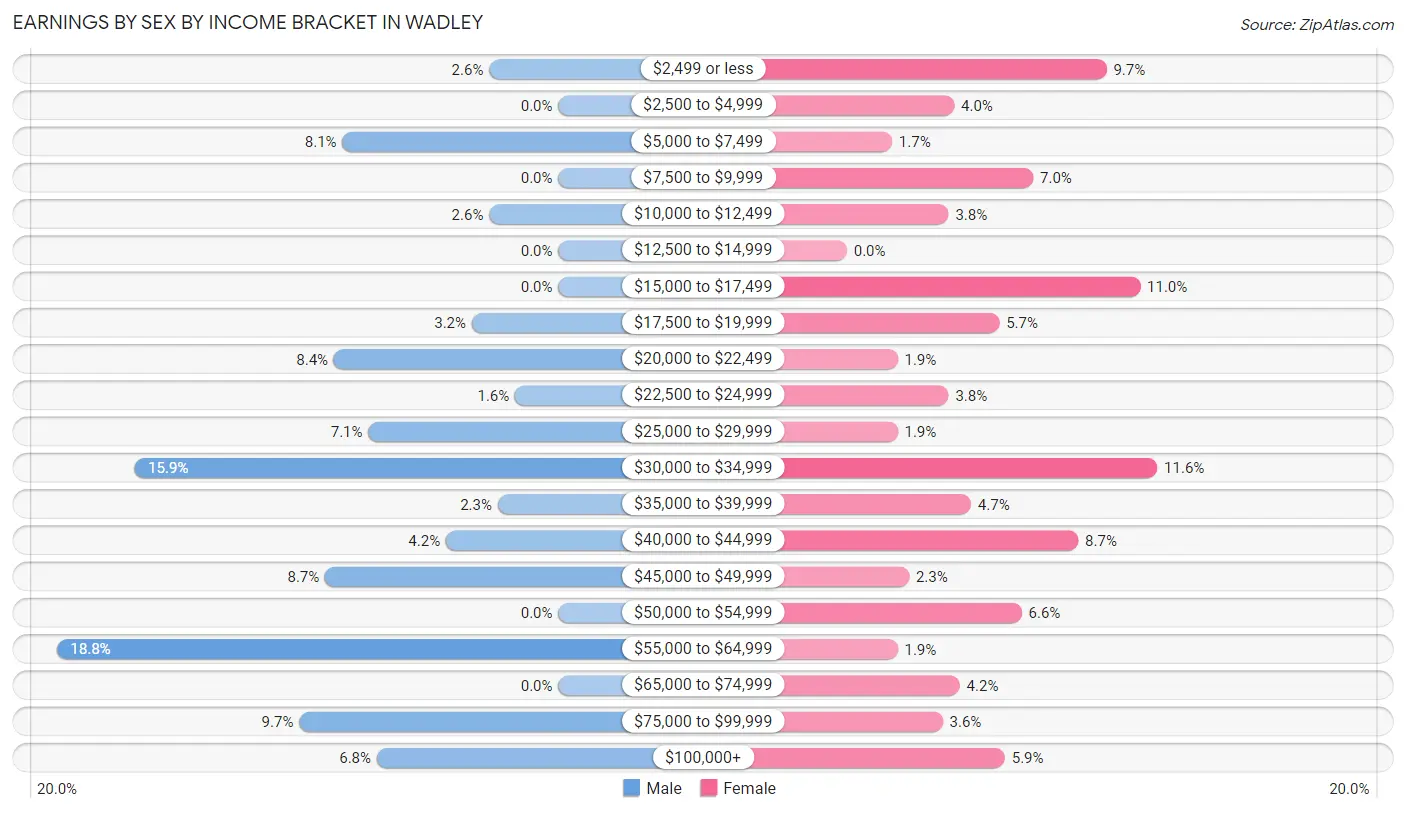
Earnings by Sex by Income Bracket in Wadley
The most common earnings brackets in Wadley are $55,000 to $64,999 for men (58 | 18.8%) and $30,000 to $34,999 for women (55 | 11.6%).
| Income | Male | Female |
| $2,499 or less | 8 (2.6%) | 46 (9.7%) |
| $2,500 to $4,999 | 0 (0.0%) | 19 (4.0%) |
| $5,000 to $7,499 | 25 (8.1%) | 8 (1.7%) |
| $7,500 to $9,999 | 0 (0.0%) | 33 (7.0%) |
| $10,000 to $12,499 | 8 (2.6%) | 18 (3.8%) |
| $12,500 to $14,999 | 0 (0.0%) | 0 (0.0%) |
| $15,000 to $17,499 | 0 (0.0%) | 52 (11.0%) |
| $17,500 to $19,999 | 10 (3.2%) | 27 (5.7%) |
| $20,000 to $22,499 | 26 (8.4%) | 9 (1.9%) |
| $22,500 to $24,999 | 5 (1.6%) | 18 (3.8%) |
| $25,000 to $29,999 | 22 (7.1%) | 9 (1.9%) |
| $30,000 to $34,999 | 49 (15.9%) | 55 (11.6%) |
| $35,000 to $39,999 | 7 (2.3%) | 22 (4.6%) |
| $40,000 to $44,999 | 13 (4.2%) | 41 (8.7%) |
| $45,000 to $49,999 | 27 (8.7%) | 11 (2.3%) |
| $50,000 to $54,999 | 0 (0.0%) | 31 (6.6%) |
| $55,000 to $64,999 | 58 (18.8%) | 9 (1.9%) |
| $65,000 to $74,999 | 0 (0.0%) | 20 (4.2%) |
| $75,000 to $99,999 | 30 (9.7%) | 17 (3.6%) |
| $100,000+ | 21 (6.8%) | 28 (5.9%) |
| Total | 309 (100.0%) | 473 (100.0%) |
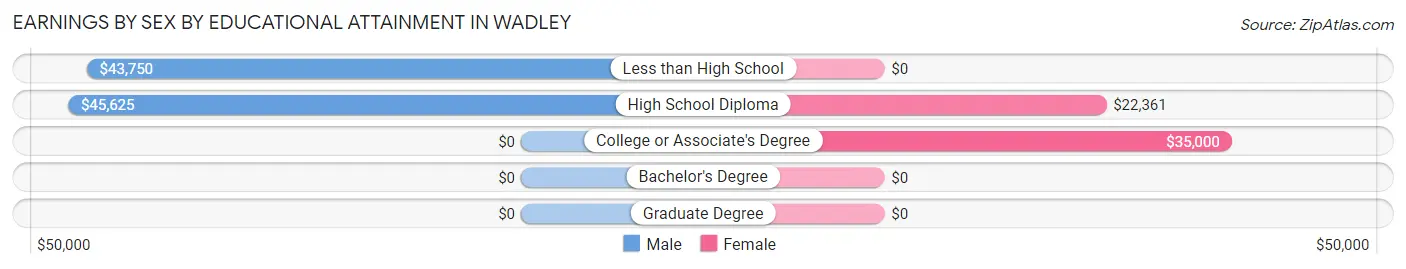
Earnings by Sex by Educational Attainment in Wadley
Average earnings in Wadley are $43,750 for men and $33,864 for women, a difference of 22.6%. Men with an educational attainment of high school diploma enjoy the highest average annual earnings of $45,625, while those with less than high school education earn the least with $43,750. Women with an educational attainment of college or associate's degree earn the most with the average annual earnings of $35,000, while those with high school diploma education have the smallest earnings of $22,361.
| Educational Attainment | Male Income | Female Income |
| Less than High School | $43,750 | $0 |
| High School Diploma | $45,625 | $22,361 |
| College or Associate's Degree | - | - |
| Bachelor's Degree | - | - |
| Graduate Degree | - | - |
| Total | $43,750 | $33,864 |
Family Income in Wadley
Family Income Brackets in Wadley
According to the Wadley family income data, there are 91 families falling into the $50,000 to $74,999 income range, which is the most common income bracket and makes up 21.8% of all families. Conversely, the $150,000 to $199,999 income bracket is the least frequent group with only 5 families (1.2%) belonging to this category.
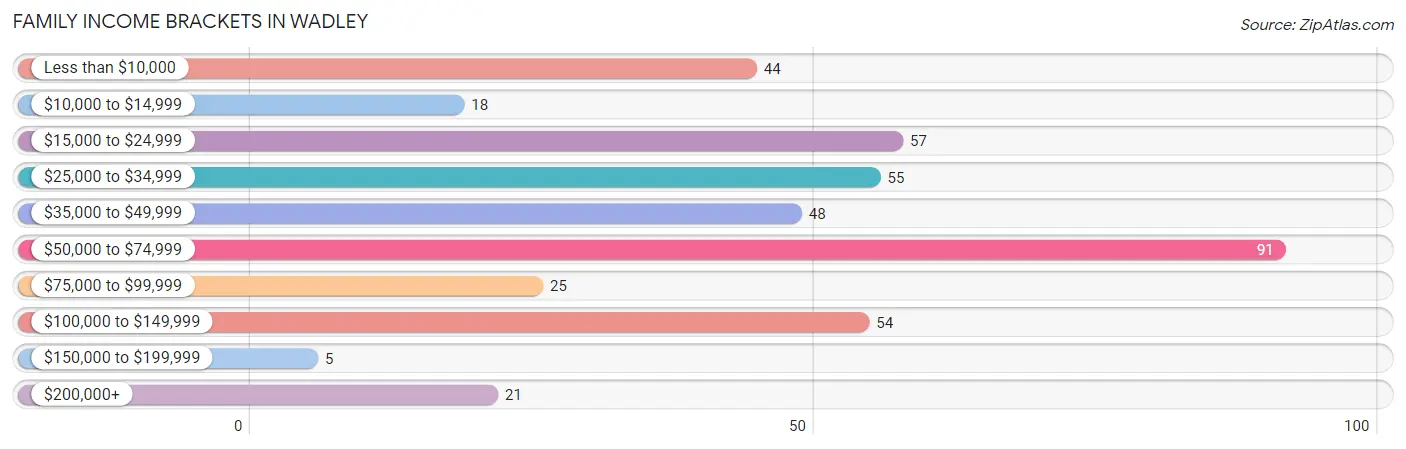
| Income Bracket | # Families | % Families |
| Less than $10,000 | 44 | 10.5% |
| $10,000 to $14,999 | 18 | 4.3% |
| $15,000 to $24,999 | 57 | 13.6% |
| $25,000 to $34,999 | 55 | 13.2% |
| $35,000 to $49,999 | 48 | 11.5% |
| $50,000 to $74,999 | 91 | 21.8% |
| $75,000 to $99,999 | 25 | 6.0% |
| $100,000 to $149,999 | 54 | 12.9% |
| $150,000 to $199,999 | 5 | 1.2% |
| $200,000+ | 21 | 5.0% |
Family Income by Famaliy Size in Wadley
4-person families (106 | 25.4%) account for the highest median family income in Wadley with $57,941 per family, while 2-person families (164 | 39.2%) have the highest median income of $21,172 per family member.
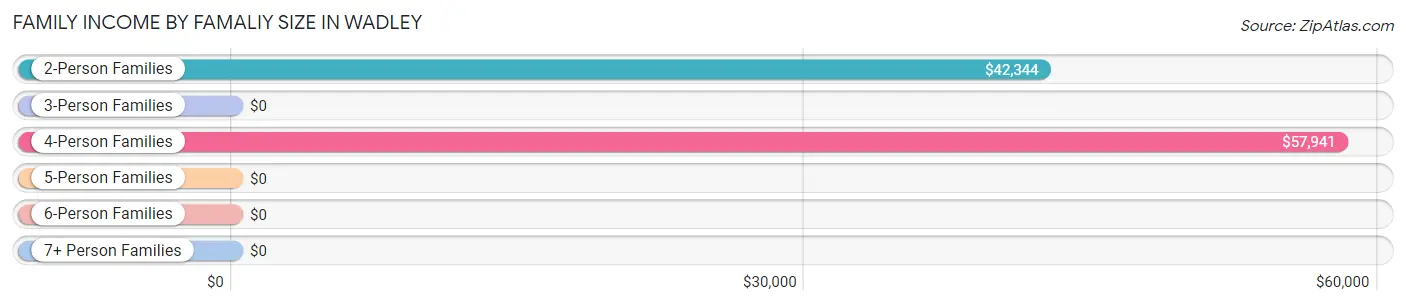
| Income Bracket | # Families | Median Income |
| 2-Person Families | 164 (39.2%) | $42,344 |
| 3-Person Families | 91 (21.8%) | $0 |
| 4-Person Families | 106 (25.4%) | $57,941 |
| 5-Person Families | 27 (6.5%) | $0 |
| 6-Person Families | 13 (3.1%) | $0 |
| 7+ Person Families | 17 (4.1%) | $0 |
| Total | 418 (100.0%) | $43,750 |
Family Income by Number of Earners in Wadley
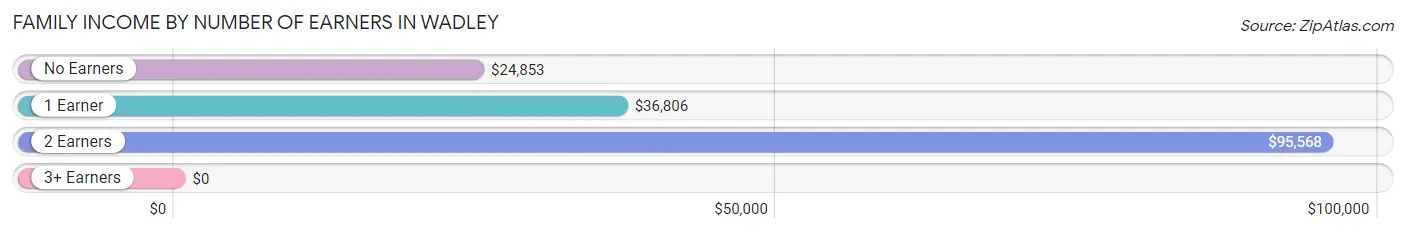
| Number of Earners | # Families | Median Income |
| No Earners | 112 (26.8%) | $24,853 |
| 1 Earner | 159 (38.0%) | $36,806 |
| 2 Earners | 115 (27.5%) | $95,568 |
| 3+ Earners | 32 (7.7%) | $0 |
| Total | 418 (100.0%) | $43,750 |
Household Income in Wadley
Household Income Brackets in Wadley
With 120 households falling in the category, the $15,000 to $24,999 income range is the most frequent in Wadley, accounting for 18.9% of all households. In contrast, only 5 households (0.8%) fall into the $150,000 to $199,999 income bracket, making it the least populous group.
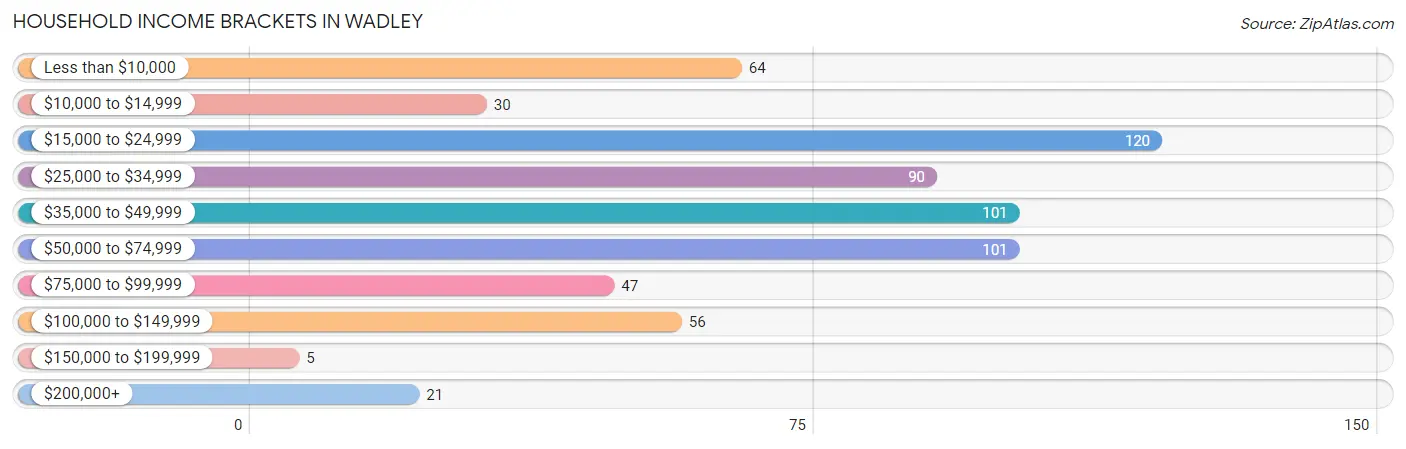
| Income Bracket | # Households | % Households |
| Less than $10,000 | 64 | 10.1% |
| $10,000 to $14,999 | 30 | 4.7% |
| $15,000 to $24,999 | 120 | 18.9% |
| $25,000 to $34,999 | 90 | 14.2% |
| $35,000 to $49,999 | 101 | 15.9% |
| $50,000 to $74,999 | 101 | 15.9% |
| $75,000 to $99,999 | 47 | 7.4% |
| $100,000 to $149,999 | 56 | 8.8% |
| $150,000 to $199,999 | 5 | 0.8% |
| $200,000+ | 21 | 3.3% |
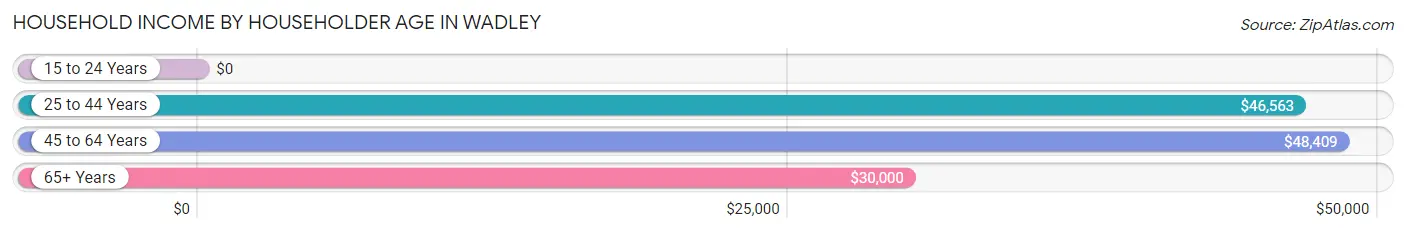
Household Income by Householder Age in Wadley
The median household income in Wadley is $36,406, with the highest median household income of $48,409 found in the 45 to 64 years age bracket for the primary householder. A total of 236 households (37.2%) fall into this category.
| Income Bracket | # Households | Median Income |
| 15 to 24 Years | 0 (0.0%) | $0 |
| 25 to 44 Years | 187 (29.4%) | $46,563 |
| 45 to 64 Years | 236 (37.2%) | $48,409 |
| 65+ Years | 212 (33.4%) | $30,000 |
| Total | 635 (100.0%) | $36,406 |
Poverty in Wadley
Income Below Poverty by Sex and Age in Wadley
With 23.8% poverty level for males and 24.9% for females among the residents of Wadley, 25 to 34 year old males and 5 year old females are the most vulnerable to poverty, with 21 males (56.8%) and 22 females (100.0%) in their respective age groups living below the poverty level.
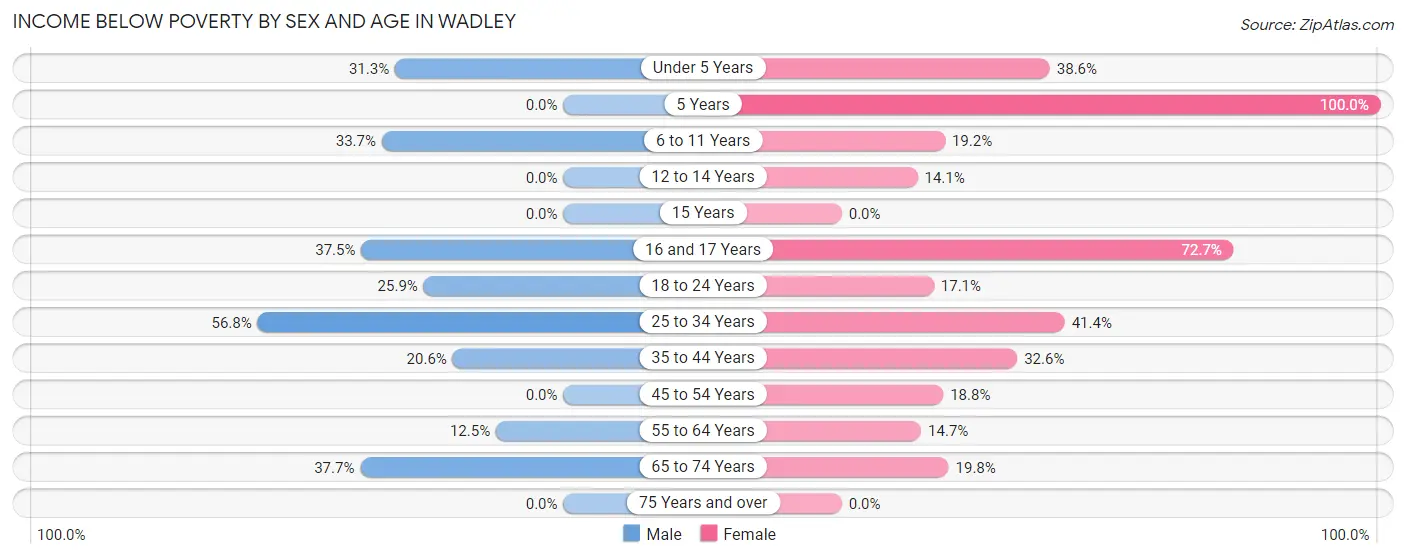
| Age Bracket | Male | Female |
| Under 5 Years | 20 (31.2%) | 56 (38.6%) |
| 5 Years | 0 (0.0%) | 22 (100.0%) |
| 6 to 11 Years | 31 (33.7%) | 18 (19.2%) |
| 12 to 14 Years | 0 (0.0%) | 9 (14.1%) |
| 15 Years | 0 (0.0%) | 0 (0.0%) |
| 16 and 17 Years | 12 (37.5%) | 16 (72.7%) |
| 18 to 24 Years | 42 (25.9%) | 20 (17.1%) |
| 25 to 34 Years | 21 (56.8%) | 36 (41.4%) |
| 35 to 44 Years | 30 (20.5%) | 42 (32.6%) |
| 45 to 54 Years | 0 (0.0%) | 29 (18.8%) |
| 55 to 64 Years | 10 (12.5%) | 19 (14.7%) |
| 65 to 74 Years | 23 (37.7%) | 23 (19.8%) |
| 75 Years and over | 0 (0.0%) | 0 (0.0%) |
| Total | 189 (23.8%) | 290 (24.9%) |
Income Above Poverty by Sex and Age in Wadley
According to the poverty statistics in Wadley, males aged 15 years and females aged 75 years and over are the age groups that are most secure financially, with 100.0% of males and 100.0% of females in these age groups living above the poverty line.
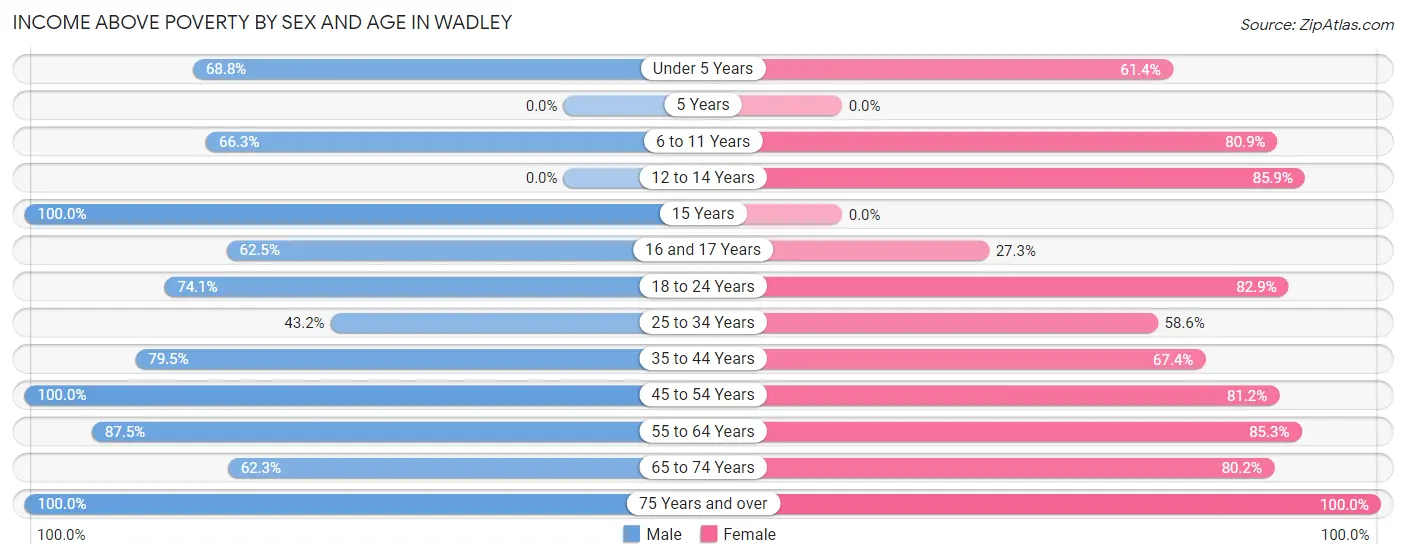
| Age Bracket | Male | Female |
| Under 5 Years | 44 (68.8%) | 89 (61.4%) |
| 5 Years | 0 (0.0%) | 0 (0.0%) |
| 6 to 11 Years | 61 (66.3%) | 76 (80.8%) |
| 12 to 14 Years | 0 (0.0%) | 55 (85.9%) |
| 15 Years | 28 (100.0%) | 0 (0.0%) |
| 16 and 17 Years | 20 (62.5%) | 6 (27.3%) |
| 18 to 24 Years | 120 (74.1%) | 97 (82.9%) |
| 25 to 34 Years | 16 (43.2%) | 51 (58.6%) |
| 35 to 44 Years | 116 (79.4%) | 87 (67.4%) |
| 45 to 54 Years | 88 (100.0%) | 125 (81.2%) |
| 55 to 64 Years | 70 (87.5%) | 110 (85.3%) |
| 65 to 74 Years | 38 (62.3%) | 93 (80.2%) |
| 75 Years and over | 4 (100.0%) | 86 (100.0%) |
| Total | 605 (76.2%) | 875 (75.1%) |
Income Below Poverty Among Married-Couple Families in Wadley
The poverty statistics for married-couple families in Wadley show that 12.2% or 24 of the total 197 families live below the poverty line. Families with no children have the highest poverty rate of 15.2%, comprising of 14 families. On the other hand, families with 3 or 4 children have the lowest poverty rate of 0.0%, which includes 0 families.
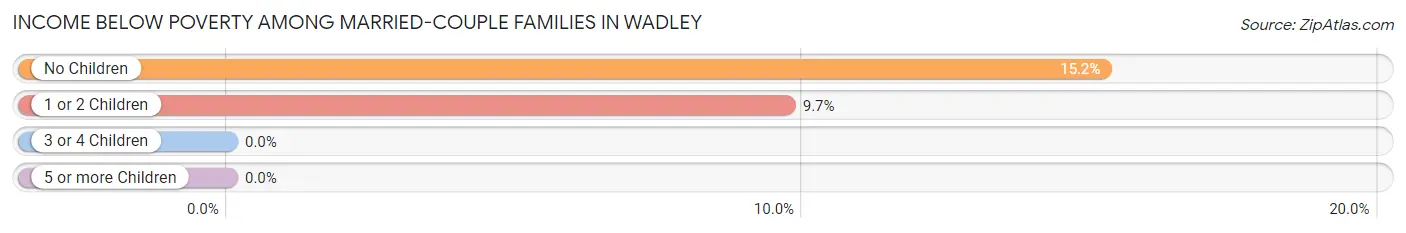
| Children | Above Poverty | Below Poverty |
| No Children | 78 (84.8%) | 14 (15.2%) |
| 1 or 2 Children | 93 (90.3%) | 10 (9.7%) |
| 3 or 4 Children | 2 (100.0%) | 0 (0.0%) |
| 5 or more Children | 0 (0.0%) | 0 (0.0%) |
| Total | 173 (87.8%) | 24 (12.2%) |
Income Below Poverty Among Single-Parent Households in Wadley
According to the poverty data in Wadley, 26.3% or 10 single-father households and 33.3% or 61 single-mother households are living below the poverty line. Among single-father households, those with no children have the highest poverty rate, with 10 households (100.0%) experiencing poverty. Likewise, among single-mother households, those with 3 or 4 children have the highest poverty rate, with 25 households (100.0%) falling below the poverty line.
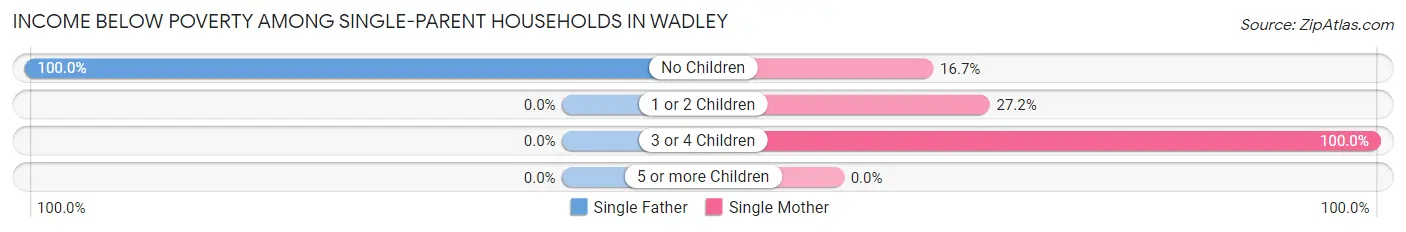
| Children | Single Father | Single Mother |
| No Children | 10 (100.0%) | 11 (16.7%) |
| 1 or 2 Children | 0 (0.0%) | 25 (27.2%) |
| 3 or 4 Children | 0 (0.0%) | 25 (100.0%) |
| 5 or more Children | 0 (0.0%) | 0 (0.0%) |
| Total | 10 (26.3%) | 61 (33.3%) |
Income Below Poverty Among Married-Couple vs Single-Parent Households in Wadley
The poverty data for Wadley shows that 24 of the married-couple family households (12.2%) and 71 of the single-parent households (32.1%) are living below the poverty level. Within the married-couple family households, those with no children have the highest poverty rate, with 14 households (15.2%) falling below the poverty line. Among the single-parent households, those with 3 or 4 children have the highest poverty rate, with 25 household (100.0%) living below poverty.
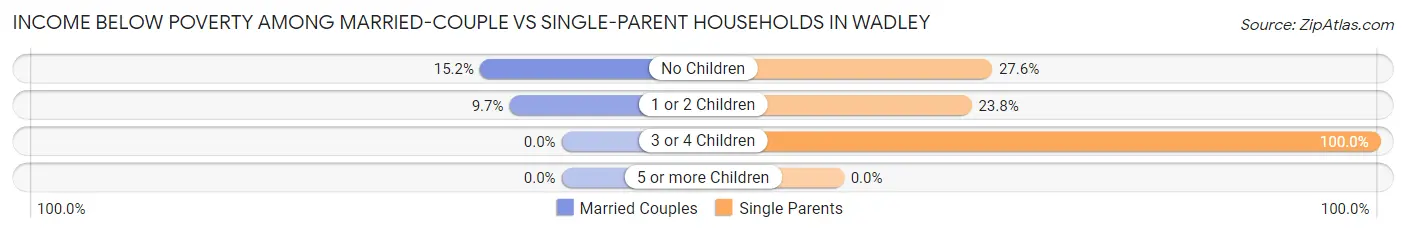
| Children | Married-Couple Families | Single-Parent Households |
| No Children | 14 (15.2%) | 21 (27.6%) |
| 1 or 2 Children | 10 (9.7%) | 25 (23.8%) |
| 3 or 4 Children | 0 (0.0%) | 25 (100.0%) |
| 5 or more Children | 0 (0.0%) | 0 (0.0%) |
| Total | 24 (12.2%) | 71 (32.1%) |
Race in Wadley
The most populous races in Wadley are Black / African American (1,691 | 82.5%), White / Caucasian (311 | 15.2%), and Hispanic or Latino (189 | 9.2%).
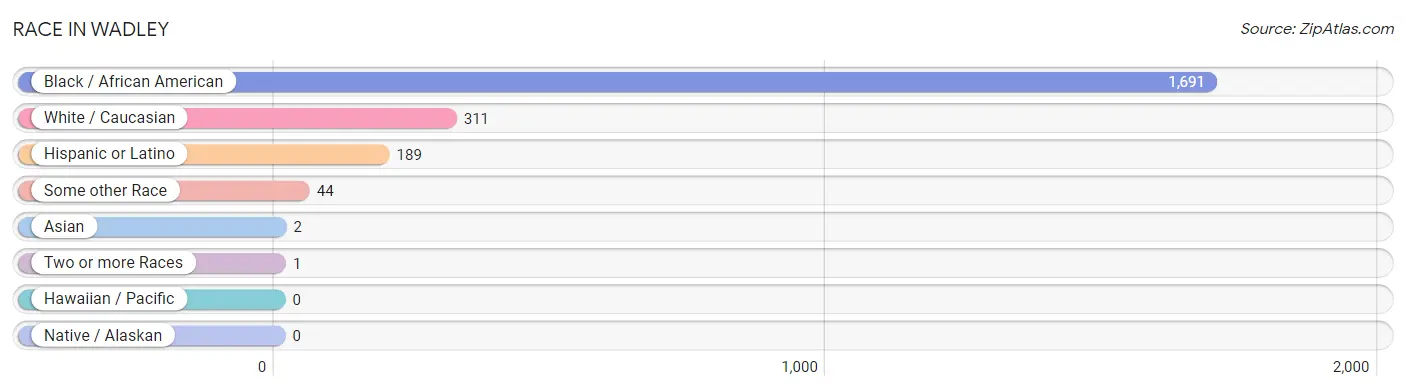
| Race | # Population | % Population |
| Asian | 2 | 0.1% |
| Black / African American | 1,691 | 82.5% |
| Hawaiian / Pacific | 0 | 0.0% |
| Hispanic or Latino | 189 | 9.2% |
| Native / Alaskan | 0 | 0.0% |
| White / Caucasian | 311 | 15.2% |
| Two or more Races | 1 | 0.1% |
| Some other Race | 44 | 2.1% |
| Total | 2,049 | 100.0% |
Ancestry in Wadley
The most populous ancestries reported in Wadley are Mexican (116 | 5.7%), American (76 | 3.7%), Spanish (73 | 3.6%), English (43 | 2.1%), and Irish (29 | 1.4%), together accounting for 16.4% of all Wadley residents.
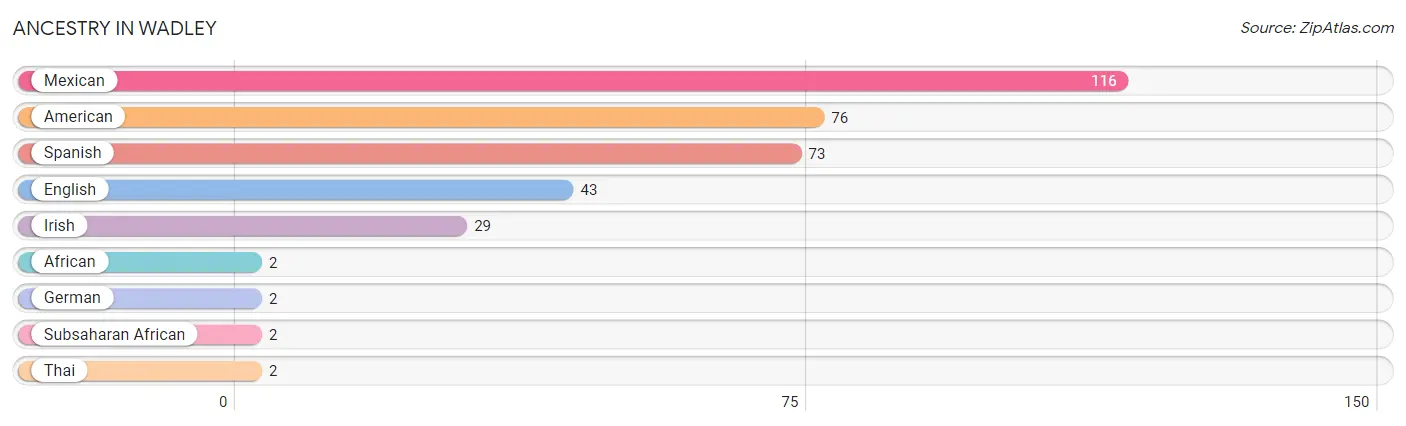
| Ancestry | # Population | % Population |
| African | 2 | 0.1% |
| American | 76 | 3.7% |
| English | 43 | 2.1% |
| German | 2 | 0.1% |
| Irish | 29 | 1.4% |
| Mexican | 116 | 5.7% |
| Spanish | 73 | 3.6% |
| Subsaharan African | 2 | 0.1% |
| Thai | 2 | 0.1% | View All 9 Rows |
Immigrants in Wadley
The most numerous immigrant groups reported in Wadley came from Central America (66 | 3.2%), Latin America (66 | 3.2%), and Mexico (66 | 3.2%), together accounting for 9.7% of all Wadley residents.
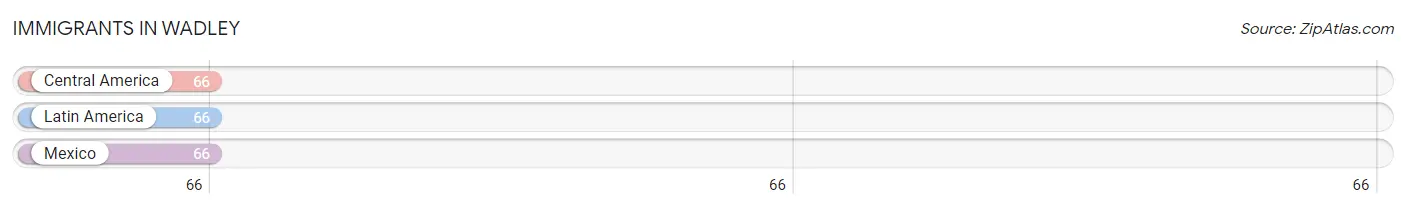
| Immigration Origin | # Population | % Population |
| Central America | 66 | 3.2% |
| Latin America | 66 | 3.2% |
| Mexico | 66 | 3.2% | View All 3 Rows |
Sex and Age in Wadley
Sex and Age in Wadley
The most populous age groups in Wadley are 15 to 19 Years (159 | 19.5%) for men and Under 5 Years (145 | 11.8%) for women.
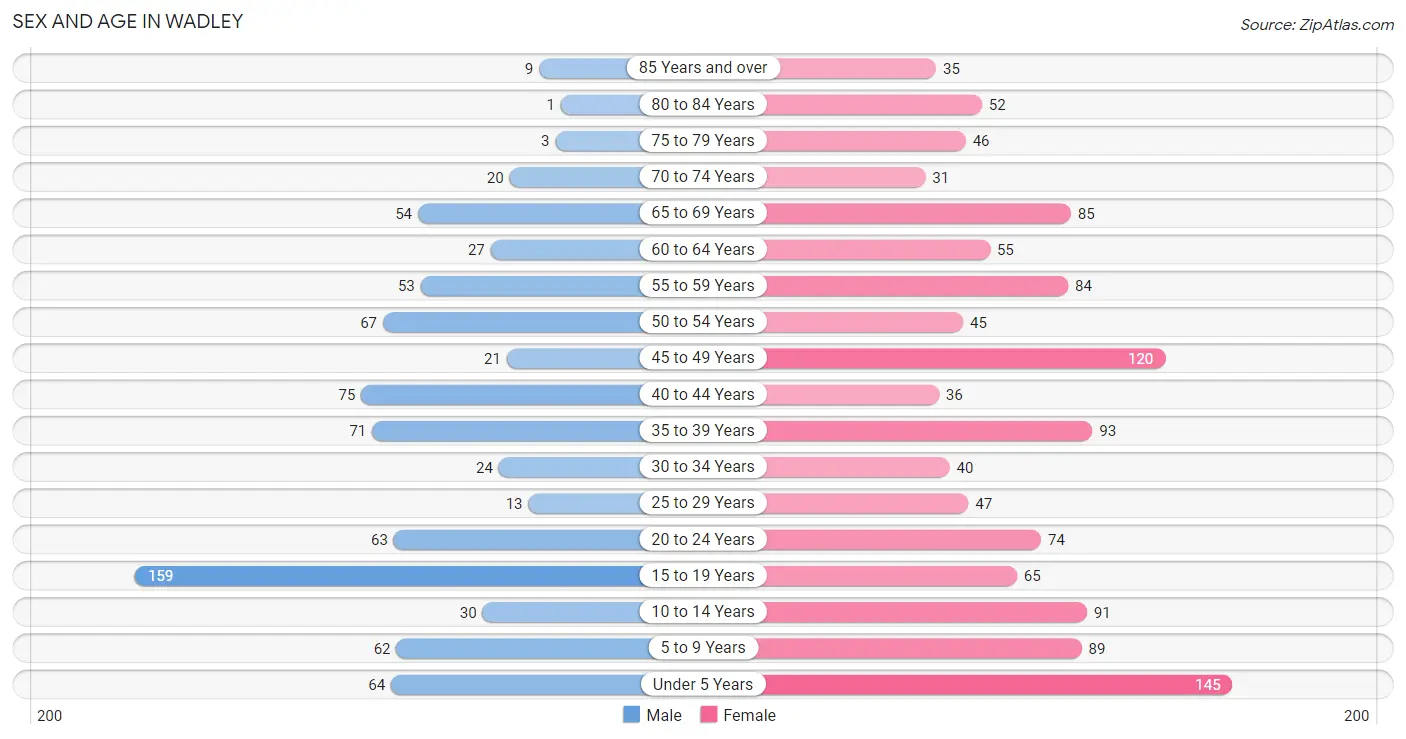
| Age Bracket | Male | Female |
| Under 5 Years | 64 (7.8%) | 145 (11.8%) |
| 5 to 9 Years | 62 (7.6%) | 89 (7.2%) |
| 10 to 14 Years | 30 (3.7%) | 91 (7.4%) |
| 15 to 19 Years | 159 (19.5%) | 65 (5.3%) |
| 20 to 24 Years | 63 (7.7%) | 74 (6.0%) |
| 25 to 29 Years | 13 (1.6%) | 47 (3.8%) |
| 30 to 34 Years | 24 (2.9%) | 40 (3.2%) |
| 35 to 39 Years | 71 (8.7%) | 93 (7.5%) |
| 40 to 44 Years | 75 (9.2%) | 36 (2.9%) |
| 45 to 49 Years | 21 (2.6%) | 120 (9.7%) |
| 50 to 54 Years | 67 (8.2%) | 45 (3.6%) |
| 55 to 59 Years | 53 (6.5%) | 84 (6.8%) |
| 60 to 64 Years | 27 (3.3%) | 55 (4.5%) |
| 65 to 69 Years | 54 (6.6%) | 85 (6.9%) |
| 70 to 74 Years | 20 (2.5%) | 31 (2.5%) |
| 75 to 79 Years | 3 (0.4%) | 46 (3.7%) |
| 80 to 84 Years | 1 (0.1%) | 52 (4.2%) |
| 85 Years and over | 9 (1.1%) | 35 (2.8%) |
| Total | 816 (100.0%) | 1,233 (100.0%) |
Families and Households in Wadley
Median Family Size in Wadley
The median family size in Wadley is 4.00 persons per family, with married-couple families (197 | 47.1%) accounting for the largest median family size of 4.37 persons per family. On the other hand, single female/mother families (183 | 43.8%) represent the smallest median family size with 3.60 persons per family.
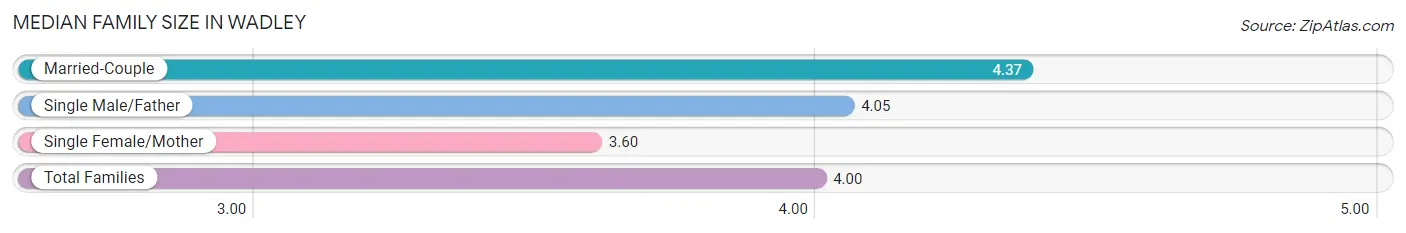
| Family Type | # Families | Family Size |
| Married-Couple | 197 (47.1%) | 4.37 |
| Single Male/Father | 38 (9.1%) | 4.05 |
| Single Female/Mother | 183 (43.8%) | 3.60 |
| Total Families | 418 (100.0%) | 4.00 |
Median Household Size in Wadley
The median household size in Wadley is 3.06 persons per household, with single male/father households (38 | 6.0%) accounting for the largest median household size of 4.66 persons per household. non-family households (217 | 34.2%) represent the smallest median household size with 1.04 persons per household.
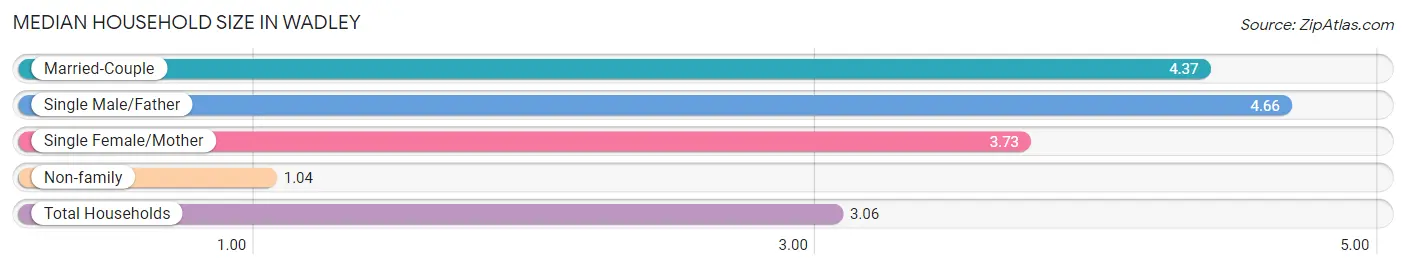
| Household Type | # Households | Household Size |
| Married-Couple | 197 (31.0%) | 4.37 |
| Single Male/Father | 38 (6.0%) | 4.66 |
| Single Female/Mother | 183 (28.8%) | 3.73 |
| Non-family | 217 (34.2%) | 1.04 |
| Total Households | 635 (100.0%) | 3.06 |
Household Size by Marriage Status in Wadley
Out of a total of 635 households in Wadley, 418 (65.8%) are family households, while 217 (34.2%) are nonfamily households. The most numerous type of family households are 2-person households, comprising 146, and the most common type of nonfamily households are 1-person households, comprising 215.
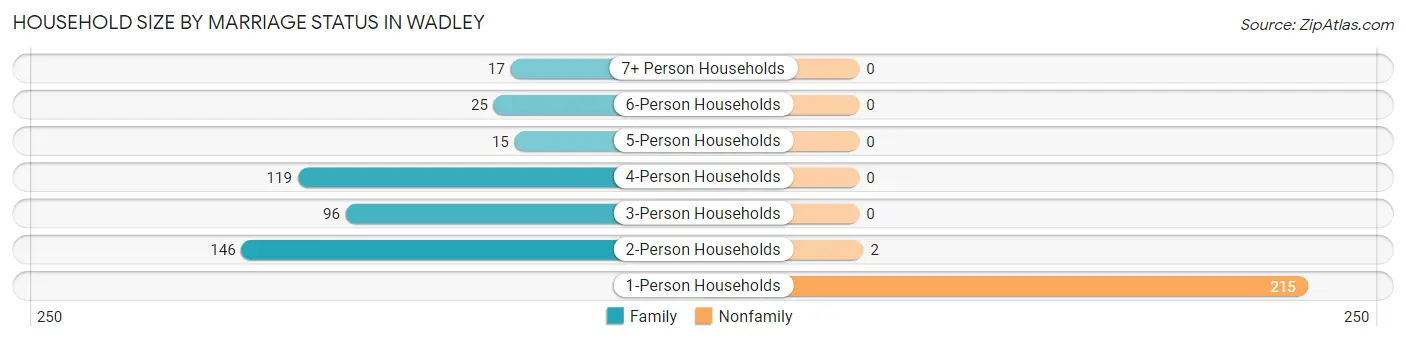
| Household Size | Family Households | Nonfamily Households |
| 1-Person Households | - | 215 (33.9%) |
| 2-Person Households | 146 (23.0%) | 2 (0.3%) |
| 3-Person Households | 96 (15.1%) | 0 (0.0%) |
| 4-Person Households | 119 (18.7%) | 0 (0.0%) |
| 5-Person Households | 15 (2.4%) | 0 (0.0%) |
| 6-Person Households | 25 (3.9%) | 0 (0.0%) |
| 7+ Person Households | 17 (2.7%) | 0 (0.0%) |
| Total | 418 (65.8%) | 217 (34.2%) |
Female Fertility in Wadley
Fertility by Age in Wadley
Average fertility rate in Wadley is 131.0 births per 1,000 women. Women in the age bracket of 20 to 34 years have the highest fertility rate with 248.0 births per 1,000 women. Women in the age bracket of 20 to 34 years acount for 62.5% of all women with births.
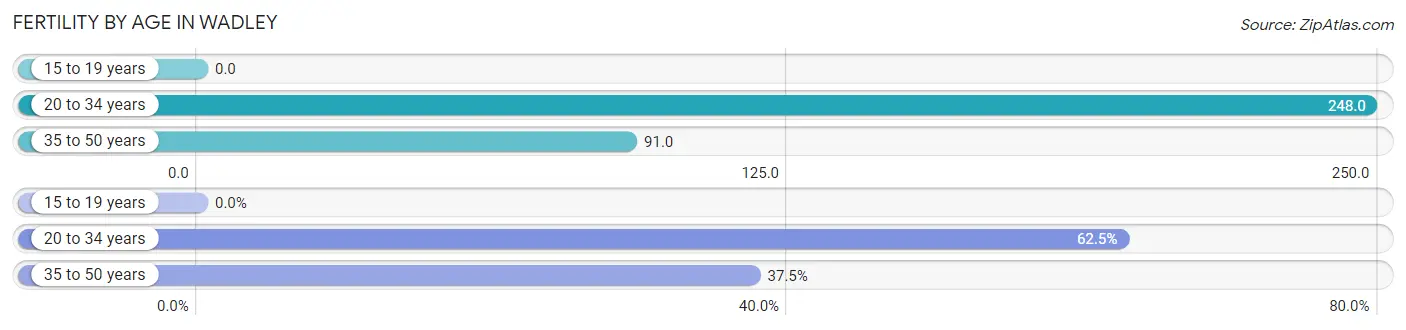
| Age Bracket | Women with Births | Births / 1,000 Women |
| 15 to 19 years | 0 (0.0%) | 0.0 |
| 20 to 34 years | 40 (62.5%) | 248.0 |
| 35 to 50 years | 24 (37.5%) | 91.0 |
| Total | 64 (100.0%) | 131.0 |
Fertility by Age by Marriage Status in Wadley
12.5% of women with births (64) in Wadley are married. The highest percentage of unmarried women with births falls into 20 to 34 years age bracket with 95.0% of them unmarried at the time of birth, while the lowest percentage of unmarried women with births belong to 35 to 50 years age bracket with 75.0% of them unmarried.
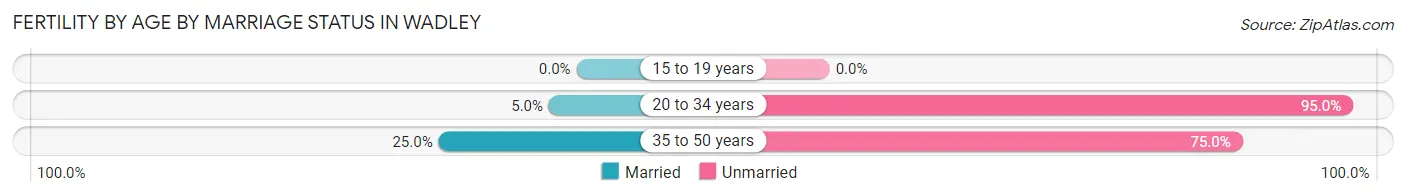
| Age Bracket | Married | Unmarried |
| 15 to 19 years | 0 (0.0%) | 0 (0.0%) |
| 20 to 34 years | 2 (5.0%) | 38 (95.0%) |
| 35 to 50 years | 6 (25.0%) | 18 (75.0%) |
| Total | 8 (12.5%) | 56 (87.5%) |
Fertility by Education in Wadley
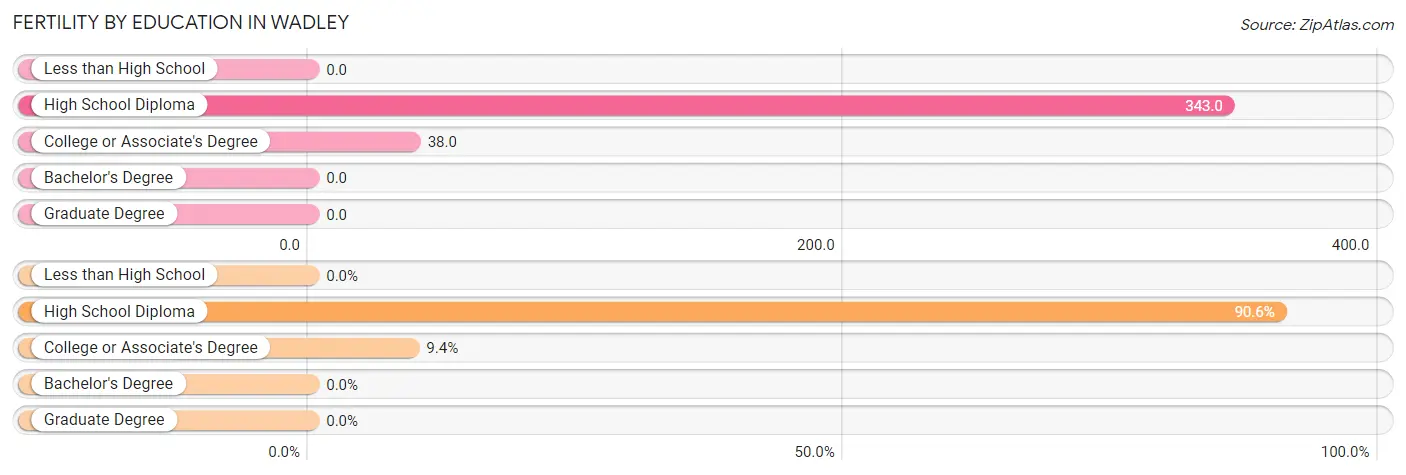
| Educational Attainment | Women with Births | Births / 1,000 Women |
| Less than High School | 0 (0.0%) | 0.0 |
| High School Diploma | 58 (90.6%) | 343.0 |
| College or Associate's Degree | 6 (9.4%) | 38.0 |
| Bachelor's Degree | 0 (0.0%) | 0.0 |
| Graduate Degree | 0 (0.0%) | 0.0 |
| Total | 64 (100.0%) | 131.0 |
Fertility by Education by Marriage Status in Wadley
87.5% of women with births in Wadley are unmarried. Women with the educational attainment of high school diploma are most likely to be married with 13.8% of them married at childbirth, while women with the educational attainment of college or associate's degree are least likely to be married with 100.0% of them unmarried at childbirth.
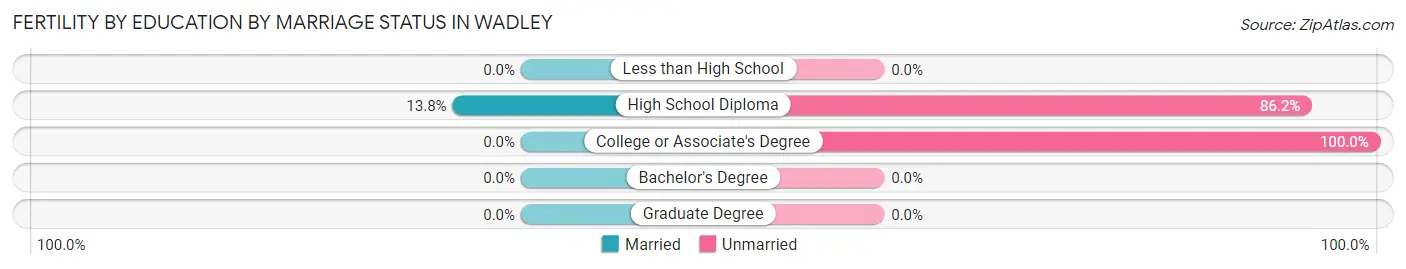
| Educational Attainment | Married | Unmarried |
| Less than High School | 0 (0.0%) | 0 (0.0%) |
| High School Diploma | 8 (13.8%) | 50 (86.2%) |
| College or Associate's Degree | 0 (0.0%) | 6 (100.0%) |
| Bachelor's Degree | 0 (0.0%) | 0 (0.0%) |
| Graduate Degree | 0 (0.0%) | 0 (0.0%) |
| Total | 8 (12.5%) | 56 (87.5%) |
Employment Characteristics in Wadley
Employment by Class of Employer in Wadley
Among the 610 employed individuals in Wadley, private company employees (409 | 67.0%), local government employees (69 | 11.3%), and state government employees (52 | 8.5%) make up the most common classes of employment.
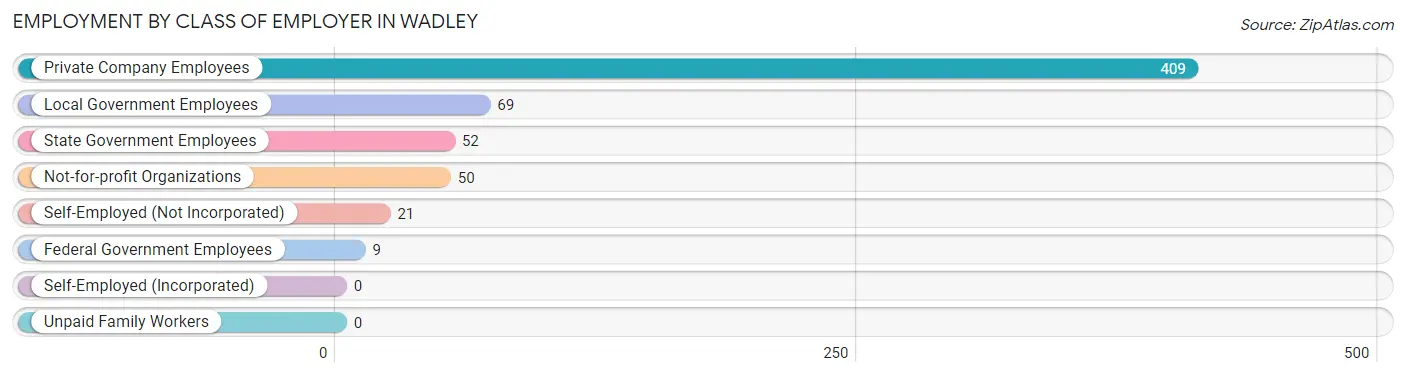
| Employer Class | # Employees | % Employees |
| Private Company Employees | 409 | 67.0% |
| Self-Employed (Incorporated) | 0 | 0.0% |
| Self-Employed (Not Incorporated) | 21 | 3.4% |
| Not-for-profit Organizations | 50 | 8.2% |
| Local Government Employees | 69 | 11.3% |
| State Government Employees | 52 | 8.5% |
| Federal Government Employees | 9 | 1.5% |
| Unpaid Family Workers | 0 | 0.0% |
| Total | 610 | 100.0% |
Employment Status by Age in Wadley
According to the labor force statistics for Wadley, out of the total population over 16 years of age (1,540), 45.7% or 704 individuals are in the labor force, with 10.1% or 71 of them unemployed. The age group with the highest labor force participation rate is 45 to 54 years, with 77.1% or 195 individuals in the labor force. Within the labor force, the 30 to 34 years age range has the highest percentage of unemployed individuals, with 44.2% or 19 of them being unemployed.
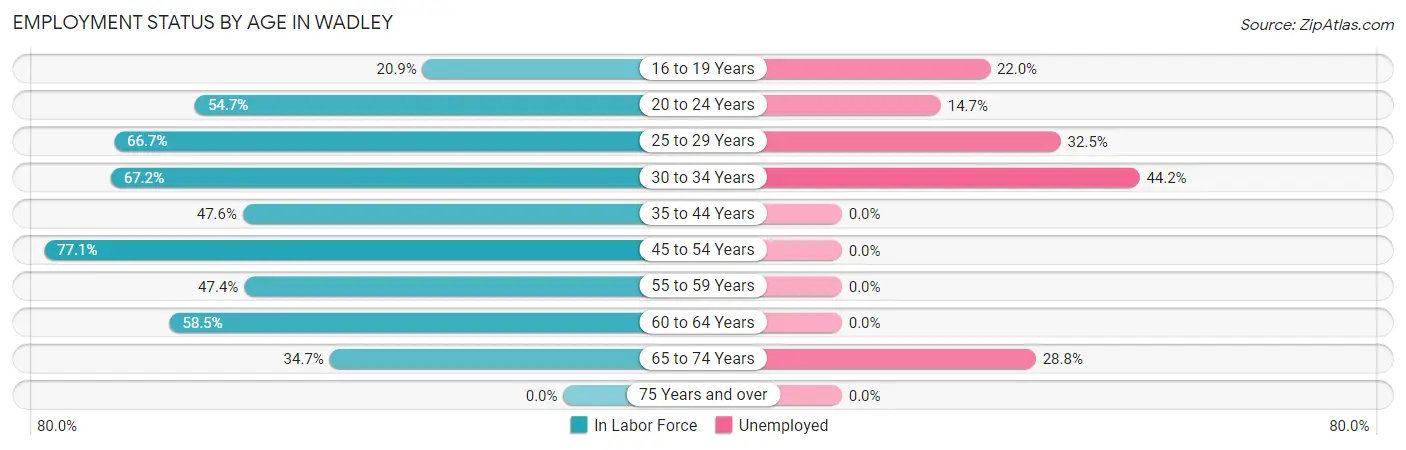
| Age Bracket | In Labor Force | Unemployed |
| 16 to 19 Years | 41 (20.9%) | 9 (22.0%) |
| 20 to 24 Years | 75 (54.7%) | 11 (14.7%) |
| 25 to 29 Years | 40 (66.7%) | 13 (32.5%) |
| 30 to 34 Years | 43 (67.2%) | 19 (44.2%) |
| 35 to 44 Years | 131 (47.6%) | 0 (0.0%) |
| 45 to 54 Years | 195 (77.1%) | 0 (0.0%) |
| 55 to 59 Years | 65 (47.4%) | 0 (0.0%) |
| 60 to 64 Years | 48 (58.5%) | 0 (0.0%) |
| 65 to 74 Years | 66 (34.7%) | 19 (28.8%) |
| 75 Years and over | 0 (0.0%) | 0 (0.0%) |
| Total | 704 (45.7%) | 71 (10.1%) |
Employment Status by Educational Attainment in Wadley
According to labor force statistics for Wadley, 59.9% of individuals (522) out of the total population between 25 and 64 years of age (871) are in the labor force, with 6.1% or 32 of them being unemployed. The group with the highest labor force participation rate are those with the educational attainment of bachelor's degree or higher, with 100.0% or 40 individuals in the labor force. Within the labor force, individuals with high school diploma education have the highest percentage of unemployment, with 8.8% or 21 of them being unemployed.
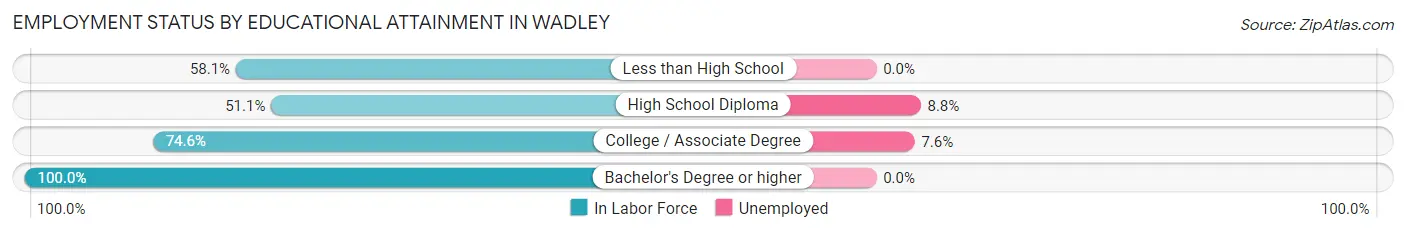
| Educational Attainment | In Labor Force | Unemployed |
| Less than High School | 100 (58.1%) | 0 (0.0%) |
| High School Diploma | 238 (51.1%) | 41 (8.8%) |
| College / Associate Degree | 144 (74.6%) | 15 (7.6%) |
| Bachelor's Degree or higher | 40 (100.0%) | 0 (0.0%) |
| Total | 522 (59.9%) | 53 (6.1%) |
Employment Occupations by Sex in Wadley
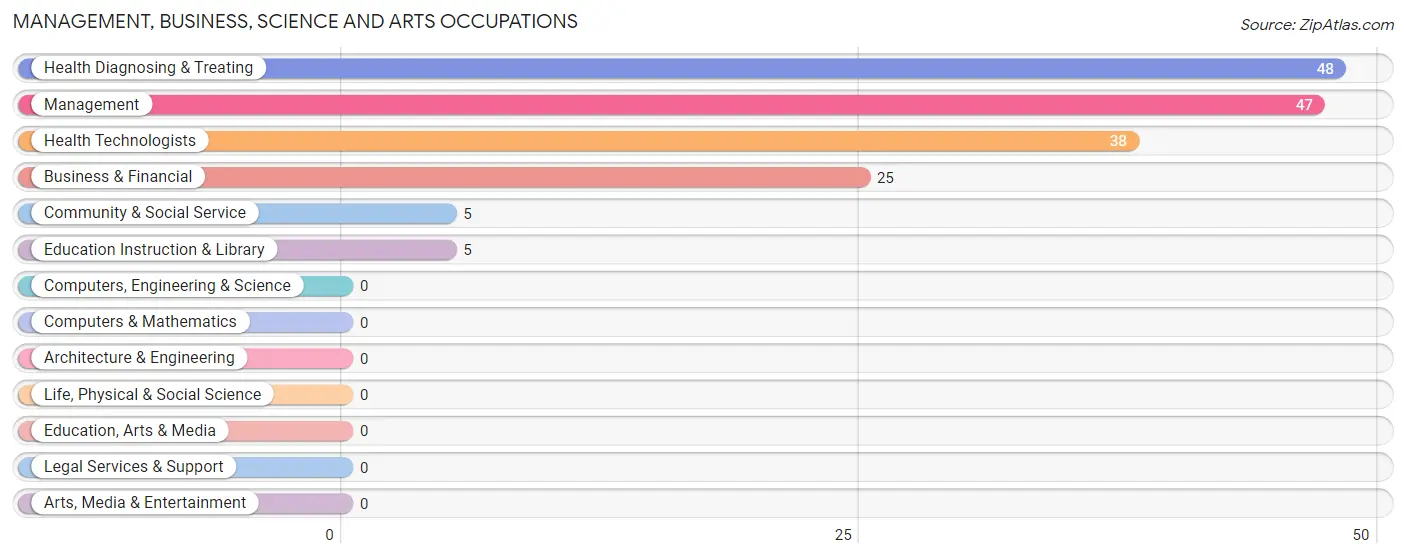
Management, Business, Science and Arts Occupations
The most common Management, Business, Science and Arts occupations in Wadley are Health Diagnosing & Treating (48 | 7.6%), Management (47 | 7.4%), Health Technologists (38 | 6.0%), Business & Financial (25 | 4.0%), and Community & Social Service (5 | 0.8%).
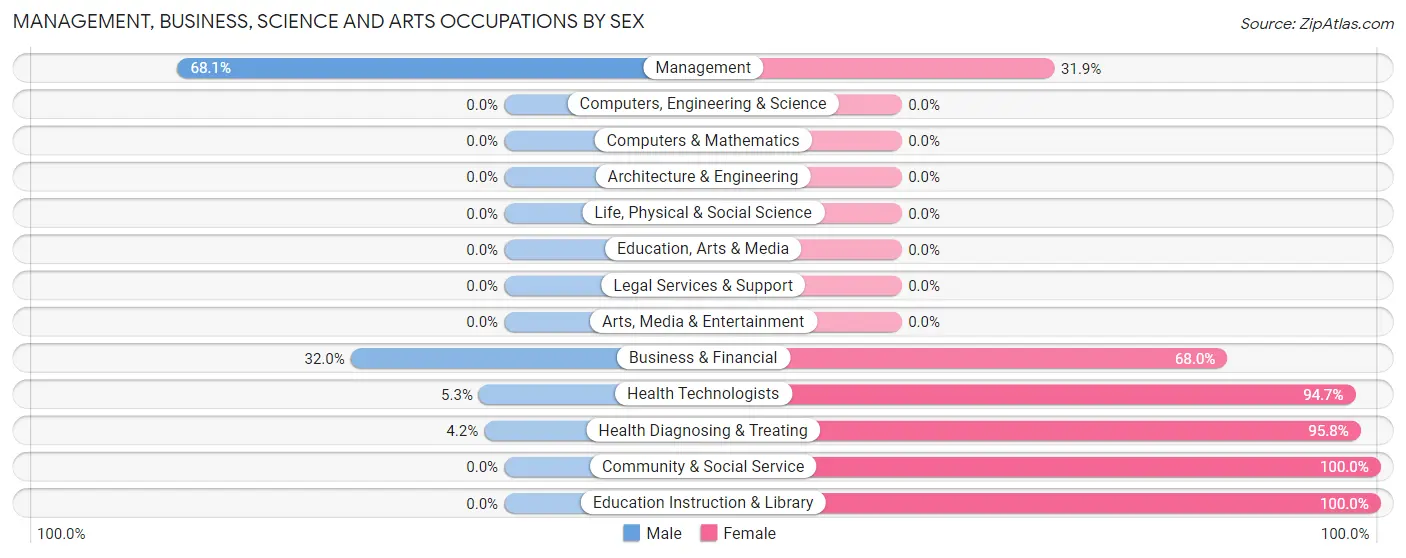
Management, Business, Science and Arts Occupations by Sex
Within the Management, Business, Science and Arts occupations in Wadley, the most male-oriented occupations are Management (68.1%), Business & Financial (32.0%), and Health Technologists (5.3%), while the most female-oriented occupations are Community & Social Service (100.0%), Education Instruction & Library (100.0%), and Health Diagnosing & Treating (95.8%).
| Occupation | Male | Female |
| Management | 32 (68.1%) | 15 (31.9%) |
| Business & Financial | 8 (32.0%) | 17 (68.0%) |
| Computers, Engineering & Science | 0 (0.0%) | 0 (0.0%) |
| Computers & Mathematics | 0 (0.0%) | 0 (0.0%) |
| Architecture & Engineering | 0 (0.0%) | 0 (0.0%) |
| Life, Physical & Social Science | 0 (0.0%) | 0 (0.0%) |
| Community & Social Service | 0 (0.0%) | 5 (100.0%) |
| Education, Arts & Media | 0 (0.0%) | 0 (0.0%) |
| Legal Services & Support | 0 (0.0%) | 0 (0.0%) |
| Education Instruction & Library | 0 (0.0%) | 5 (100.0%) |
| Arts, Media & Entertainment | 0 (0.0%) | 0 (0.0%) |
| Health Diagnosing & Treating | 2 (4.2%) | 46 (95.8%) |
| Health Technologists | 2 (5.3%) | 36 (94.7%) |
| Total (Category) | 42 (33.6%) | 83 (66.4%) |
| Total (Overall) | 282 (44.6%) | 351 (55.4%) |
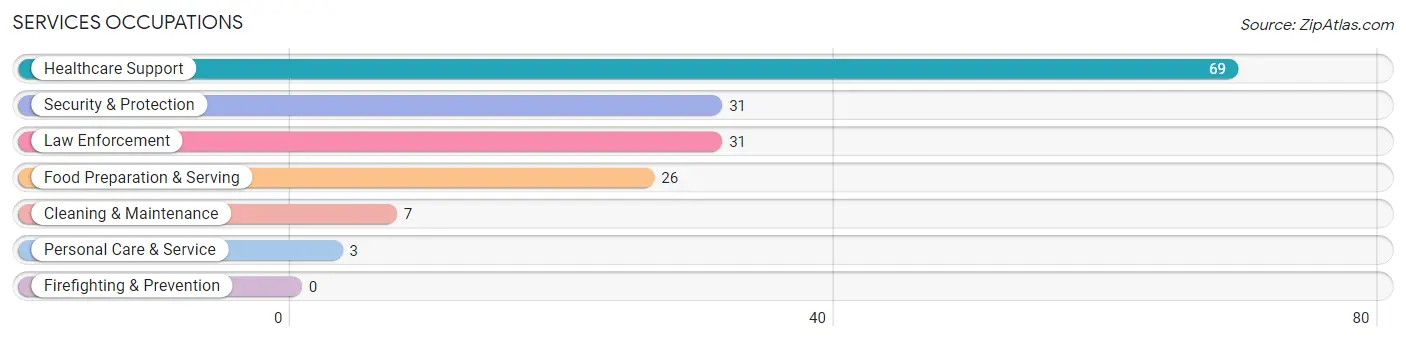
Services Occupations
The most common Services occupations in Wadley are Healthcare Support (69 | 10.9%), Security & Protection (31 | 4.9%), Law Enforcement (31 | 4.9%), Food Preparation & Serving (26 | 4.1%), and Cleaning & Maintenance (7 | 1.1%).
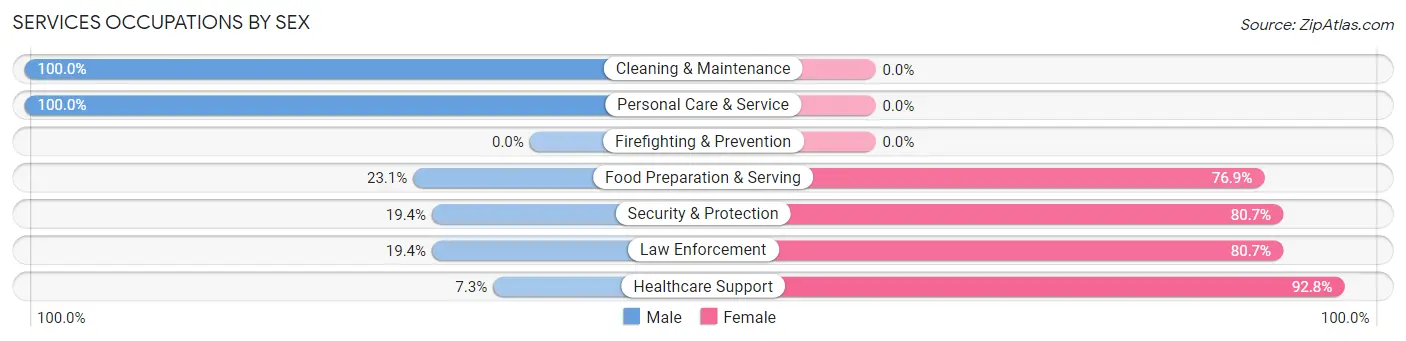
Services Occupations by Sex
Within the Services occupations in Wadley, the most male-oriented occupations are Cleaning & Maintenance (100.0%), Personal Care & Service (100.0%), and Food Preparation & Serving (23.1%), while the most female-oriented occupations are Healthcare Support (92.7%), Security & Protection (80.6%), and Law Enforcement (80.6%).
| Occupation | Male | Female |
| Healthcare Support | 5 (7.2%) | 64 (92.7%) |
| Security & Protection | 6 (19.4%) | 25 (80.6%) |
| Firefighting & Prevention | 0 (0.0%) | 0 (0.0%) |
| Law Enforcement | 6 (19.4%) | 25 (80.6%) |
| Food Preparation & Serving | 6 (23.1%) | 20 (76.9%) |
| Cleaning & Maintenance | 7 (100.0%) | 0 (0.0%) |
| Personal Care & Service | 3 (100.0%) | 0 (0.0%) |
| Total (Category) | 27 (19.9%) | 109 (80.1%) |
| Total (Overall) | 282 (44.6%) | 351 (55.4%) |
Sales and Office Occupations
The most common Sales and Office occupations in Wadley are Office & Administration (73 | 11.5%), and Sales & Related (49 | 7.7%).
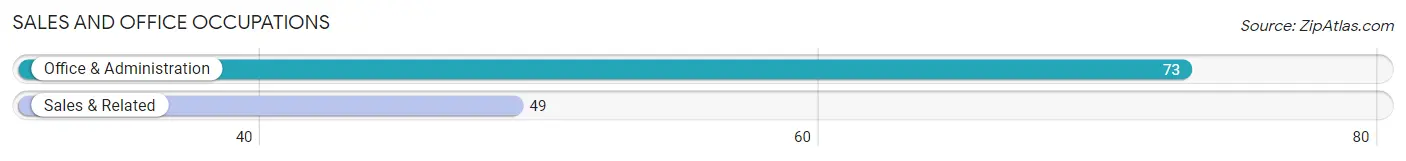
Sales and Office Occupations by Sex
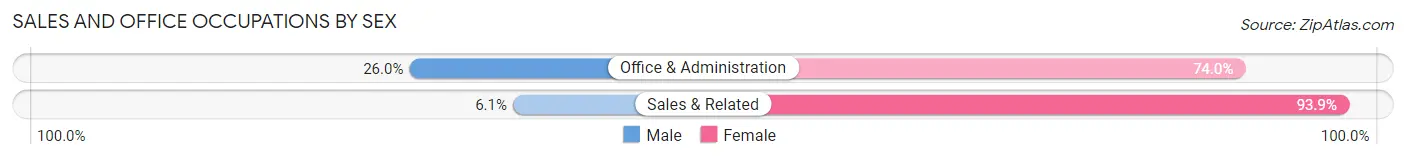
| Occupation | Male | Female |
| Sales & Related | 3 (6.1%) | 46 (93.9%) |
| Office & Administration | 19 (26.0%) | 54 (74.0%) |
| Total (Category) | 22 (18.0%) | 100 (82.0%) |
| Total (Overall) | 282 (44.6%) | 351 (55.4%) |
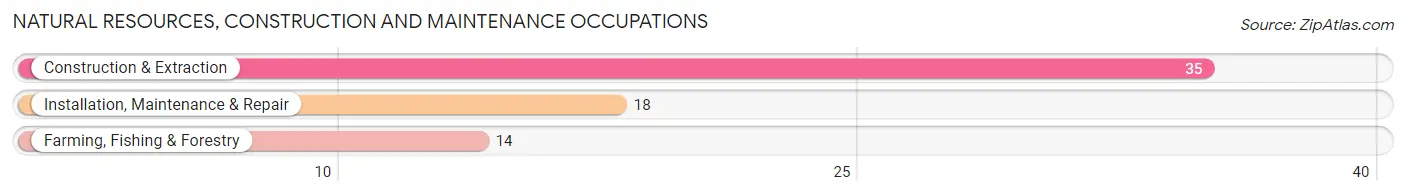
Natural Resources, Construction and Maintenance Occupations
The most common Natural Resources, Construction and Maintenance occupations in Wadley are Construction & Extraction (35 | 5.5%), Installation, Maintenance & Repair (18 | 2.8%), and Farming, Fishing & Forestry (14 | 2.2%).
Natural Resources, Construction and Maintenance Occupations by Sex
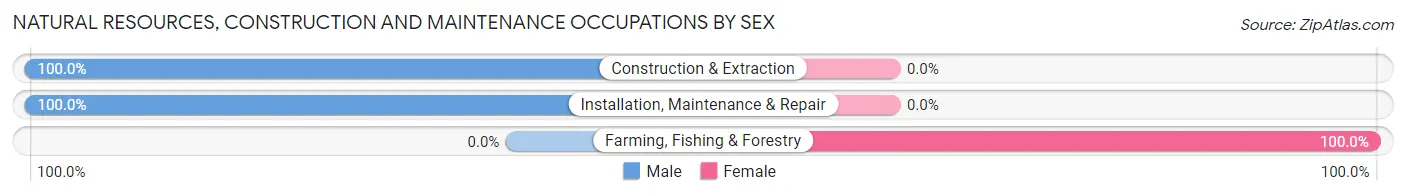
| Occupation | Male | Female |
| Farming, Fishing & Forestry | 0 (0.0%) | 14 (100.0%) |
| Construction & Extraction | 35 (100.0%) | 0 (0.0%) |
| Installation, Maintenance & Repair | 18 (100.0%) | 0 (0.0%) |
| Total (Category) | 53 (79.1%) | 14 (20.9%) |
| Total (Overall) | 282 (44.6%) | 351 (55.4%) |
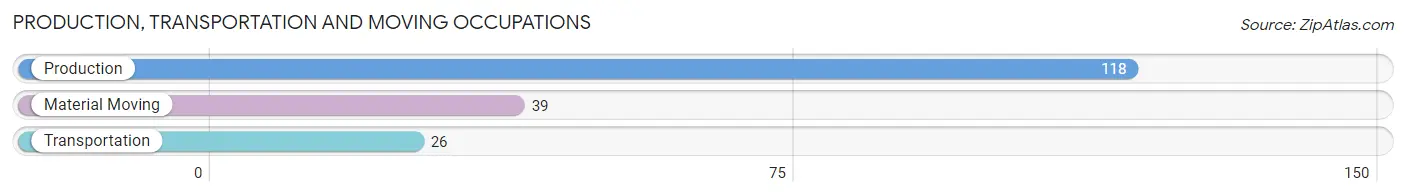
Production, Transportation and Moving Occupations
The most common Production, Transportation and Moving occupations in Wadley are Production (118 | 18.6%), Material Moving (39 | 6.2%), and Transportation (26 | 4.1%).
Production, Transportation and Moving Occupations by Sex
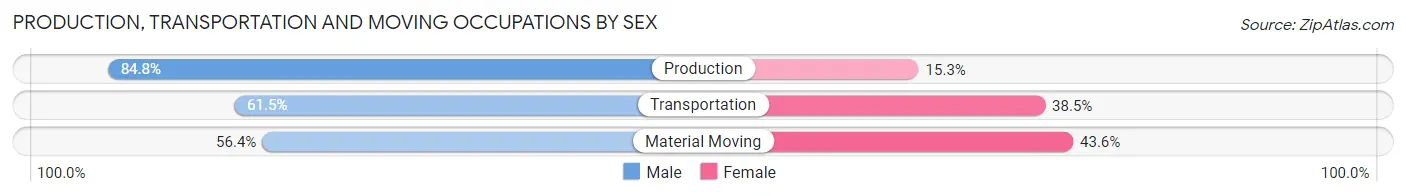
| Occupation | Male | Female |
| Production | 100 (84.8%) | 18 (15.2%) |
| Transportation | 16 (61.5%) | 10 (38.5%) |
| Material Moving | 22 (56.4%) | 17 (43.6%) |
| Total (Category) | 138 (75.4%) | 45 (24.6%) |
| Total (Overall) | 282 (44.6%) | 351 (55.4%) |
Employment Industries by Sex in Wadley
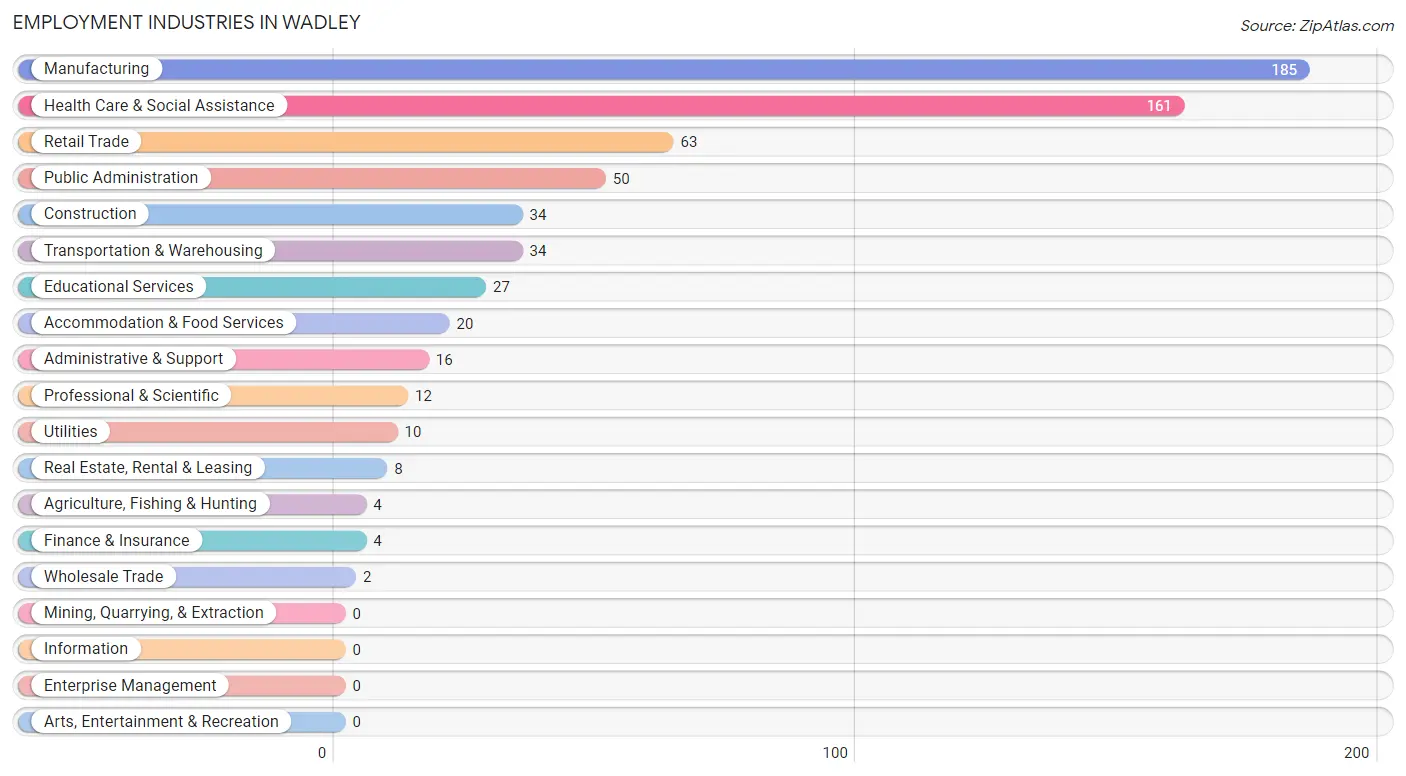
Employment Industries in Wadley
The major employment industries in Wadley include Manufacturing (185 | 29.2%), Health Care & Social Assistance (161 | 25.4%), Retail Trade (63 | 10.0%), Public Administration (50 | 7.9%), and Construction (34 | 5.4%).
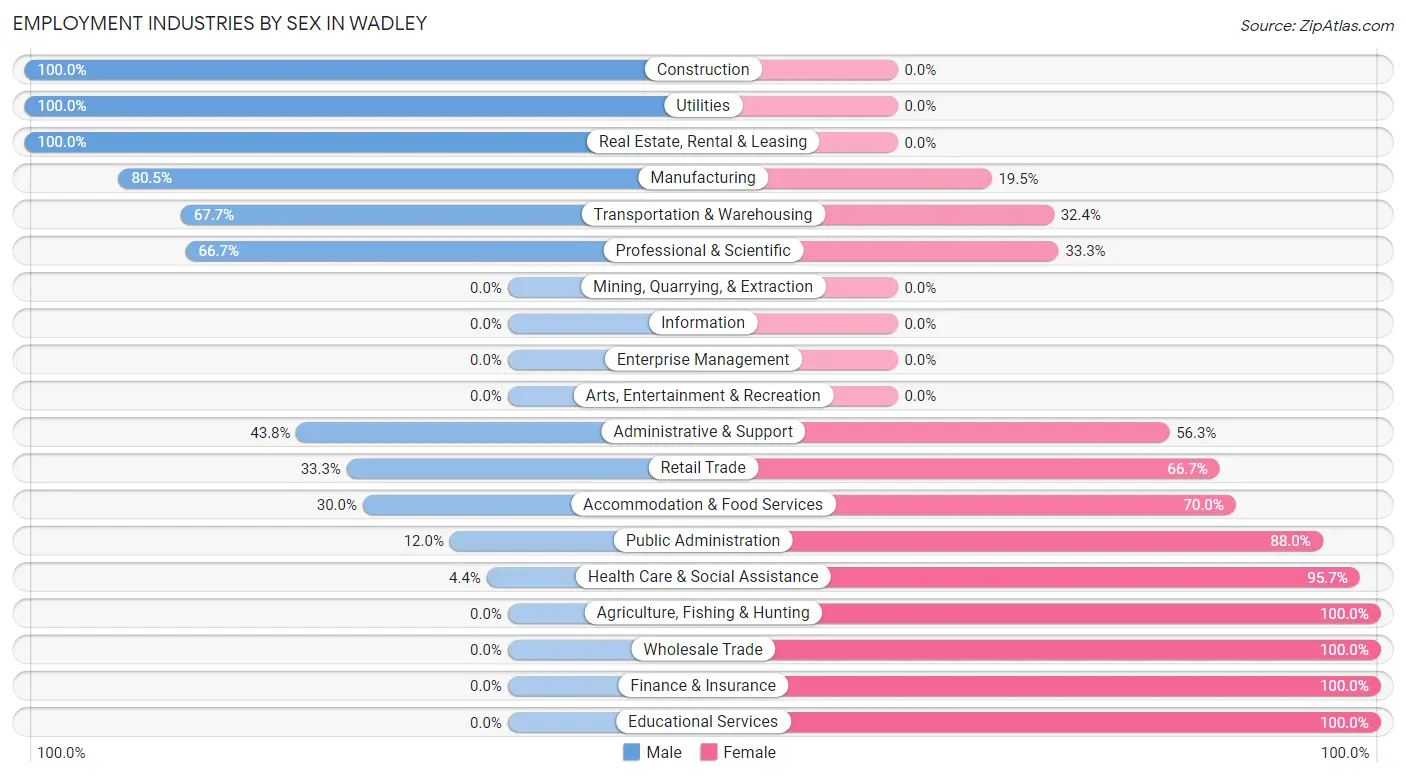
Employment Industries by Sex in Wadley
The Wadley industries that see more men than women are Construction (100.0%), Utilities (100.0%), and Real Estate, Rental & Leasing (100.0%), whereas the industries that tend to have a higher number of women are Agriculture, Fishing & Hunting (100.0%), Wholesale Trade (100.0%), and Finance & Insurance (100.0%).
| Industry | Male | Female |
| Agriculture, Fishing & Hunting | 0 (0.0%) | 4 (100.0%) |
| Mining, Quarrying, & Extraction | 0 (0.0%) | 0 (0.0%) |
| Construction | 34 (100.0%) | 0 (0.0%) |
| Manufacturing | 149 (80.5%) | 36 (19.5%) |
| Wholesale Trade | 0 (0.0%) | 2 (100.0%) |
| Retail Trade | 21 (33.3%) | 42 (66.7%) |
| Transportation & Warehousing | 23 (67.6%) | 11 (32.4%) |
| Utilities | 10 (100.0%) | 0 (0.0%) |
| Information | 0 (0.0%) | 0 (0.0%) |
| Finance & Insurance | 0 (0.0%) | 4 (100.0%) |
| Real Estate, Rental & Leasing | 8 (100.0%) | 0 (0.0%) |
| Professional & Scientific | 8 (66.7%) | 4 (33.3%) |
| Enterprise Management | 0 (0.0%) | 0 (0.0%) |
| Administrative & Support | 7 (43.8%) | 9 (56.2%) |
| Educational Services | 0 (0.0%) | 27 (100.0%) |
| Health Care & Social Assistance | 7 (4.3%) | 154 (95.7%) |
| Arts, Entertainment & Recreation | 0 (0.0%) | 0 (0.0%) |
| Accommodation & Food Services | 6 (30.0%) | 14 (70.0%) |
| Public Administration | 6 (12.0%) | 44 (88.0%) |
| Total | 282 (44.6%) | 351 (55.4%) |
Education in Wadley
School Enrollment in Wadley
The most common levels of schooling among the 602 students in Wadley are high school (212 | 35.2%), elementary school (109 | 18.1%), and middle school (101 | 16.8%).
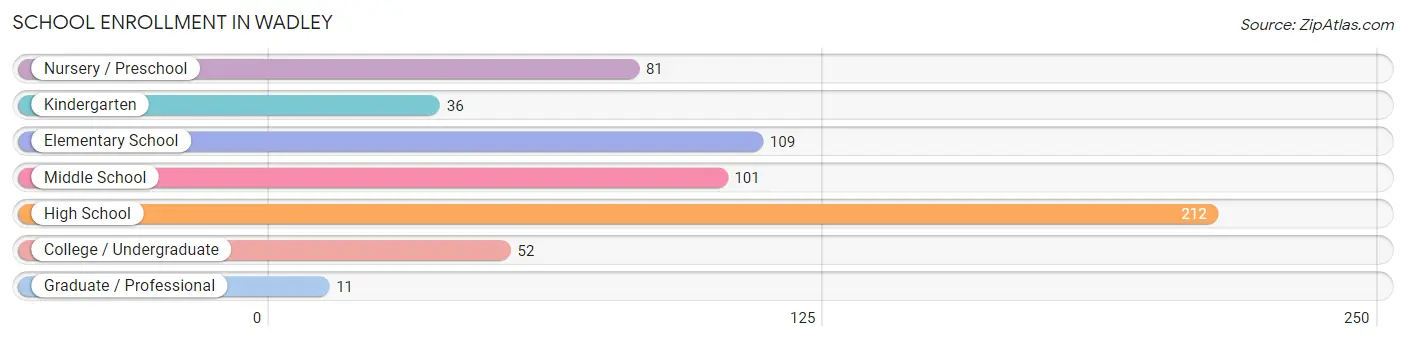
| School Level | # Students | % Students |
| Nursery / Preschool | 81 | 13.5% |
| Kindergarten | 36 | 6.0% |
| Elementary School | 109 | 18.1% |
| Middle School | 101 | 16.8% |
| High School | 212 | 35.2% |
| College / Undergraduate | 52 | 8.6% |
| Graduate / Professional | 11 | 1.8% |
| Total | 602 | 100.0% |
School Enrollment by Age by Funding Source in Wadley
Out of a total of 602 students who are enrolled in schools in Wadley, 24 (4.0%) attend a private institution, while the remaining 578 (96.0%) are enrolled in public schools. The age group of 3 to 4 year olds has the highest likelihood of being enrolled in private schools, with 17 (22.7% in the age bracket) enrolled. Conversely, the age group of 5 to 9 year old has the lowest likelihood of being enrolled in a private school, with 151 (100.0% in the age bracket) attending a public institution.
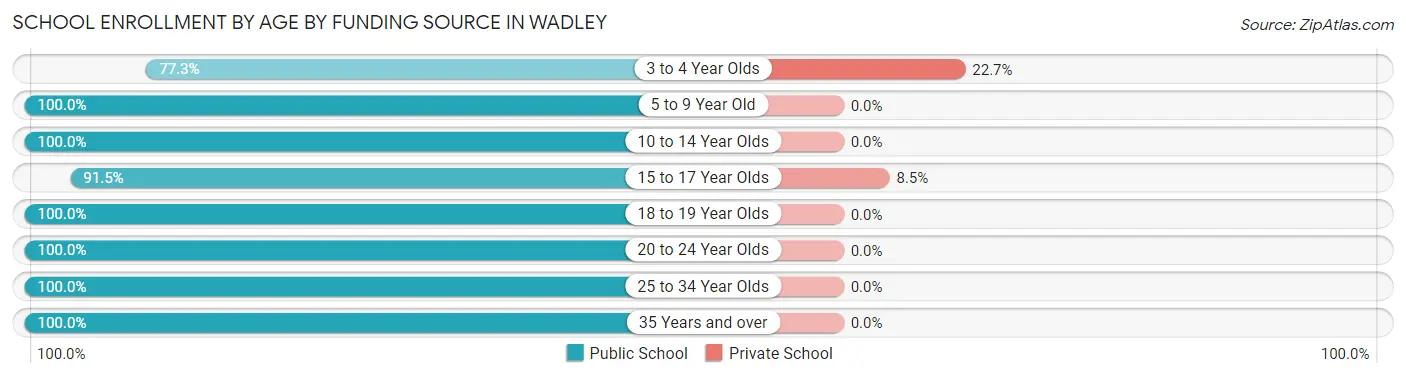
| Age Bracket | Public School | Private School |
| 3 to 4 Year Olds | 58 (77.3%) | 17 (22.7%) |
| 5 to 9 Year Old | 151 (100.0%) | 0 (0.0%) |
| 10 to 14 Year Olds | 121 (100.0%) | 0 (0.0%) |
| 15 to 17 Year Olds | 75 (91.5%) | 7 (8.5%) |
| 18 to 19 Year Olds | 101 (100.0%) | 0 (0.0%) |
| 20 to 24 Year Olds | 38 (100.0%) | 0 (0.0%) |
| 25 to 34 Year Olds | 15 (100.0%) | 0 (0.0%) |
| 35 Years and over | 19 (100.0%) | 0 (0.0%) |
| Total | 578 (96.0%) | 24 (4.0%) |
Educational Attainment by Field of Study in Wadley
Bio, nature & agricultural (18 | 29.0%), business (12 | 19.4%), science & technology (10 | 16.1%), education (7 | 11.3%), and physical & health sciences (6 | 9.7%) are the most common fields of study among 62 individuals in Wadley who have obtained a bachelor's degree or higher.
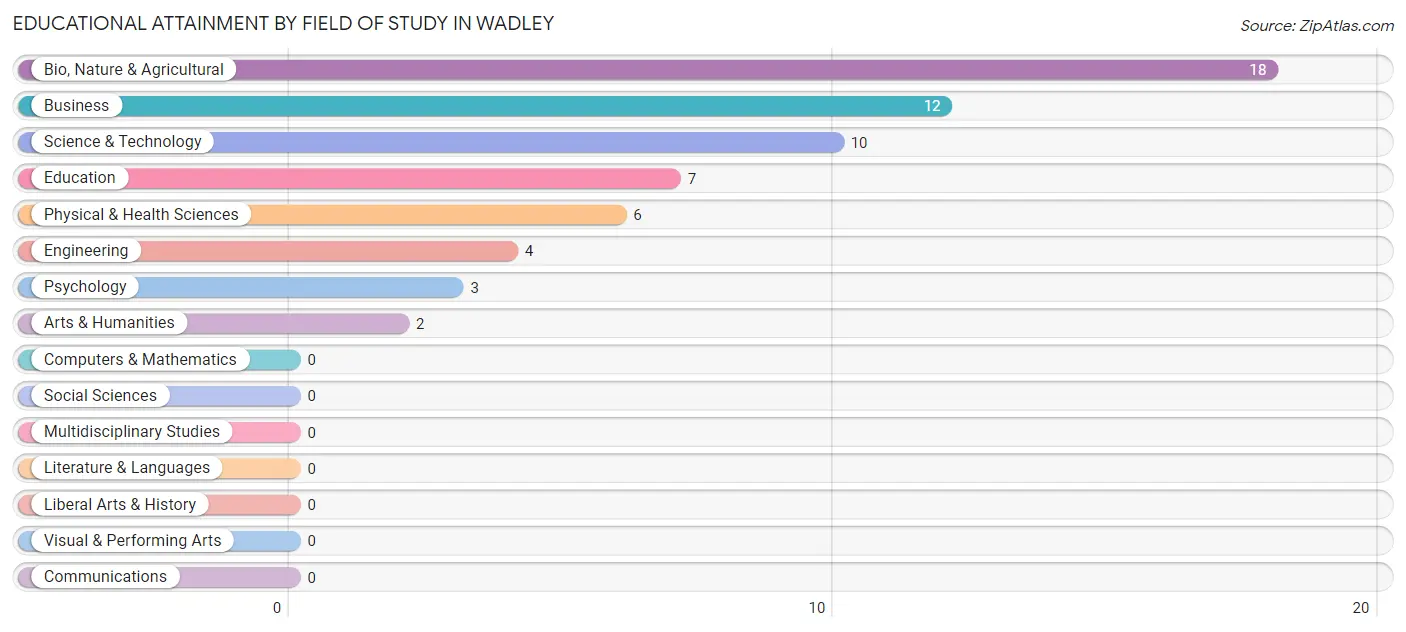
| Field of Study | # Graduates | % Graduates |
| Computers & Mathematics | 0 | 0.0% |
| Bio, Nature & Agricultural | 18 | 29.0% |
| Physical & Health Sciences | 6 | 9.7% |
| Psychology | 3 | 4.8% |
| Social Sciences | 0 | 0.0% |
| Engineering | 4 | 6.5% |
| Multidisciplinary Studies | 0 | 0.0% |
| Science & Technology | 10 | 16.1% |
| Business | 12 | 19.4% |
| Education | 7 | 11.3% |
| Literature & Languages | 0 | 0.0% |
| Liberal Arts & History | 0 | 0.0% |
| Visual & Performing Arts | 0 | 0.0% |
| Communications | 0 | 0.0% |
| Arts & Humanities | 2 | 3.2% |
| Total | 62 | 100.0% |
Transportation & Commute in Wadley
Vehicle Availability by Sex in Wadley
The most prevalent vehicle ownership categories in Wadley are males with 1 vehicle (100, accounting for 38.2%) and females with 1 vehicle (131, making up 29.1%).
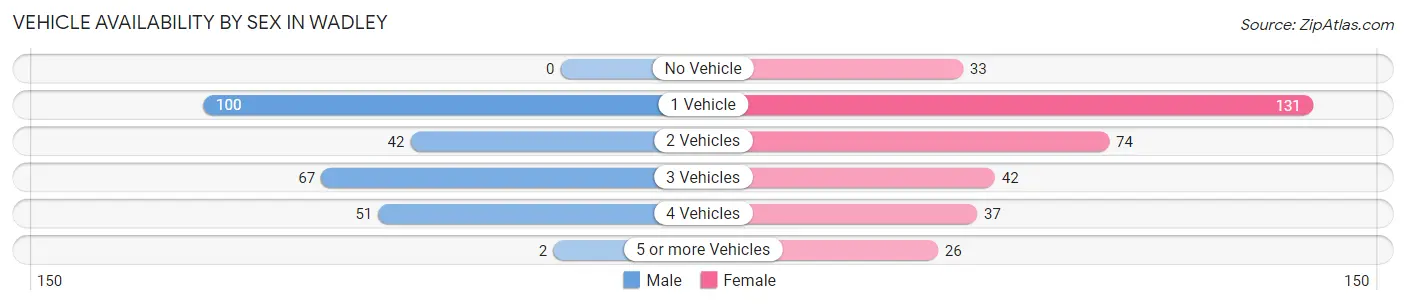
| Vehicles Available | Male | Female |
| No Vehicle | 0 (0.0%) | 33 (9.6%) |
| 1 Vehicle | 100 (38.2%) | 131 (38.2%) |
| 2 Vehicles | 42 (16.0%) | 74 (21.6%) |
| 3 Vehicles | 67 (25.6%) | 42 (12.2%) |
| 4 Vehicles | 51 (19.5%) | 37 (10.8%) |
| 5 or more Vehicles | 2 (0.8%) | 26 (7.6%) |
| Total | 262 (100.0%) | 343 (100.0%) |
Commute Time in Wadley
The most frequently occuring commute durations in Wadley are 10 to 14 minutes (88 commuters, 15.2%), 5 to 9 minutes (83 commuters, 14.4%), and 60 to 89 minutes (74 commuters, 12.8%).
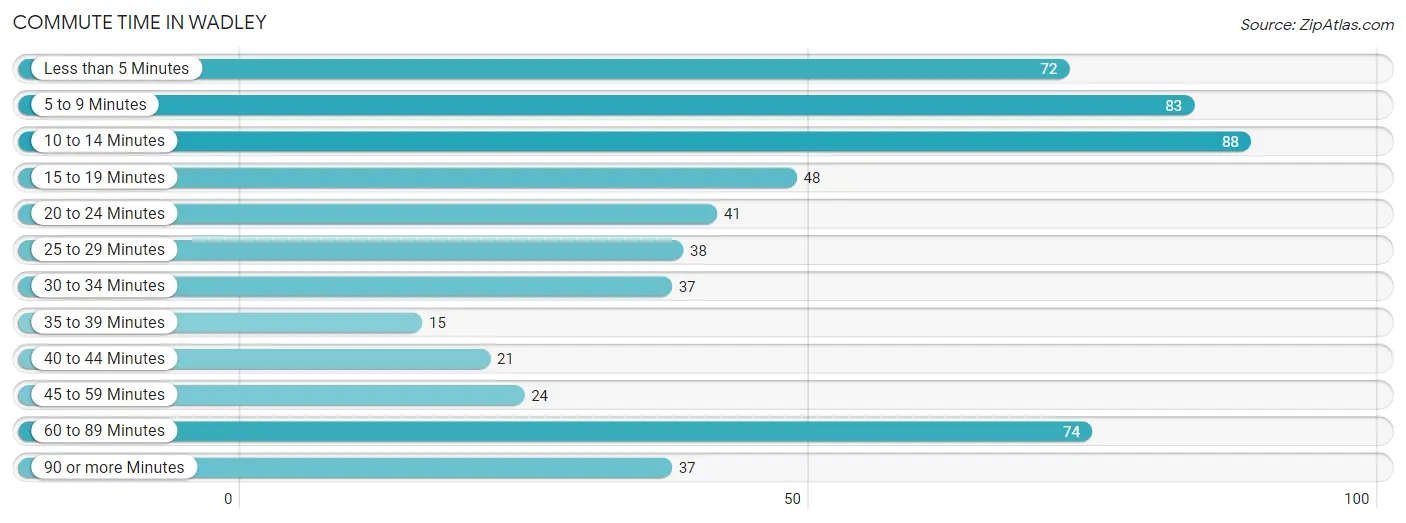
| Commute Time | # Commuters | % Commuters |
| Less than 5 Minutes | 72 | 12.5% |
| 5 to 9 Minutes | 83 | 14.4% |
| 10 to 14 Minutes | 88 | 15.2% |
| 15 to 19 Minutes | 48 | 8.3% |
| 20 to 24 Minutes | 41 | 7.1% |
| 25 to 29 Minutes | 38 | 6.6% |
| 30 to 34 Minutes | 37 | 6.4% |
| 35 to 39 Minutes | 15 | 2.6% |
| 40 to 44 Minutes | 21 | 3.6% |
| 45 to 59 Minutes | 24 | 4.2% |
| 60 to 89 Minutes | 74 | 12.8% |
| 90 or more Minutes | 37 | 6.4% |
Commute Time by Sex in Wadley
The most common commute times in Wadley are less than 5 minutes (63 commuters, 24.7%) for males and 10 to 14 minutes (70 commuters, 21.7%) for females.
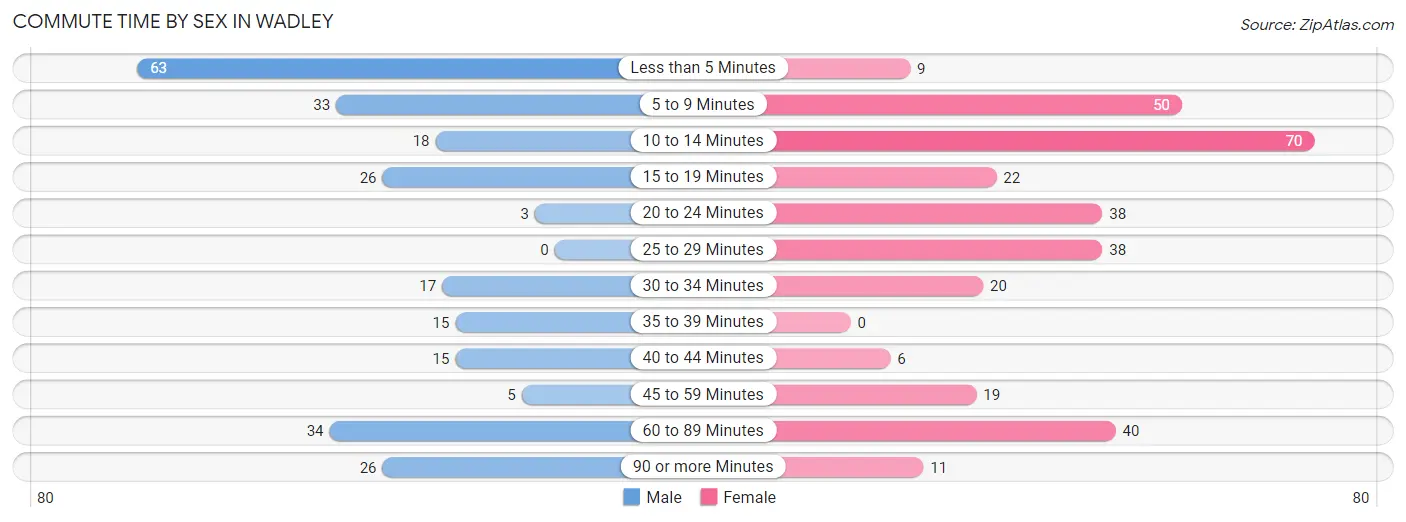
| Commute Time | Male | Female |
| Less than 5 Minutes | 63 (24.7%) | 9 (2.8%) |
| 5 to 9 Minutes | 33 (12.9%) | 50 (15.5%) |
| 10 to 14 Minutes | 18 (7.1%) | 70 (21.7%) |
| 15 to 19 Minutes | 26 (10.2%) | 22 (6.8%) |
| 20 to 24 Minutes | 3 (1.2%) | 38 (11.8%) |
| 25 to 29 Minutes | 0 (0.0%) | 38 (11.8%) |
| 30 to 34 Minutes | 17 (6.7%) | 20 (6.2%) |
| 35 to 39 Minutes | 15 (5.9%) | 0 (0.0%) |
| 40 to 44 Minutes | 15 (5.9%) | 6 (1.9%) |
| 45 to 59 Minutes | 5 (2.0%) | 19 (5.9%) |
| 60 to 89 Minutes | 34 (13.3%) | 40 (12.4%) |
| 90 or more Minutes | 26 (10.2%) | 11 (3.4%) |
Time of Departure to Work by Sex in Wadley
The most frequent times of departure to work in Wadley are 5:30 AM to 5:59 AM (70, 27.5%) for males and 6:30 AM to 6:59 AM (51, 15.8%) for females.
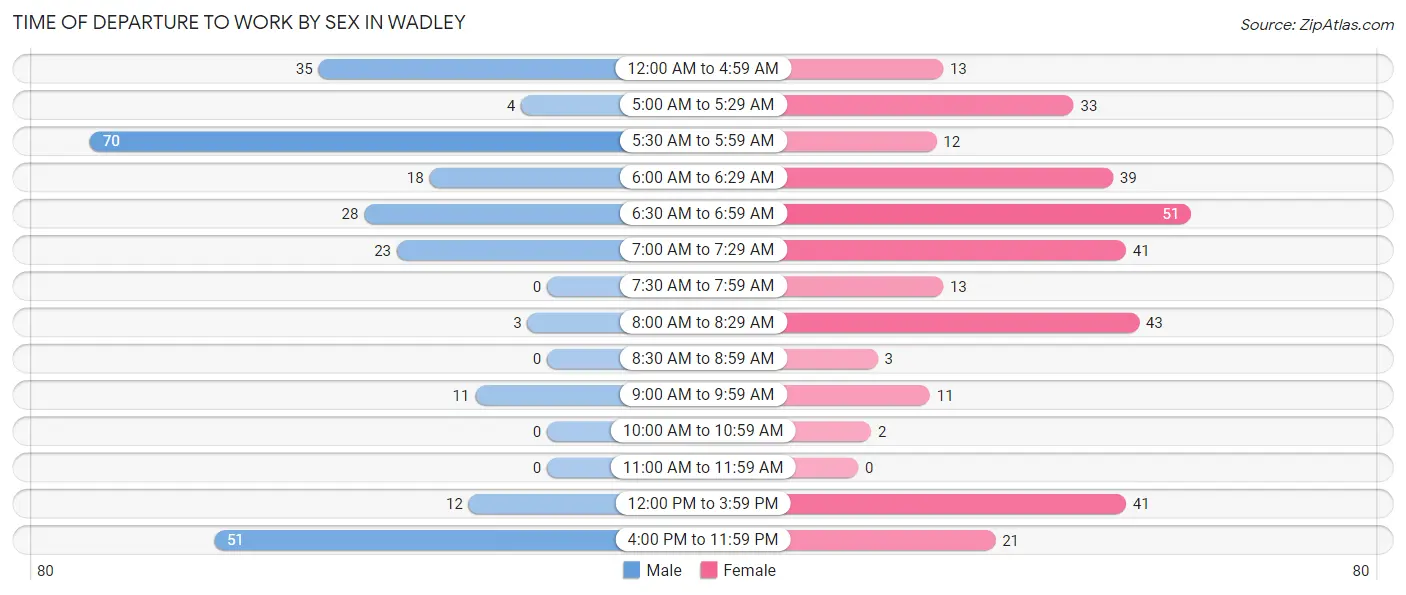
| Time of Departure | Male | Female |
| 12:00 AM to 4:59 AM | 35 (13.7%) | 13 (4.0%) |
| 5:00 AM to 5:29 AM | 4 (1.6%) | 33 (10.2%) |
| 5:30 AM to 5:59 AM | 70 (27.5%) | 12 (3.7%) |
| 6:00 AM to 6:29 AM | 18 (7.1%) | 39 (12.1%) |
| 6:30 AM to 6:59 AM | 28 (11.0%) | 51 (15.8%) |
| 7:00 AM to 7:29 AM | 23 (9.0%) | 41 (12.7%) |
| 7:30 AM to 7:59 AM | 0 (0.0%) | 13 (4.0%) |
| 8:00 AM to 8:29 AM | 3 (1.2%) | 43 (13.3%) |
| 8:30 AM to 8:59 AM | 0 (0.0%) | 3 (0.9%) |
| 9:00 AM to 9:59 AM | 11 (4.3%) | 11 (3.4%) |
| 10:00 AM to 10:59 AM | 0 (0.0%) | 2 (0.6%) |
| 11:00 AM to 11:59 AM | 0 (0.0%) | 0 (0.0%) |
| 12:00 PM to 3:59 PM | 12 (4.7%) | 41 (12.7%) |
| 4:00 PM to 11:59 PM | 51 (20.0%) | 21 (6.5%) |
| Total | 255 (100.0%) | 323 (100.0%) |
Housing Occupancy in Wadley
Occupancy by Ownership in Wadley
Of the total 635 dwellings in Wadley, owner-occupied units account for 408 (64.2%), while renter-occupied units make up 227 (35.7%).
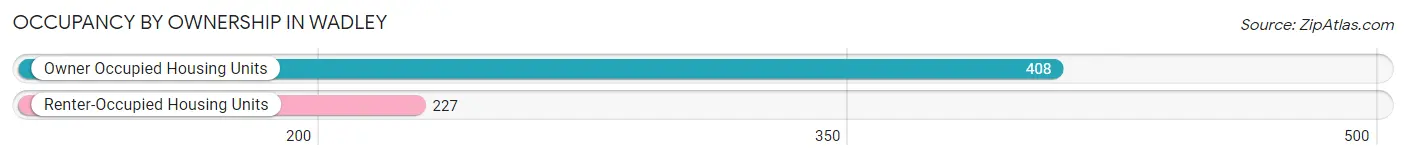
| Occupancy | # Housing Units | % Housing Units |
| Owner Occupied Housing Units | 408 | 64.2% |
| Renter-Occupied Housing Units | 227 | 35.7% |
| Total Occupied Housing Units | 635 | 100.0% |
Occupancy by Household Size in Wadley
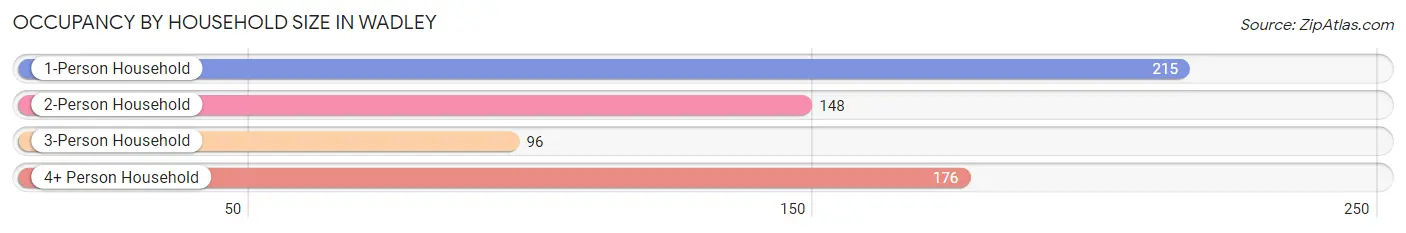
| Household Size | # Housing Units | % Housing Units |
| 1-Person Household | 215 | 33.9% |
| 2-Person Household | 148 | 23.3% |
| 3-Person Household | 96 | 15.1% |
| 4+ Person Household | 176 | 27.7% |
| Total Housing Units | 635 | 100.0% |
Occupancy by Ownership by Household Size in Wadley
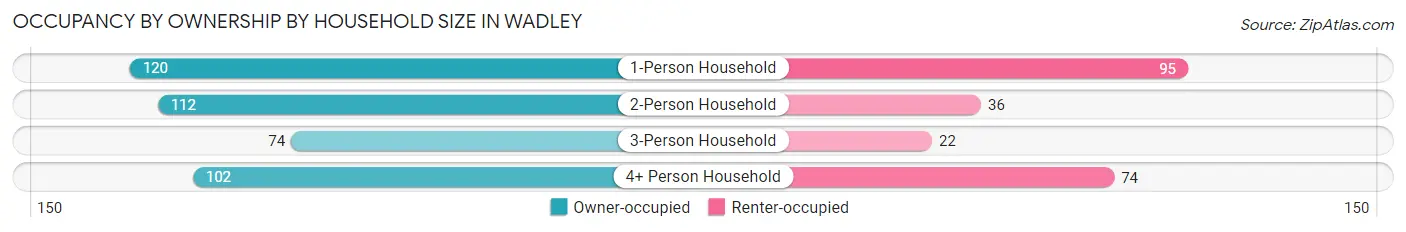
| Household Size | Owner-occupied | Renter-occupied |
| 1-Person Household | 120 (55.8%) | 95 (44.2%) |
| 2-Person Household | 112 (75.7%) | 36 (24.3%) |
| 3-Person Household | 74 (77.1%) | 22 (22.9%) |
| 4+ Person Household | 102 (58.0%) | 74 (42.0%) |
| Total Housing Units | 408 (64.2%) | 227 (35.7%) |
Occupancy by Educational Attainment in Wadley
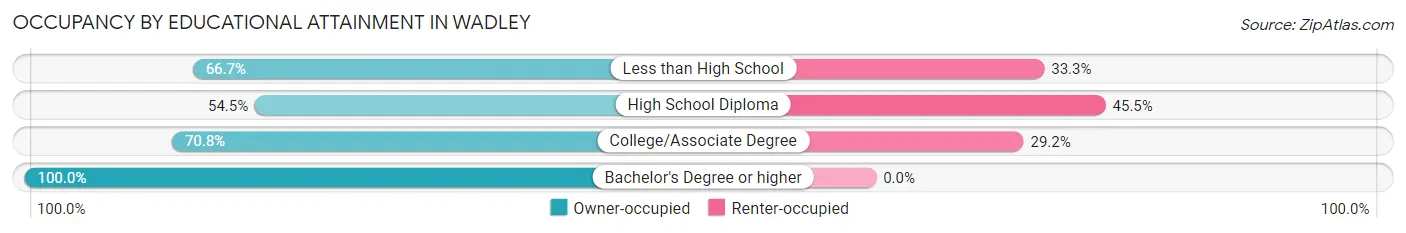
| Household Size | Owner-occupied | Renter-occupied |
| Less than High School | 132 (66.7%) | 66 (33.3%) |
| High School Diploma | 139 (54.5%) | 116 (45.5%) |
| College/Associate Degree | 109 (70.8%) | 45 (29.2%) |
| Bachelor's Degree or higher | 28 (100.0%) | 0 (0.0%) |
Occupancy by Age of Householder in Wadley
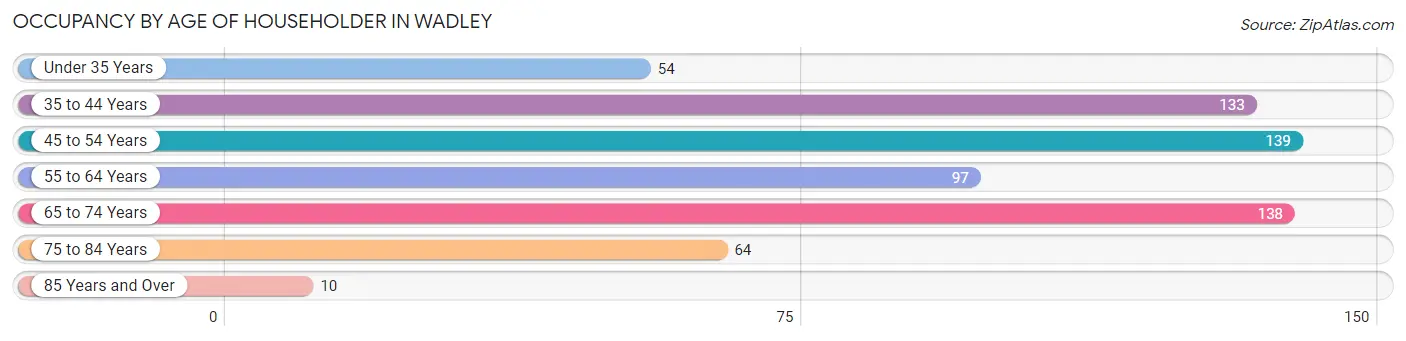
| Age Bracket | # Households | % Households |
| Under 35 Years | 54 | 8.5% |
| 35 to 44 Years | 133 | 20.9% |
| 45 to 54 Years | 139 | 21.9% |
| 55 to 64 Years | 97 | 15.3% |
| 65 to 74 Years | 138 | 21.7% |
| 75 to 84 Years | 64 | 10.1% |
| 85 Years and Over | 10 | 1.6% |
| Total | 635 | 100.0% |
Housing Finances in Wadley
Median Income by Occupancy in Wadley
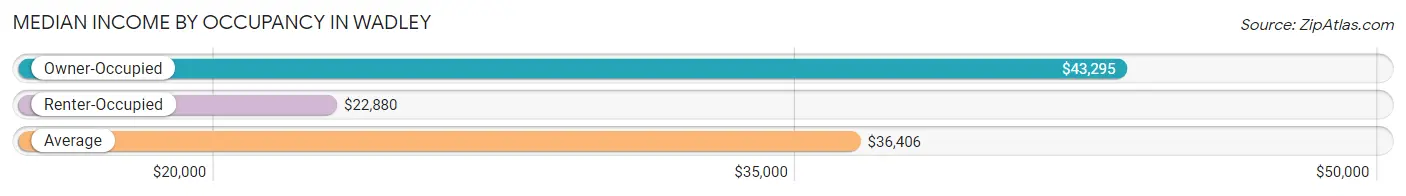
| Occupancy Type | # Households | Median Income |
| Owner-Occupied | 408 (64.2%) | $43,295 |
| Renter-Occupied | 227 (35.7%) | $22,880 |
| Average | 635 (100.0%) | $36,406 |
Occupancy by Householder Income Bracket in Wadley
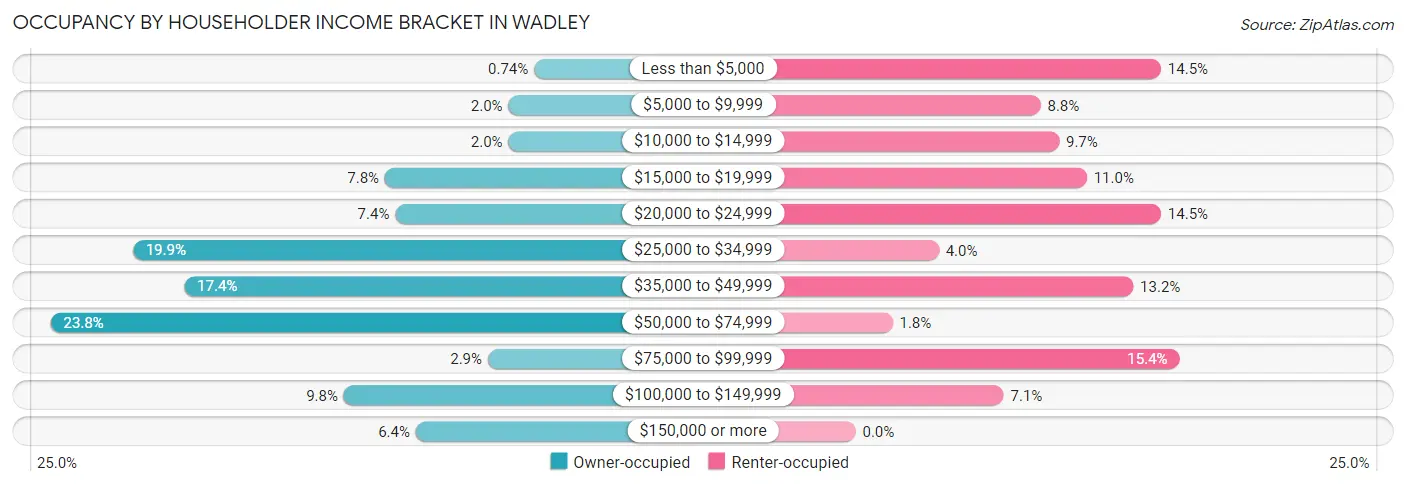
| Income Bracket | Owner-occupied | Renter-occupied |
| Less than $5,000 | 3 (0.7%) | 33 (14.5%) |
| $5,000 to $9,999 | 8 (2.0%) | 20 (8.8%) |
| $10,000 to $14,999 | 8 (2.0%) | 22 (9.7%) |
| $15,000 to $19,999 | 32 (7.8%) | 25 (11.0%) |
| $20,000 to $24,999 | 30 (7.3%) | 33 (14.5%) |
| $25,000 to $34,999 | 81 (19.9%) | 9 (4.0%) |
| $35,000 to $49,999 | 71 (17.4%) | 30 (13.2%) |
| $50,000 to $74,999 | 97 (23.8%) | 4 (1.8%) |
| $75,000 to $99,999 | 12 (2.9%) | 35 (15.4%) |
| $100,000 to $149,999 | 40 (9.8%) | 16 (7.0%) |
| $150,000 or more | 26 (6.4%) | 0 (0.0%) |
| Total | 408 (100.0%) | 227 (100.0%) |
Monthly Housing Cost Tiers in Wadley
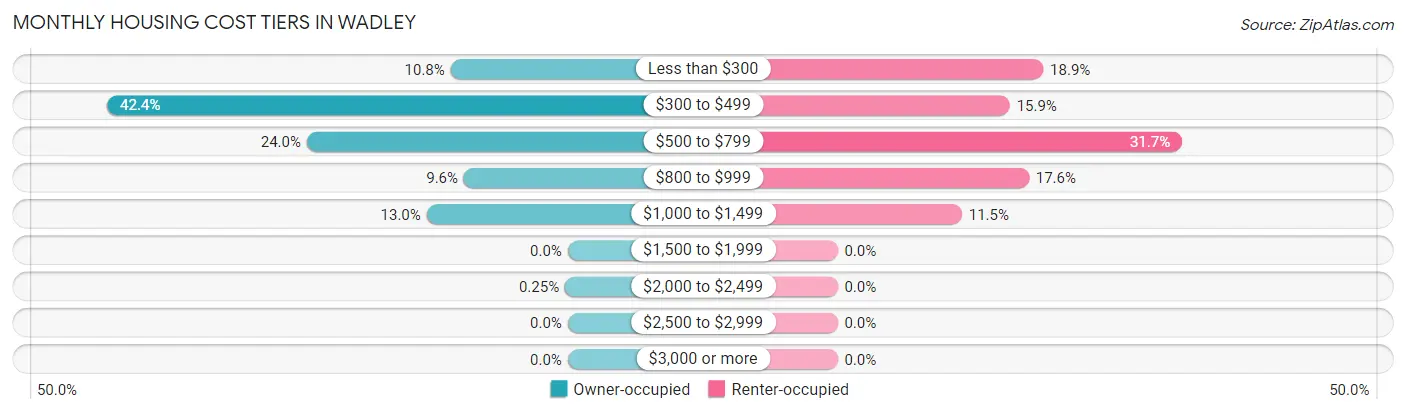
| Monthly Cost | Owner-occupied | Renter-occupied |
| Less than $300 | 44 (10.8%) | 43 (18.9%) |
| $300 to $499 | 173 (42.4%) | 36 (15.9%) |
| $500 to $799 | 98 (24.0%) | 72 (31.7%) |
| $800 to $999 | 39 (9.6%) | 40 (17.6%) |
| $1,000 to $1,499 | 53 (13.0%) | 26 (11.5%) |
| $1,500 to $1,999 | 0 (0.0%) | 0 (0.0%) |
| $2,000 to $2,499 | 1 (0.3%) | 0 (0.0%) |
| $2,500 to $2,999 | 0 (0.0%) | 0 (0.0%) |
| $3,000 or more | 0 (0.0%) | 0 (0.0%) |
| Total | 408 (100.0%) | 227 (100.0%) |
Physical Housing Characteristics in Wadley
Housing Structures in Wadley
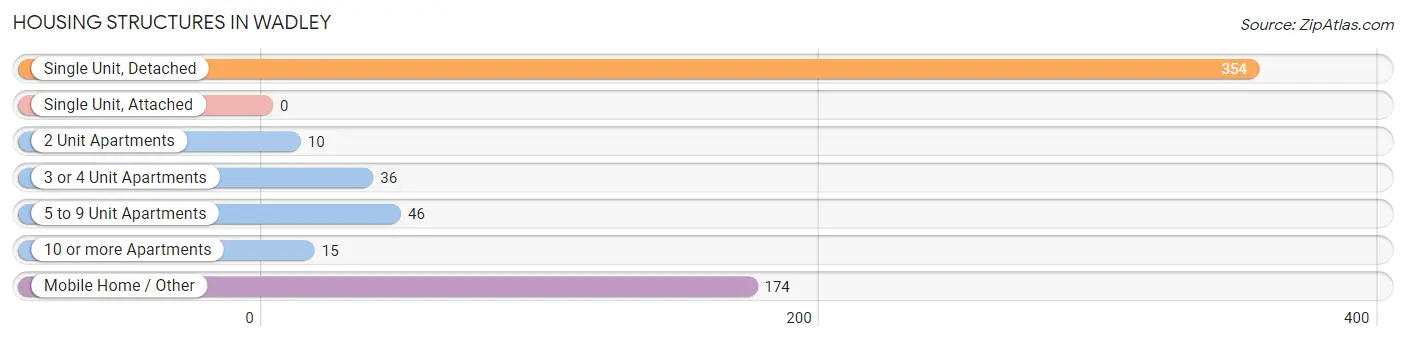
| Structure Type | # Housing Units | % Housing Units |
| Single Unit, Detached | 354 | 55.7% |
| Single Unit, Attached | 0 | 0.0% |
| 2 Unit Apartments | 10 | 1.6% |
| 3 or 4 Unit Apartments | 36 | 5.7% |
| 5 to 9 Unit Apartments | 46 | 7.2% |
| 10 or more Apartments | 15 | 2.4% |
| Mobile Home / Other | 174 | 27.4% |
| Total | 635 | 100.0% |
Housing Structures by Occupancy in Wadley
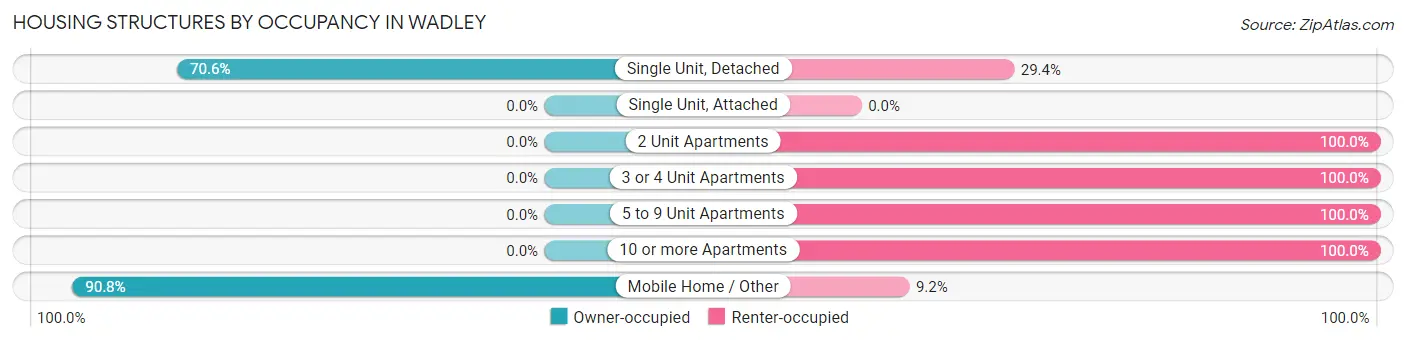
| Structure Type | Owner-occupied | Renter-occupied |
| Single Unit, Detached | 250 (70.6%) | 104 (29.4%) |
| Single Unit, Attached | 0 (0.0%) | 0 (0.0%) |
| 2 Unit Apartments | 0 (0.0%) | 10 (100.0%) |
| 3 or 4 Unit Apartments | 0 (0.0%) | 36 (100.0%) |
| 5 to 9 Unit Apartments | 0 (0.0%) | 46 (100.0%) |
| 10 or more Apartments | 0 (0.0%) | 15 (100.0%) |
| Mobile Home / Other | 158 (90.8%) | 16 (9.2%) |
| Total | 408 (64.2%) | 227 (35.7%) |
Housing Structures by Number of Rooms in Wadley
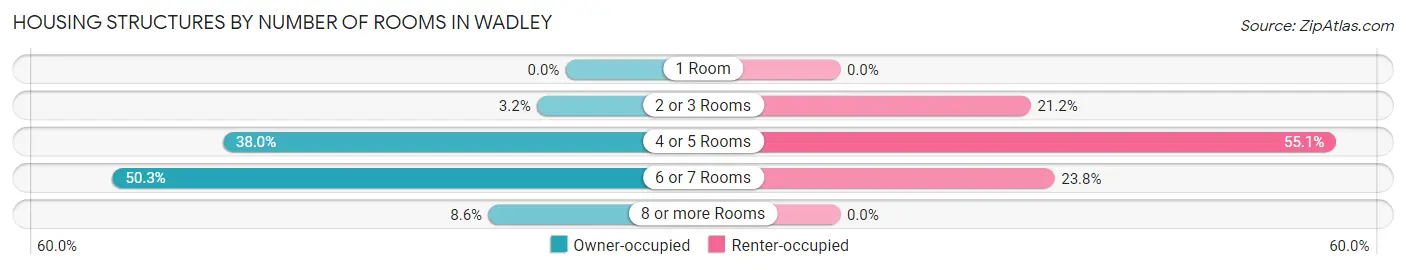
| Number of Rooms | Owner-occupied | Renter-occupied |
| 1 Room | 0 (0.0%) | 0 (0.0%) |
| 2 or 3 Rooms | 13 (3.2%) | 48 (21.1%) |
| 4 or 5 Rooms | 155 (38.0%) | 125 (55.1%) |
| 6 or 7 Rooms | 205 (50.2%) | 54 (23.8%) |
| 8 or more Rooms | 35 (8.6%) | 0 (0.0%) |
| Total | 408 (100.0%) | 227 (100.0%) |
Housing Structure by Heating Type in Wadley
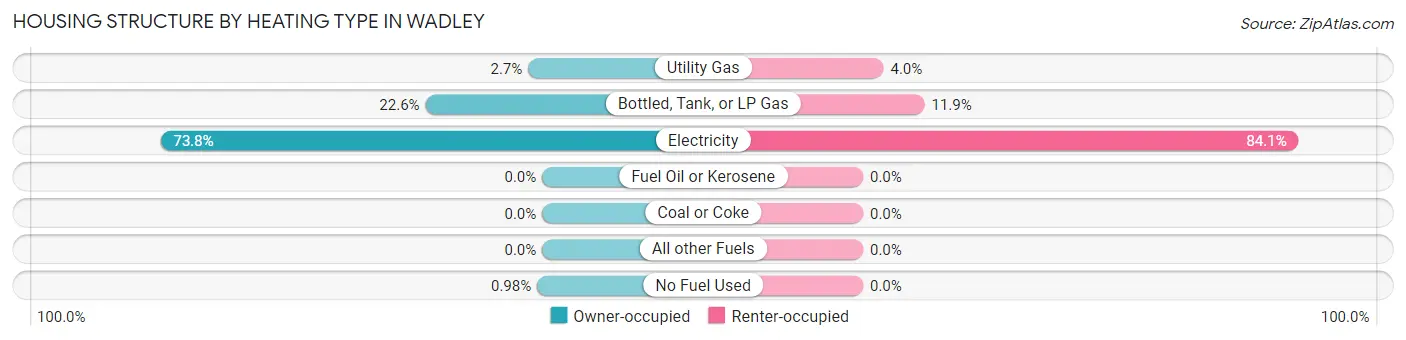
| Heating Type | Owner-occupied | Renter-occupied |
| Utility Gas | 11 (2.7%) | 9 (4.0%) |
| Bottled, Tank, or LP Gas | 92 (22.6%) | 27 (11.9%) |
| Electricity | 301 (73.8%) | 191 (84.1%) |
| Fuel Oil or Kerosene | 0 (0.0%) | 0 (0.0%) |
| Coal or Coke | 0 (0.0%) | 0 (0.0%) |
| All other Fuels | 0 (0.0%) | 0 (0.0%) |
| No Fuel Used | 4 (1.0%) | 0 (0.0%) |
| Total | 408 (100.0%) | 227 (100.0%) |
Household Vehicle Usage in Wadley
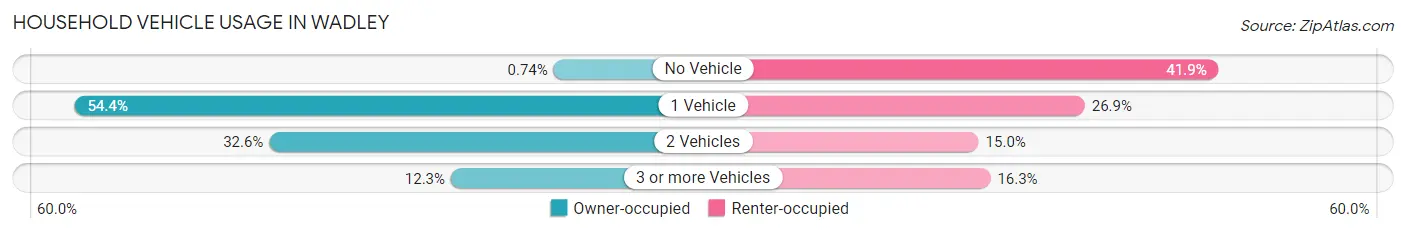
| Vehicles per Household | Owner-occupied | Renter-occupied |
| No Vehicle | 3 (0.7%) | 95 (41.8%) |
| 1 Vehicle | 222 (54.4%) | 61 (26.9%) |
| 2 Vehicles | 133 (32.6%) | 34 (15.0%) |
| 3 or more Vehicles | 50 (12.2%) | 37 (16.3%) |
| Total | 408 (100.0%) | 227 (100.0%) |
Real Estate & Mortgages in Wadley
Real Estate and Mortgage Overview in Wadley
| Characteristic | Without Mortgage | With Mortgage |
| Housing Units | 300 | 108 |
| Median Property Value | $50,900 | $68,300 |
| Median Household Income | $38,571 | $5 |
| Monthly Housing Costs | $396 | $0 |
| Real Estate Taxes | $676 | $3 |
Property Value by Mortgage Status in Wadley
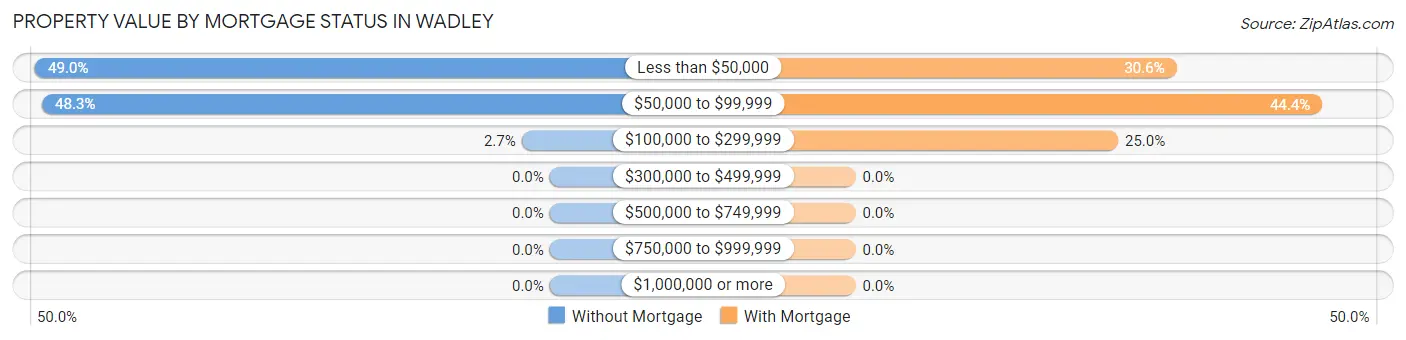
| Property Value | Without Mortgage | With Mortgage |
| Less than $50,000 | 147 (49.0%) | 33 (30.6%) |
| $50,000 to $99,999 | 145 (48.3%) | 48 (44.4%) |
| $100,000 to $299,999 | 8 (2.7%) | 27 (25.0%) |
| $300,000 to $499,999 | 0 (0.0%) | 0 (0.0%) |
| $500,000 to $749,999 | 0 (0.0%) | 0 (0.0%) |
| $750,000 to $999,999 | 0 (0.0%) | 0 (0.0%) |
| $1,000,000 or more | 0 (0.0%) | 0 (0.0%) |
| Total | 300 (100.0%) | 108 (100.0%) |
Household Income by Mortgage Status in Wadley
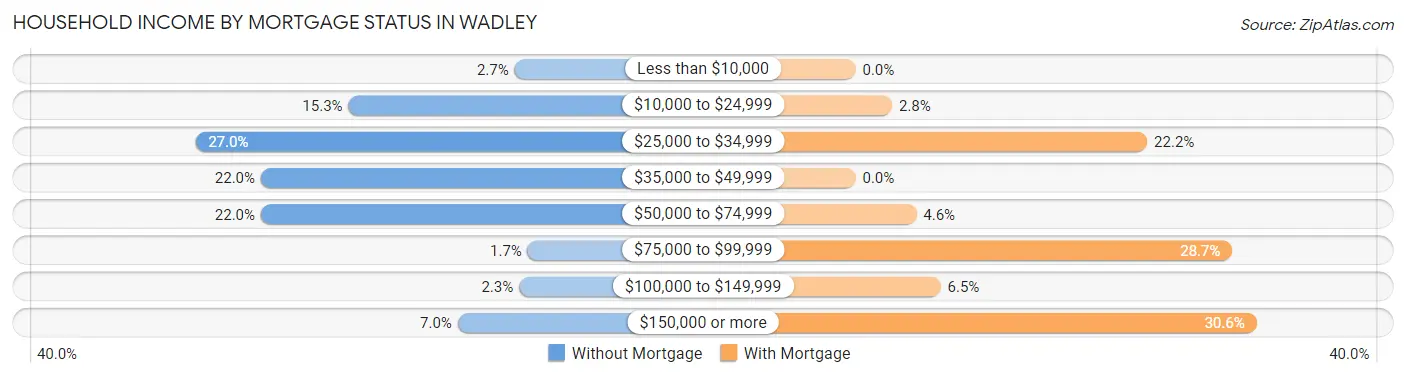
| Household Income | Without Mortgage | With Mortgage |
| Less than $10,000 | 8 (2.7%) | 0 (0.0%) |
| $10,000 to $24,999 | 46 (15.3%) | 3 (2.8%) |
| $25,000 to $34,999 | 81 (27.0%) | 24 (22.2%) |
| $35,000 to $49,999 | 66 (22.0%) | 0 (0.0%) |
| $50,000 to $74,999 | 66 (22.0%) | 5 (4.6%) |
| $75,000 to $99,999 | 5 (1.7%) | 31 (28.7%) |
| $100,000 to $149,999 | 7 (2.3%) | 7 (6.5%) |
| $150,000 or more | 21 (7.0%) | 33 (30.6%) |
| Total | 300 (100.0%) | 108 (100.0%) |
Property Value to Household Income Ratio in Wadley
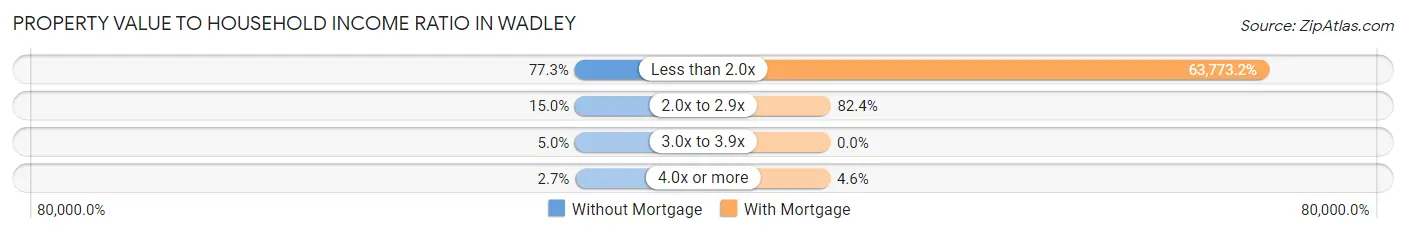
| Value-to-Income Ratio | Without Mortgage | With Mortgage |
| Less than 2.0x | 232 (77.3%) | 68,875 (63,773.1%) |
| 2.0x to 2.9x | 45 (15.0%) | 89 (82.4%) |
| 3.0x to 3.9x | 15 (5.0%) | 0 (0.0%) |
| 4.0x or more | 8 (2.7%) | 5 (4.6%) |
| Total | 300 (100.0%) | 108 (100.0%) |
Real Estate Taxes by Mortgage Status in Wadley
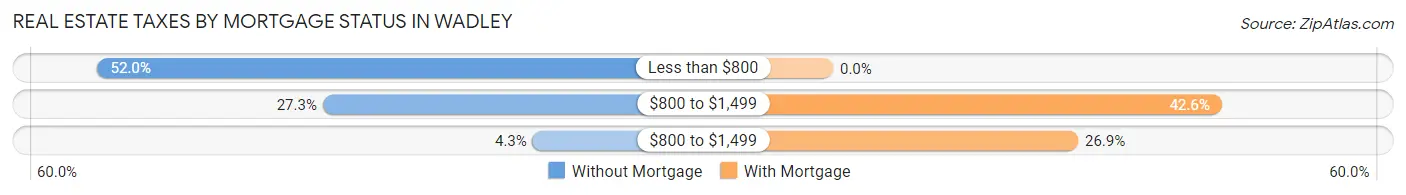
| Property Taxes | Without Mortgage | With Mortgage |
| Less than $800 | 156 (52.0%) | 0 (0.0%) |
| $800 to $1,499 | 82 (27.3%) | 46 (42.6%) |
| $800 to $1,499 | 13 (4.3%) | 29 (26.9%) |
| Total | 300 (100.0%) | 108 (100.0%) |
Health & Disability in Wadley
Health Insurance Coverage by Age in Wadley
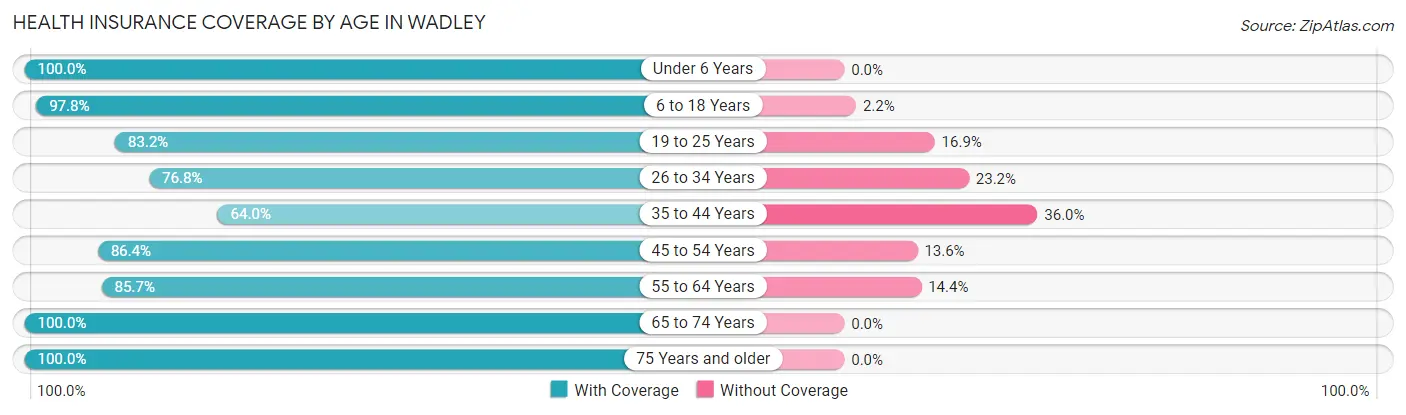
| Age Bracket | With Coverage | Without Coverage |
| Under 6 Years | 231 (100.0%) | 0 (0.0%) |
| 6 to 18 Years | 448 (97.8%) | 10 (2.2%) |
| 19 to 25 Years | 148 (83.2%) | 30 (16.9%) |
| 26 to 34 Years | 76 (76.8%) | 23 (23.2%) |
| 35 to 44 Years | 176 (64.0%) | 99 (36.0%) |
| 45 to 54 Years | 209 (86.4%) | 33 (13.6%) |
| 55 to 64 Years | 179 (85.7%) | 30 (14.3%) |
| 65 to 74 Years | 177 (100.0%) | 0 (0.0%) |
| 75 Years and older | 90 (100.0%) | 0 (0.0%) |
| Total | 1,734 (88.5%) | 225 (11.5%) |
Health Insurance Coverage by Citizenship Status in Wadley
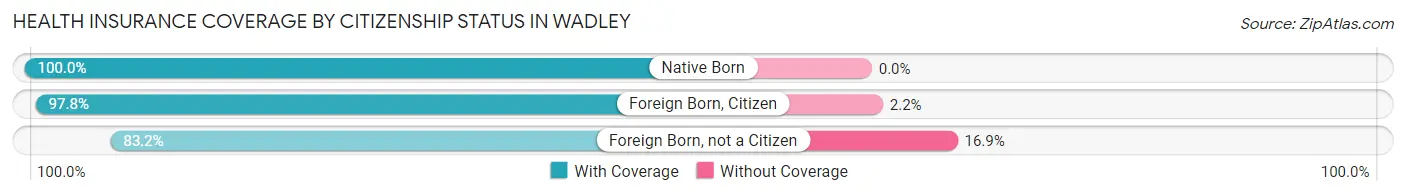
| Citizenship Status | With Coverage | Without Coverage |
| Native Born | 231 (100.0%) | 0 (0.0%) |
| Foreign Born, Citizen | 448 (97.8%) | 10 (2.2%) |
| Foreign Born, not a Citizen | 148 (83.2%) | 30 (16.9%) |
Health Insurance Coverage by Household Income in Wadley
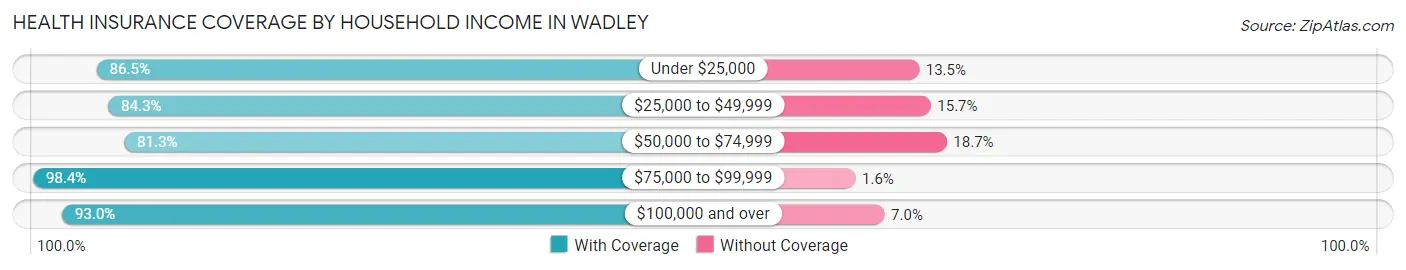
| Household Income | With Coverage | Without Coverage |
| Under $25,000 | 468 (86.5%) | 73 (13.5%) |
| $25,000 to $49,999 | 350 (84.3%) | 65 (15.7%) |
| $50,000 to $74,999 | 218 (81.3%) | 50 (18.7%) |
| $75,000 to $99,999 | 316 (98.4%) | 5 (1.6%) |
| $100,000 and over | 372 (93.0%) | 28 (7.0%) |
Public vs Private Health Insurance Coverage by Age in Wadley
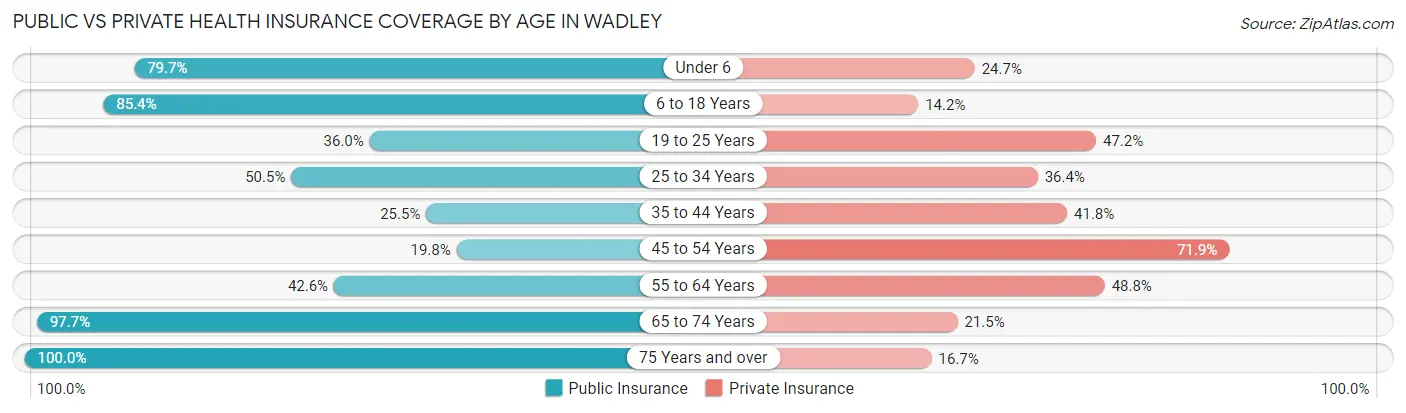
| Age Bracket | Public Insurance | Private Insurance |
| Under 6 | 184 (79.6%) | 57 (24.7%) |
| 6 to 18 Years | 391 (85.4%) | 65 (14.2%) |
| 19 to 25 Years | 64 (36.0%) | 84 (47.2%) |
| 25 to 34 Years | 50 (50.5%) | 36 (36.4%) |
| 35 to 44 Years | 70 (25.5%) | 115 (41.8%) |
| 45 to 54 Years | 48 (19.8%) | 174 (71.9%) |
| 55 to 64 Years | 89 (42.6%) | 102 (48.8%) |
| 65 to 74 Years | 173 (97.7%) | 38 (21.5%) |
| 75 Years and over | 90 (100.0%) | 15 (16.7%) |
| Total | 1,159 (59.2%) | 686 (35.0%) |
Disability Status by Sex by Age in Wadley
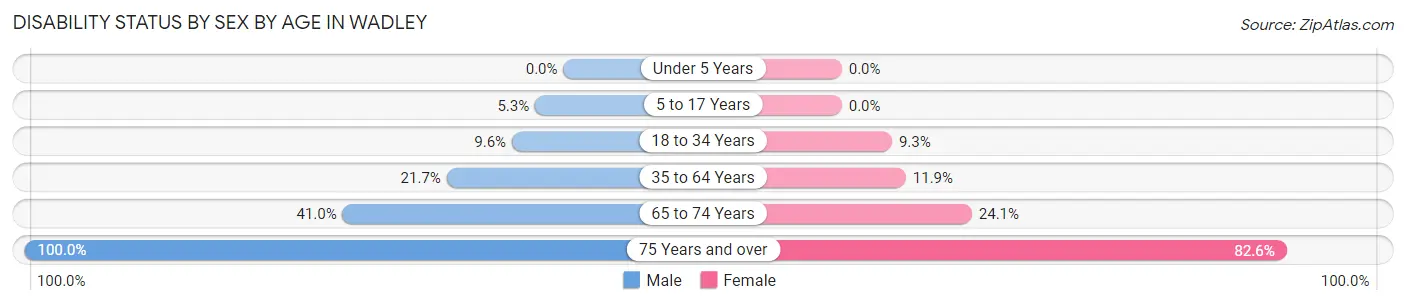
| Age Bracket | Male | Female |
| Under 5 Years | 0 (0.0%) | 0 (0.0%) |
| 5 to 17 Years | 8 (5.3%) | 0 (0.0%) |
| 18 to 34 Years | 19 (9.6%) | 19 (9.3%) |
| 35 to 64 Years | 68 (21.7%) | 49 (11.9%) |
| 65 to 74 Years | 25 (41.0%) | 28 (24.1%) |
| 75 Years and over | 4 (100.0%) | 71 (82.6%) |
Disability Class by Sex by Age in Wadley
Disability Class: Hearing Difficulty
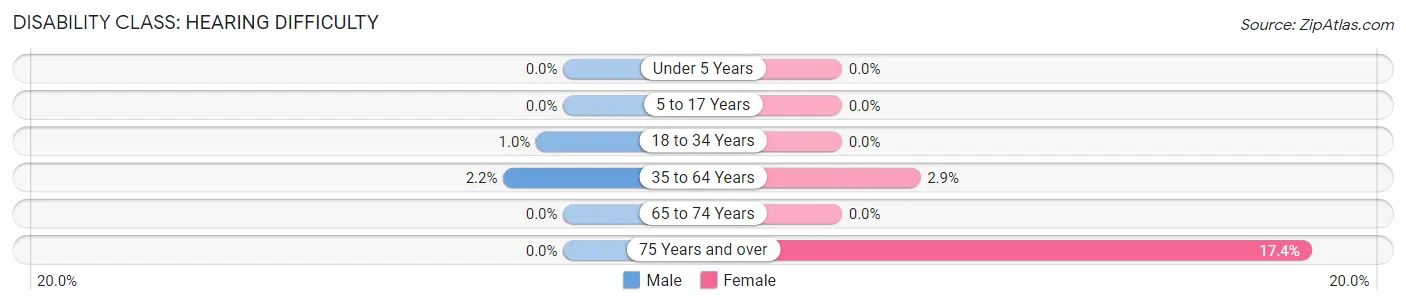
| Age Bracket | Male | Female |
| Under 5 Years | 0 (0.0%) | 0 (0.0%) |
| 5 to 17 Years | 0 (0.0%) | 0 (0.0%) |
| 18 to 34 Years | 2 (1.0%) | 0 (0.0%) |
| 35 to 64 Years | 7 (2.2%) | 12 (2.9%) |
| 65 to 74 Years | 0 (0.0%) | 0 (0.0%) |
| 75 Years and over | 0 (0.0%) | 15 (17.4%) |
Disability Class: Vision Difficulty
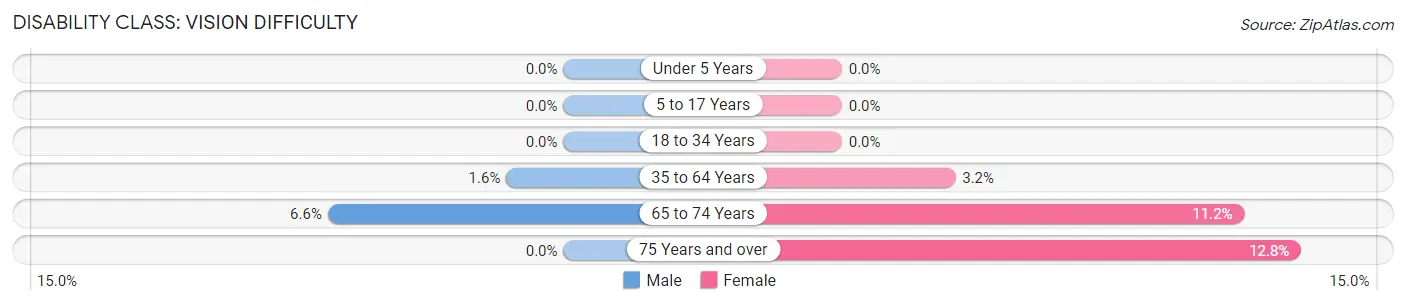
| Age Bracket | Male | Female |
| Under 5 Years | 0 (0.0%) | 0 (0.0%) |
| 5 to 17 Years | 0 (0.0%) | 0 (0.0%) |
| 18 to 34 Years | 0 (0.0%) | 0 (0.0%) |
| 35 to 64 Years | 5 (1.6%) | 13 (3.2%) |
| 65 to 74 Years | 4 (6.6%) | 13 (11.2%) |
| 75 Years and over | 0 (0.0%) | 11 (12.8%) |
Disability Class: Cognitive Difficulty
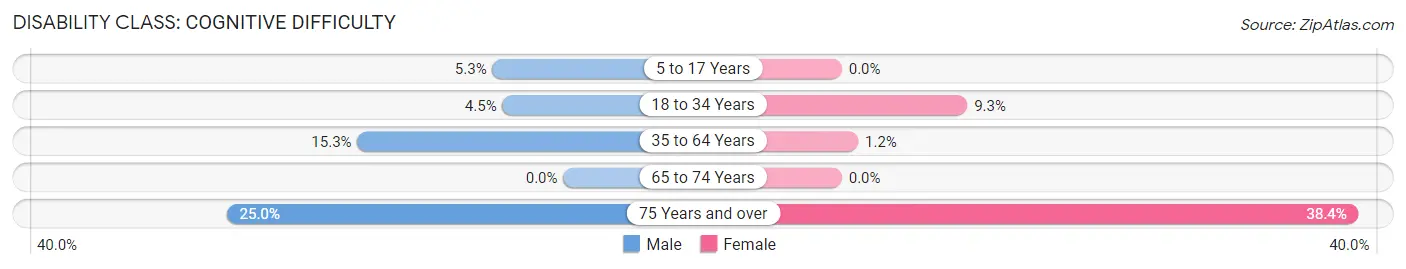
| Age Bracket | Male | Female |
| 5 to 17 Years | 8 (5.3%) | 0 (0.0%) |
| 18 to 34 Years | 9 (4.5%) | 19 (9.3%) |
| 35 to 64 Years | 48 (15.3%) | 5 (1.2%) |
| 65 to 74 Years | 0 (0.0%) | 0 (0.0%) |
| 75 Years and over | 1 (25.0%) | 33 (38.4%) |
Disability Class: Ambulatory Difficulty
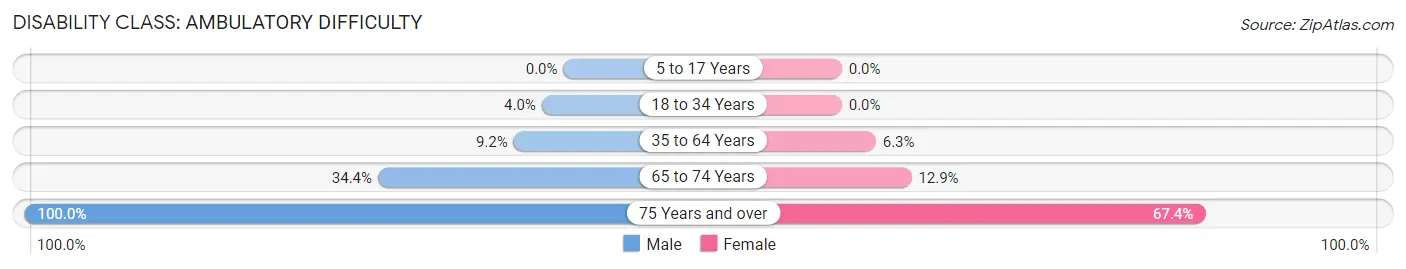
| Age Bracket | Male | Female |
| 5 to 17 Years | 0 (0.0%) | 0 (0.0%) |
| 18 to 34 Years | 8 (4.0%) | 0 (0.0%) |
| 35 to 64 Years | 29 (9.2%) | 26 (6.3%) |
| 65 to 74 Years | 21 (34.4%) | 15 (12.9%) |
| 75 Years and over | 4 (100.0%) | 58 (67.4%) |
Disability Class: Self-Care Difficulty
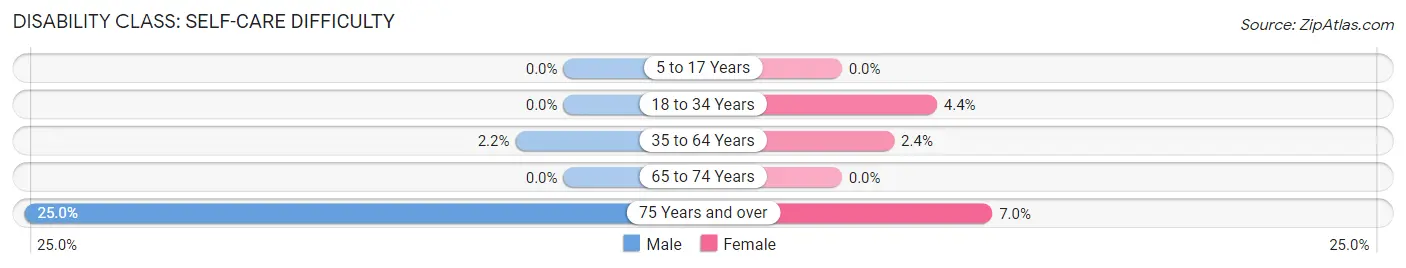
| Age Bracket | Male | Female |
| 5 to 17 Years | 0 (0.0%) | 0 (0.0%) |
| 18 to 34 Years | 0 (0.0%) | 9 (4.4%) |
| 35 to 64 Years | 7 (2.2%) | 10 (2.4%) |
| 65 to 74 Years | 0 (0.0%) | 0 (0.0%) |
| 75 Years and over | 1 (25.0%) | 6 (7.0%) |
Technology Access in Wadley
Computing Device Access in Wadley
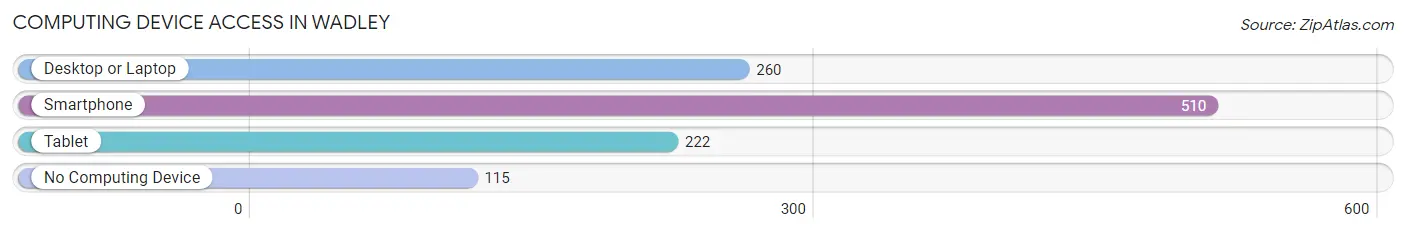
| Device Type | # Households | % Households |
| Desktop or Laptop | 260 | 40.9% |
| Smartphone | 510 | 80.3% |
| Tablet | 222 | 35.0% |
| No Computing Device | 115 | 18.1% |
| Total | 635 | 100.0% |
Internet Access in Wadley
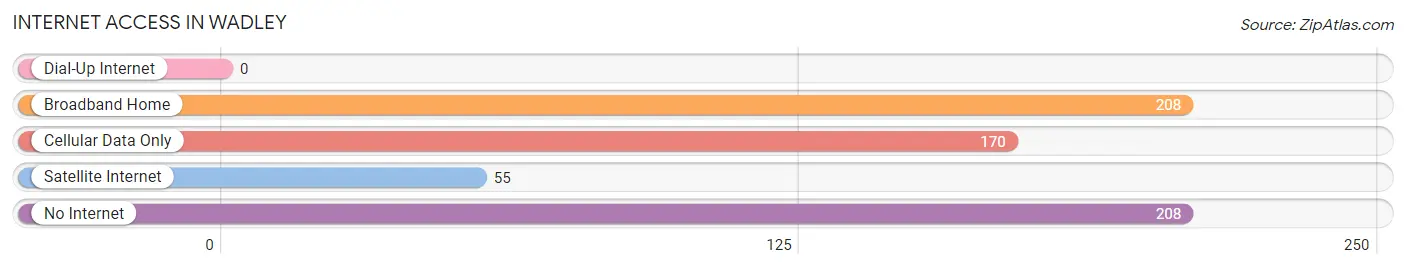
| Internet Type | # Households | % Households |
| Dial-Up Internet | 0 | 0.0% |
| Broadband Home | 208 | 32.8% |
| Cellular Data Only | 170 | 26.8% |
| Satellite Internet | 55 | 8.7% |
| No Internet | 208 | 32.8% |
| Total | 635 | 100.0% |
Wadley Summary
Wadley is a small city located in Jefferson County, Georgia, United States. It is situated in the foothills of the Appalachian Mountains, approximately 30 miles east of Athens. The city has a population of 1,845 as of the 2010 census.
History
The area that is now Wadley was first settled in the early 1800s by settlers from North Carolina. The town was originally known as "Wadley's Station" after the local postmaster, William Wadley. The town was officially incorporated in 1891.
In the early 1900s, Wadley was a thriving agricultural community. The town was home to several cotton gins, a sawmill, and a gristmill. The town also had a railroad station, which connected it to the larger cities of Athens and Augusta.
In the 1950s, Wadley began to experience a decline in population as many of its residents moved away in search of better economic opportunities. The town's population has remained relatively stable since then, with a slight increase in recent years.
Geography
Wadley is located at 33°45'N 82°51'W. It is situated in the foothills of the Appalachian Mountains, approximately 30 miles east of Athens. The city has a total area of 1.7 square miles, all of which is land.
The city is located in a hilly region, with elevations ranging from 600 to 800 feet above sea level. The city is drained by several small creeks, including the Oconee River, which flows through the city.
Economy
The economy of Wadley is largely based on agriculture. The city is home to several farms, which produce a variety of crops, including cotton, corn, soybeans, and peanuts. The city also has several small businesses, including a grocery store, a hardware store, and a restaurant.
The city is also home to several manufacturing companies, including a furniture factory and a textile mill. The city is also home to a small airport, which serves the surrounding area.
Demographics
As of the 2010 census, the population of Wadley was 1,845. The racial makeup of the city was 79.3% White, 17.2% African American, 0.3% Native American, 0.2% Asian, 0.1% Pacific Islander, and 2.9% from other races. Hispanic or Latino of any race were 2.3% of the population.
The median household income in Wadley was $30,938, and the median family income was $37,813. The per capita income for the city was $15,945. About 17.2% of families and 20.3% of the population were below the poverty line, including 28.3% of those under age 18 and 15.2% of those age 65 or over.
Conclusion
Wadley is a small city located in Jefferson County, Georgia, United States. It is situated in the foothills of the Appalachian Mountains, approximately 30 miles east of Athens. The city has a population of 1,845 as of the 2010 census. The economy of Wadley is largely based on agriculture, with several farms producing a variety of crops. The city also has several small businesses and manufacturing companies. The racial makeup of the city is 79.3% White, 17.2% African American, 0.3% Native American, 0.2% Asian, 0.1% Pacific Islander, and 2.9% from other races. The median household income in Wadley was $30,938, and the median family income was $37,813. About 17.2% of families and 20.3% of the population were below the poverty line.
Common Questions
What is Per Capita Income in Wadley?
Per Capita income in Wadley is $20,460.
What is the Median Family Income in Wadley?
Median Family Income in Wadley is $43,750.
What is the Median Household income in Wadley?
Median Household Income in Wadley is $36,406.
What is Income or Wage Gap in Wadley?
Income or Wage Gap in Wadley is 23.9%.
Women in Wadley earn 76.1 cents for every dollar earned by a man.
What is Inequality or Gini Index in Wadley?
Inequality or Gini Index in Wadley is 0.48.
What is the Total Population of Wadley?
Total Population of Wadley is 2,049.
What is the Total Male Population of Wadley?
Total Male Population of Wadley is 816.
What is the Total Female Population of Wadley?
Total Female Population of Wadley is 1,233.
What is the Ratio of Males per 100 Females in Wadley?
There are 66.18 Males per 100 Females in Wadley.
What is the Ratio of Females per 100 Males in Wadley?
There are 151.10 Females per 100 Males in Wadley.
What is the Median Population Age in Wadley?
Median Population Age in Wadley is 36.4 Years.
What is the Average Family Size in Wadley
Average Family Size in Wadley is 4.0 People.
What is the Average Household Size in Wadley
Average Household Size in Wadley is 3.1 People.
How Large is the Labor Force in Wadley?
There are 704 People in the Labor Forcein in Wadley.
What is the Percentage of People in the Labor Force in Wadley?
45.7% of People are in the Labor Force in Wadley.
What is the Unemployment Rate in Wadley?
Unemployment Rate in Wadley is 10.1%.