Camilla, GA Map & Demographics
Camilla Map
Camilla Overview
$22,648
PER CAPITA INCOME
$25,500
AVG FAMILY INCOME
$27,306
AVG HOUSEHOLD INCOME
47.5%
WAGE / INCOME GAP [ % ]
52.5¢/ $1
WAGE / INCOME GAP [ $ ]
0.54
INEQUALITY / GINI INDEX
5,163
TOTAL POPULATION
2,402
MALE POPULATION
2,761
FEMALE POPULATION
87.00
MALES / 100 FEMALES
114.95
FEMALES / 100 MALES
40.6
MEDIAN AGE
3.2
AVG FAMILY SIZE
2.3
AVG HOUSEHOLD SIZE
1,882
LABOR FORCE [ PEOPLE ]
48.3%
PERCENT IN LABOR FORCE
11.3%
UNEMPLOYMENT RATE
Camilla Zip Codes
Camilla Area Codes
Income in Camilla
Income Overview in Camilla
Per Capita Income in Camilla is $22,648, while median incomes of families and households are $25,500 and $27,306 respectively.
| Characteristic | Number | Measure |
| Per Capita Income | 5,163 | $22,648 |
| Median Family Income | 1,218 | $25,500 |
| Mean Family Income | 1,218 | $56,579 |
| Median Household Income | 2,195 | $27,306 |
| Mean Household Income | 2,195 | $47,951 |
| Income Deficit | 1,218 | $0 |
| Wage / Income Gap (%) | 5,163 | 47.47% |
| Wage / Income Gap ($) | 5,163 | 52.53¢ per $1 |
| Gini / Inequality Index | 5,163 | 0.54 |
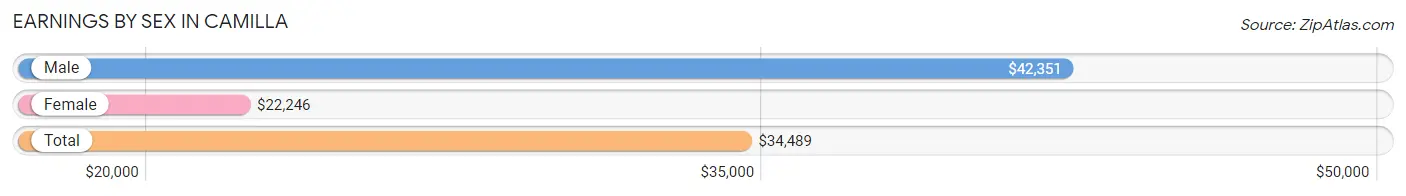
Earnings by Sex in Camilla
Average Earnings in Camilla are $34,489, $42,351 for men and $22,246 for women, a difference of 47.5%.
| Sex | Number | Average Earnings |
| Male | 1,141 (59.6%) | $42,351 |
| Female | 774 (40.4%) | $22,246 |
| Total | 1,915 (100.0%) | $34,489 |
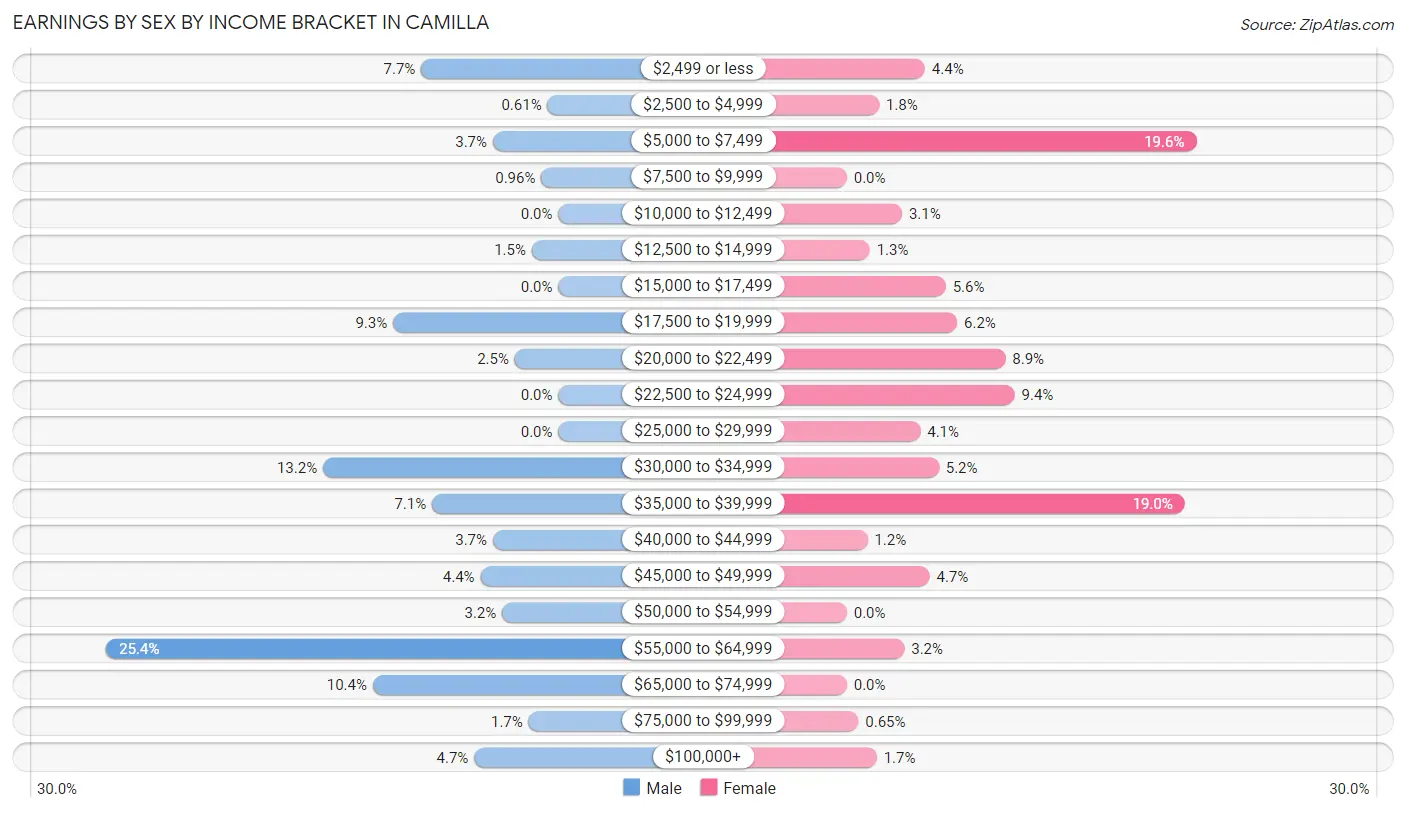
Earnings by Sex by Income Bracket in Camilla
The most common earnings brackets in Camilla are $55,000 to $64,999 for men (290 | 25.4%) and $5,000 to $7,499 for women (152 | 19.6%).
| Income | Male | Female |
| $2,499 or less | 88 (7.7%) | 34 (4.4%) |
| $2,500 to $4,999 | 7 (0.6%) | 14 (1.8%) |
| $5,000 to $7,499 | 42 (3.7%) | 152 (19.6%) |
| $7,500 to $9,999 | 11 (1.0%) | 0 (0.0%) |
| $10,000 to $12,499 | 0 (0.0%) | 24 (3.1%) |
| $12,500 to $14,999 | 17 (1.5%) | 10 (1.3%) |
| $15,000 to $17,499 | 0 (0.0%) | 43 (5.6%) |
| $17,500 to $19,999 | 106 (9.3%) | 48 (6.2%) |
| $20,000 to $22,499 | 28 (2.5%) | 69 (8.9%) |
| $22,500 to $24,999 | 0 (0.0%) | 73 (9.4%) |
| $25,000 to $29,999 | 0 (0.0%) | 32 (4.1%) |
| $30,000 to $34,999 | 151 (13.2%) | 40 (5.2%) |
| $35,000 to $39,999 | 81 (7.1%) | 147 (19.0%) |
| $40,000 to $44,999 | 42 (3.7%) | 9 (1.2%) |
| $45,000 to $49,999 | 50 (4.4%) | 36 (4.6%) |
| $50,000 to $54,999 | 36 (3.2%) | 0 (0.0%) |
| $55,000 to $64,999 | 290 (25.4%) | 25 (3.2%) |
| $65,000 to $74,999 | 119 (10.4%) | 0 (0.0%) |
| $75,000 to $99,999 | 19 (1.7%) | 5 (0.6%) |
| $100,000+ | 54 (4.7%) | 13 (1.7%) |
| Total | 1,141 (100.0%) | 774 (100.0%) |
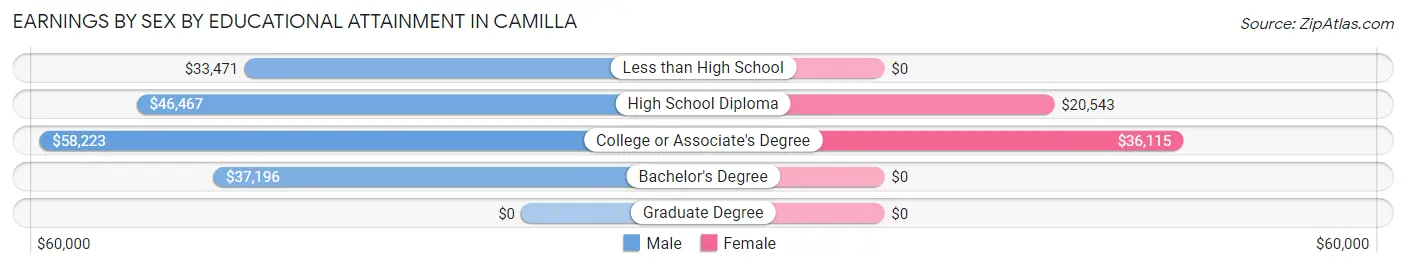
Earnings by Sex by Educational Attainment in Camilla
Average earnings in Camilla are $52,535 for men and $22,708 for women, a difference of 56.8%. Men with an educational attainment of college or associate's degree enjoy the highest average annual earnings of $58,223, while those with less than high school education earn the least with $33,471. Women with an educational attainment of college or associate's degree earn the most with the average annual earnings of $36,115, while those with high school diploma education have the smallest earnings of $20,543.
| Educational Attainment | Male Income | Female Income |
| Less than High School | $33,471 | $0 |
| High School Diploma | $46,467 | $20,543 |
| College or Associate's Degree | $58,223 | $36,115 |
| Bachelor's Degree | $37,196 | $0 |
| Graduate Degree | - | - |
| Total | $52,535 | $22,708 |
Family Income in Camilla
Family Income Brackets in Camilla
According to the Camilla family income data, there are 341 families falling into the less than $10,000 income range, which is the most common income bracket and makes up 28.0% of all families. Conversely, the $100,000 to $149,999 income bracket is the least frequent group with only 24 families (2.0%) belonging to this category.
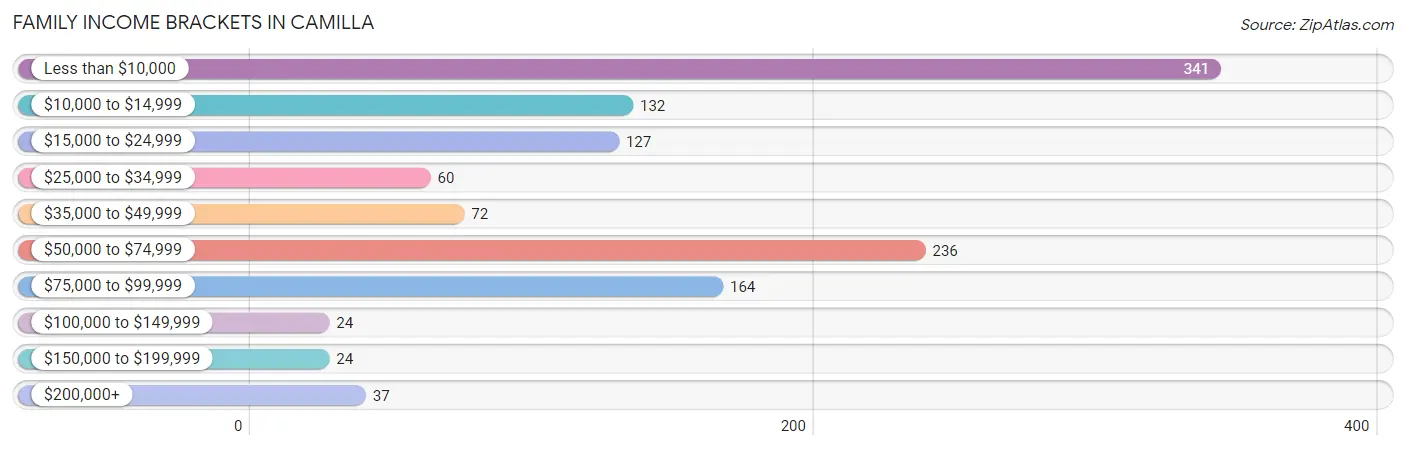
| Income Bracket | # Families | % Families |
| Less than $10,000 | 341 | 28.0% |
| $10,000 to $14,999 | 132 | 10.8% |
| $15,000 to $24,999 | 127 | 10.4% |
| $25,000 to $34,999 | 60 | 4.9% |
| $35,000 to $49,999 | 72 | 5.9% |
| $50,000 to $74,999 | 236 | 19.4% |
| $75,000 to $99,999 | 164 | 13.5% |
| $100,000 to $149,999 | 24 | 2.0% |
| $150,000 to $199,999 | 24 | 2.0% |
| $200,000+ | 37 | 3.0% |
Family Income by Famaliy Size in Camilla
4-person families (91 | 7.5%) account for the highest median family income in Camilla with $77,399 per family, while 2-person families (490 | 40.2%) have the highest median income of $21,294 per family member.
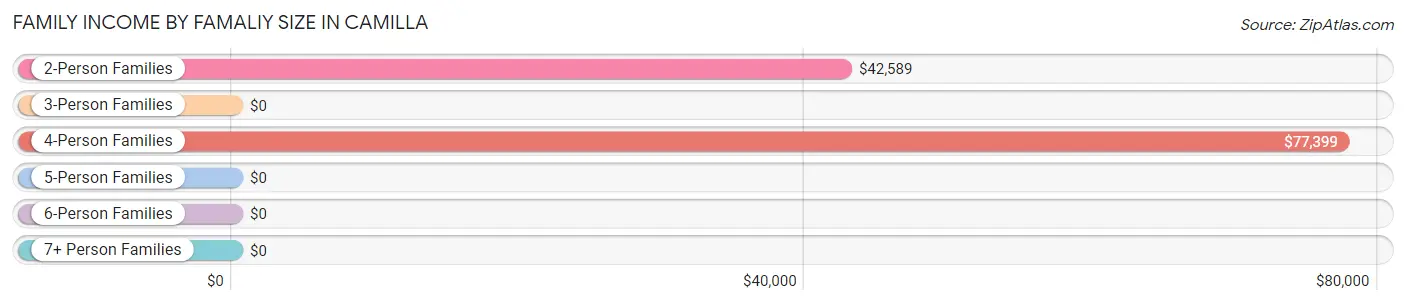
| Income Bracket | # Families | Median Income |
| 2-Person Families | 490 (40.2%) | $42,589 |
| 3-Person Families | 188 (15.4%) | $0 |
| 4-Person Families | 91 (7.5%) | $77,399 |
| 5-Person Families | 417 (34.2%) | $0 |
| 6-Person Families | 8 (0.7%) | $0 |
| 7+ Person Families | 24 (2.0%) | $0 |
| Total | 1,218 (100.0%) | $25,500 |
Family Income by Number of Earners in Camilla
The median family income in Camilla is $25,500, with families comprising 3+ earners (44) having the highest median family income of $108,929, while families with no earners (487) have the lowest median family income of $6,792, accounting for 3.6% and 40.0% of families, respectively.
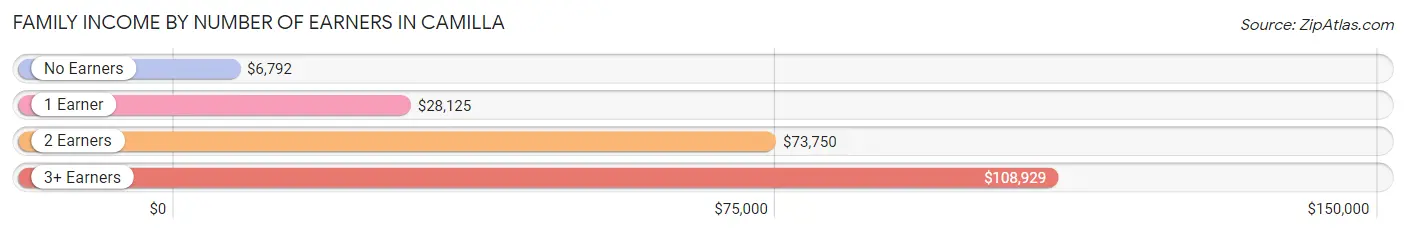
| Number of Earners | # Families | Median Income |
| No Earners | 487 (40.0%) | $6,792 |
| 1 Earner | 369 (30.3%) | $28,125 |
| 2 Earners | 318 (26.1%) | $73,750 |
| 3+ Earners | 44 (3.6%) | $108,929 |
| Total | 1,218 (100.0%) | $25,500 |
Household Income in Camilla
Household Income Brackets in Camilla
With 637 households falling in the category, the $50,000 to $74,999 income range is the most frequent in Camilla, accounting for 29.0% of all households. In contrast, only 24 households (1.1%) fall into the $150,000 to $199,999 income bracket, making it the least populous group.
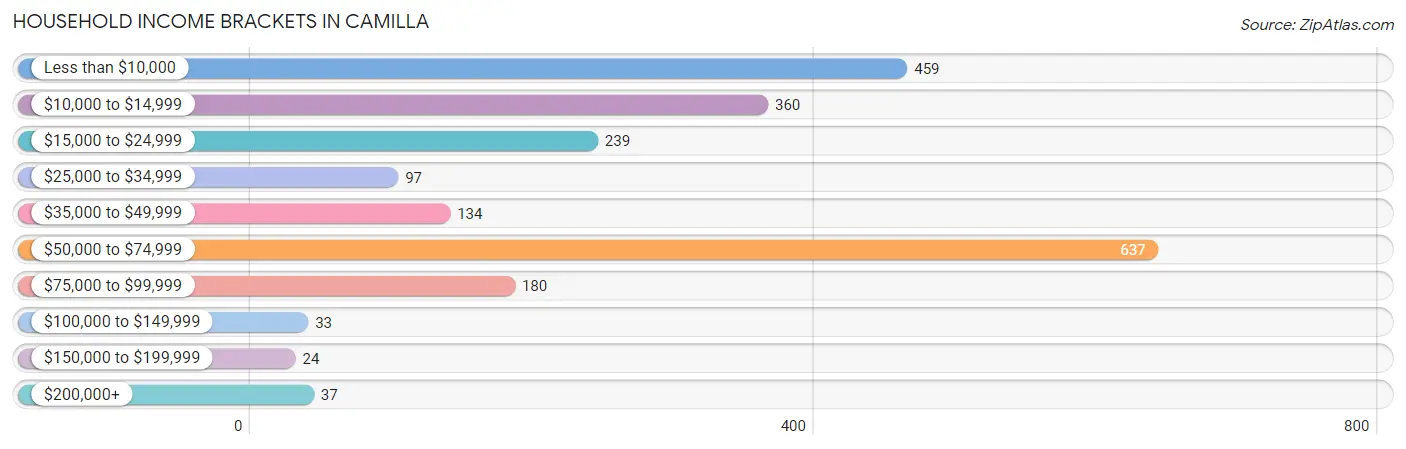
| Income Bracket | # Households | % Households |
| Less than $10,000 | 459 | 20.9% |
| $10,000 to $14,999 | 360 | 16.4% |
| $15,000 to $24,999 | 239 | 10.9% |
| $25,000 to $34,999 | 97 | 4.4% |
| $35,000 to $49,999 | 134 | 6.1% |
| $50,000 to $74,999 | 637 | 29.0% |
| $75,000 to $99,999 | 180 | 8.2% |
| $100,000 to $149,999 | 33 | 1.5% |
| $150,000 to $199,999 | 24 | 1.1% |
| $200,000+ | 37 | 1.7% |
Household Income by Householder Age in Camilla
The median household income in Camilla is $27,306, with the highest median household income of $63,170 found in the 25 to 44 years age bracket for the primary householder. A total of 872 households (39.7%) fall into this category. Meanwhile, the 15 to 24 years age bracket for the primary householder has the lowest median household income of $0, with 84 households (3.8%) in this group.
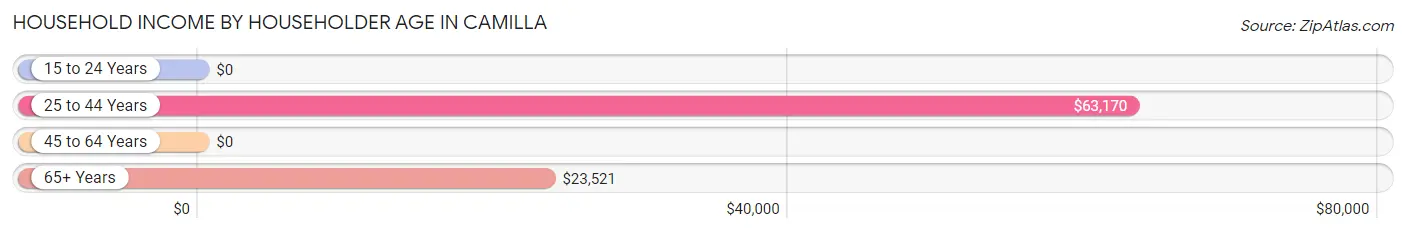
| Income Bracket | # Households | Median Income |
| 15 to 24 Years | 84 (3.8%) | $0 |
| 25 to 44 Years | 872 (39.7%) | $63,170 |
| 45 to 64 Years | 620 (28.2%) | $0 |
| 65+ Years | 619 (28.2%) | $23,521 |
| Total | 2,195 (100.0%) | $27,306 |
Poverty in Camilla
Income Below Poverty by Sex and Age in Camilla
With 29.5% poverty level for males and 61.8% for females among the residents of Camilla, 16 and 17 year old males and 5 year old females are the most vulnerable to poverty, with 77 males (87.5%) and 57 females (100.0%) in their respective age groups living below the poverty level.
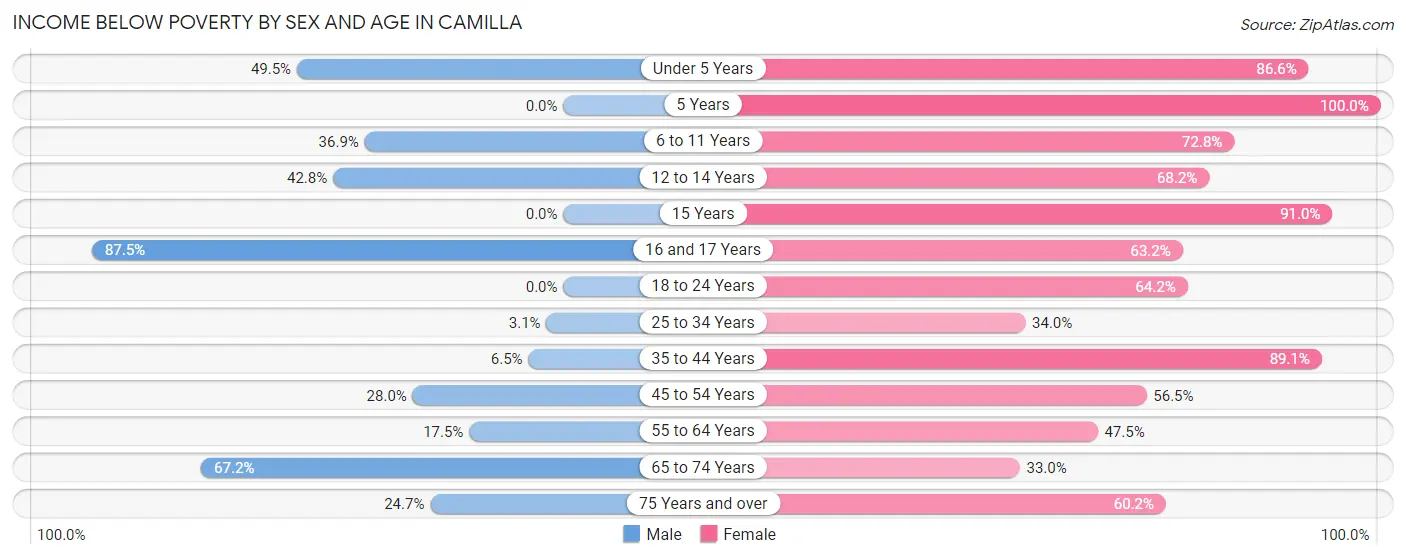
| Age Bracket | Male | Female |
| Under 5 Years | 136 (49.4%) | 188 (86.6%) |
| 5 Years | 0 (0.0%) | 57 (100.0%) |
| 6 to 11 Years | 52 (36.9%) | 225 (72.8%) |
| 12 to 14 Years | 59 (42.7%) | 15 (68.2%) |
| 15 Years | 0 (0.0%) | 71 (91.0%) |
| 16 and 17 Years | 77 (87.5%) | 43 (63.2%) |
| 18 to 24 Years | 0 (0.0%) | 95 (64.2%) |
| 25 to 34 Years | 7 (3.1%) | 83 (34.0%) |
| 35 to 44 Years | 30 (6.5%) | 277 (89.1%) |
| 45 to 54 Years | 80 (28.0%) | 199 (56.5%) |
| 55 to 64 Years | 43 (17.5%) | 168 (47.5%) |
| 65 to 74 Years | 201 (67.2%) | 95 (33.0%) |
| 75 Years and over | 21 (24.7%) | 163 (60.2%) |
| Total | 706 (29.5%) | 1,679 (61.8%) |
Income Above Poverty by Sex and Age in Camilla
According to the poverty statistics in Camilla, males aged 5 years and females aged 65 to 74 years are the age groups that are most secure financially, with 100.0% of males and 67.0% of females in these age groups living above the poverty line.
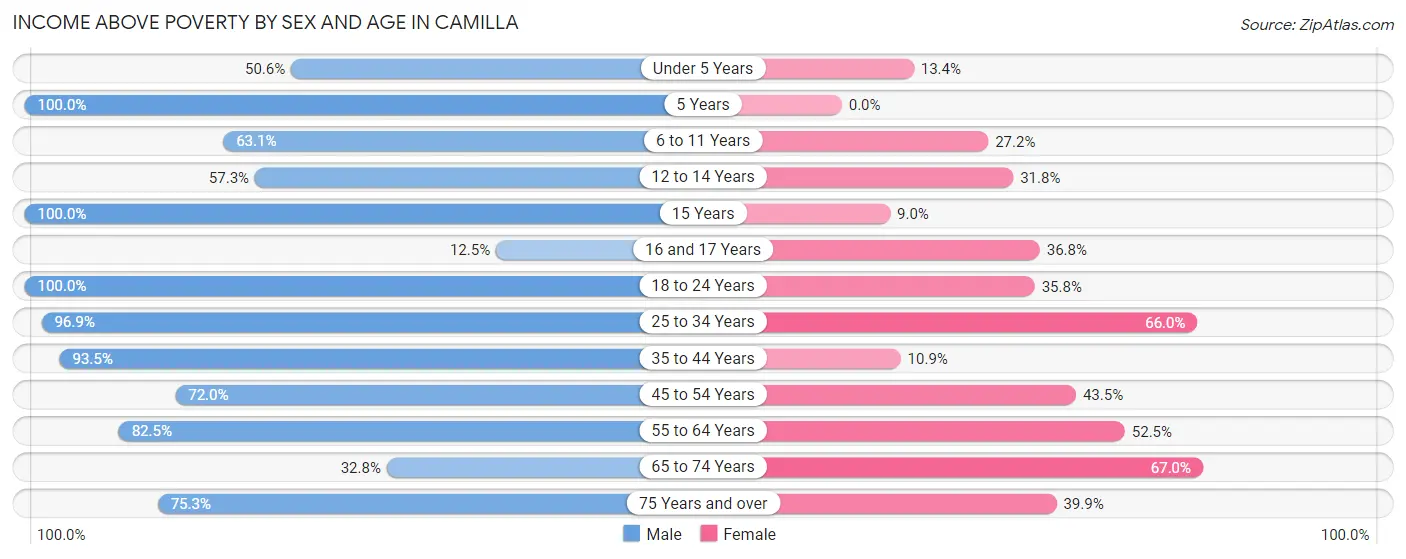
| Age Bracket | Male | Female |
| Under 5 Years | 139 (50.5%) | 29 (13.4%) |
| 5 Years | 14 (100.0%) | 0 (0.0%) |
| 6 to 11 Years | 89 (63.1%) | 84 (27.2%) |
| 12 to 14 Years | 79 (57.3%) | 7 (31.8%) |
| 15 Years | 15 (100.0%) | 7 (9.0%) |
| 16 and 17 Years | 11 (12.5%) | 25 (36.8%) |
| 18 to 24 Years | 117 (100.0%) | 53 (35.8%) |
| 25 to 34 Years | 216 (96.9%) | 161 (66.0%) |
| 35 to 44 Years | 433 (93.5%) | 34 (10.9%) |
| 45 to 54 Years | 206 (72.0%) | 153 (43.5%) |
| 55 to 64 Years | 203 (82.5%) | 186 (52.5%) |
| 65 to 74 Years | 98 (32.8%) | 193 (67.0%) |
| 75 Years and over | 64 (75.3%) | 108 (39.9%) |
| Total | 1,684 (70.5%) | 1,040 (38.3%) |
Income Below Poverty Among Married-Couple Families in Camilla
The poverty statistics for married-couple families in Camilla show that 7.6% or 36 of the total 475 families live below the poverty line. Families with no children have the highest poverty rate of 14.1%, comprising of 36 families. On the other hand, families with 1 or 2 children have the lowest poverty rate of 0.0%, which includes 0 families.
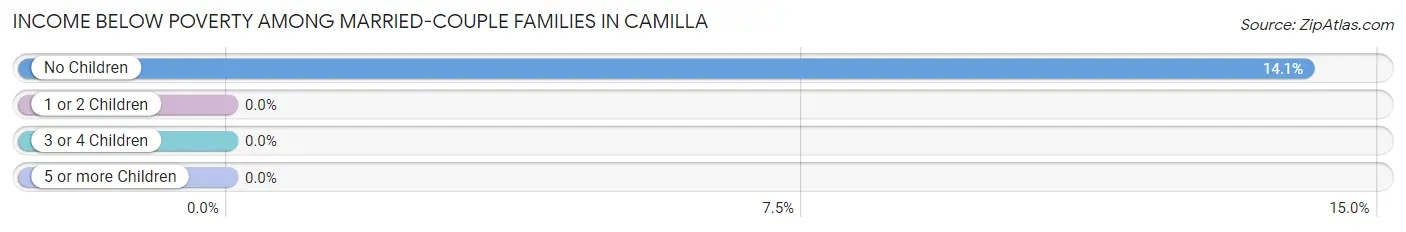
| Children | Above Poverty | Below Poverty |
| No Children | 220 (85.9%) | 36 (14.1%) |
| 1 or 2 Children | 101 (100.0%) | 0 (0.0%) |
| 3 or 4 Children | 118 (100.0%) | 0 (0.0%) |
| 5 or more Children | 0 (0.0%) | 0 (0.0%) |
| Total | 439 (92.4%) | 36 (7.6%) |
Income Below Poverty Among Single-Parent Households in Camilla
According to the poverty data in Camilla, 16.3% or 7 single-father households and 70.1% or 491 single-mother households are living below the poverty line. Among single-father households, those with 3 or 4 children have the highest poverty rate, with 7 households (100.0%) experiencing poverty. Likewise, among single-mother households, those with 3 or 4 children have the highest poverty rate, with 292 households (100.0%) falling below the poverty line.
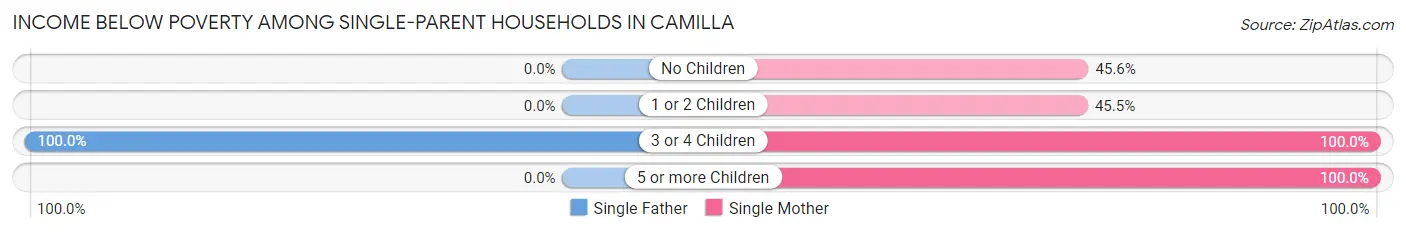
| Children | Single Father | Single Mother |
| No Children | 0 (0.0%) | 99 (45.6%) |
| 1 or 2 Children | 0 (0.0%) | 76 (45.5%) |
| 3 or 4 Children | 7 (100.0%) | 292 (100.0%) |
| 5 or more Children | 0 (0.0%) | 24 (100.0%) |
| Total | 7 (16.3%) | 491 (70.1%) |
Income Below Poverty Among Married-Couple vs Single-Parent Households in Camilla
The poverty data for Camilla shows that 36 of the married-couple family households (7.6%) and 498 of the single-parent households (67.0%) are living below the poverty level. Within the married-couple family households, those with no children have the highest poverty rate, with 36 households (14.1%) falling below the poverty line. Among the single-parent households, those with 3 or 4 children have the highest poverty rate, with 299 household (100.0%) living below poverty.
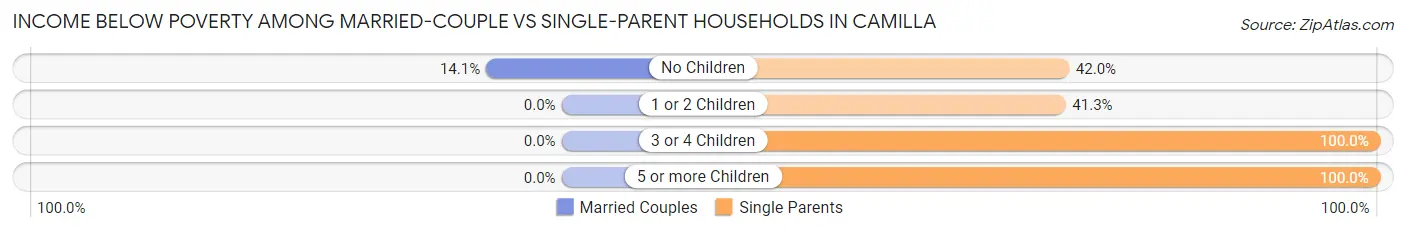
| Children | Married-Couple Families | Single-Parent Households |
| No Children | 36 (14.1%) | 99 (41.9%) |
| 1 or 2 Children | 0 (0.0%) | 76 (41.3%) |
| 3 or 4 Children | 0 (0.0%) | 299 (100.0%) |
| 5 or more Children | 0 (0.0%) | 24 (100.0%) |
| Total | 36 (7.6%) | 498 (67.0%) |
Race in Camilla
The most populous races in Camilla are Black / African American (3,515 | 68.1%), White / Caucasian (1,006 | 19.5%), and Two or more Races (434 | 8.4%).
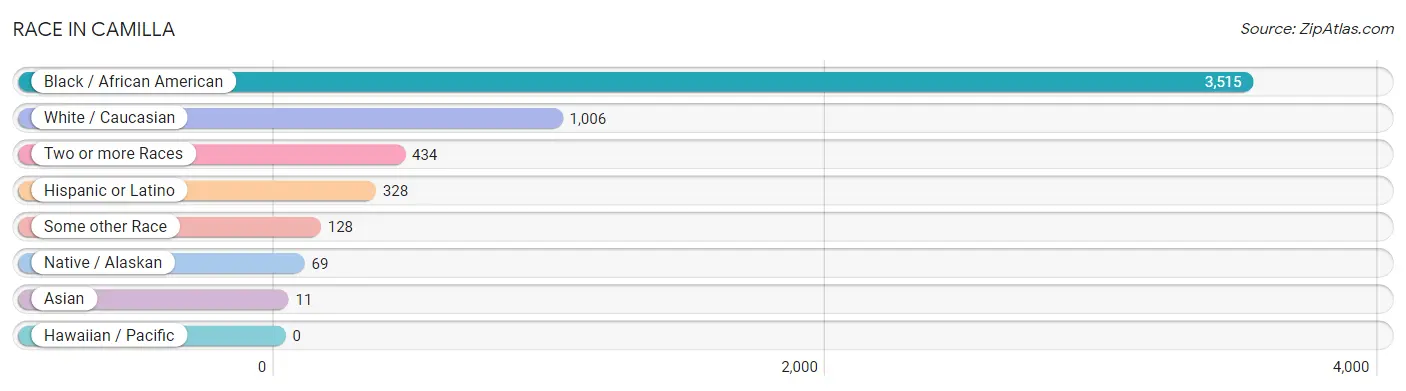
| Race | # Population | % Population |
| Asian | 11 | 0.2% |
| Black / African American | 3,515 | 68.1% |
| Hawaiian / Pacific | 0 | 0.0% |
| Hispanic or Latino | 328 | 6.4% |
| Native / Alaskan | 69 | 1.3% |
| White / Caucasian | 1,006 | 19.5% |
| Two or more Races | 434 | 8.4% |
| Some other Race | 128 | 2.5% |
| Total | 5,163 | 100.0% |
Ancestry in Camilla
The most populous ancestries reported in Camilla are Puerto Rican (306 | 5.9%), American (223 | 4.3%), English (151 | 2.9%), Subsaharan African (91 | 1.8%), and African (73 | 1.4%), together accounting for 16.3% of all Camilla residents.
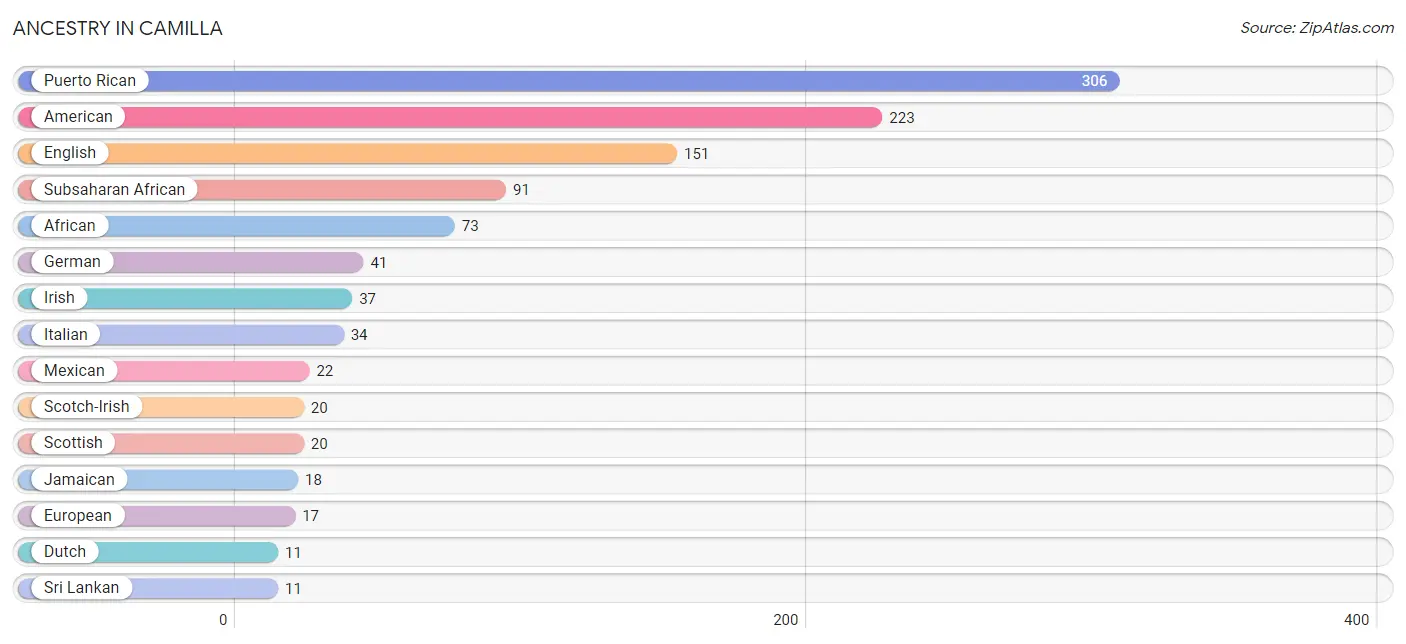
| Ancestry | # Population | % Population |
| African | 73 | 1.4% |
| American | 223 | 4.3% |
| Dutch | 11 | 0.2% |
| English | 151 | 2.9% |
| European | 17 | 0.3% |
| German | 41 | 0.8% |
| Greek | 1 | 0.0% |
| Haitian | 3 | 0.1% |
| Irish | 37 | 0.7% |
| Italian | 34 | 0.7% |
| Jamaican | 18 | 0.4% |
| Mexican | 22 | 0.4% |
| Puerto Rican | 306 | 5.9% |
| Scotch-Irish | 20 | 0.4% |
| Scottish | 20 | 0.4% |
| Sri Lankan | 11 | 0.2% |
| Subsaharan African | 91 | 1.8% |
| West Indian | 3 | 0.1% | View All 18 Rows |
Immigrants in Camilla
The most numerous immigrant groups reported in Camilla came from Latin America (153 | 3.0%), Central America (138 | 2.7%), El Salvador (138 | 2.7%), Africa (18 | 0.4%), and Western Africa (18 | 0.4%), together accounting for 9.0% of all Camilla residents.
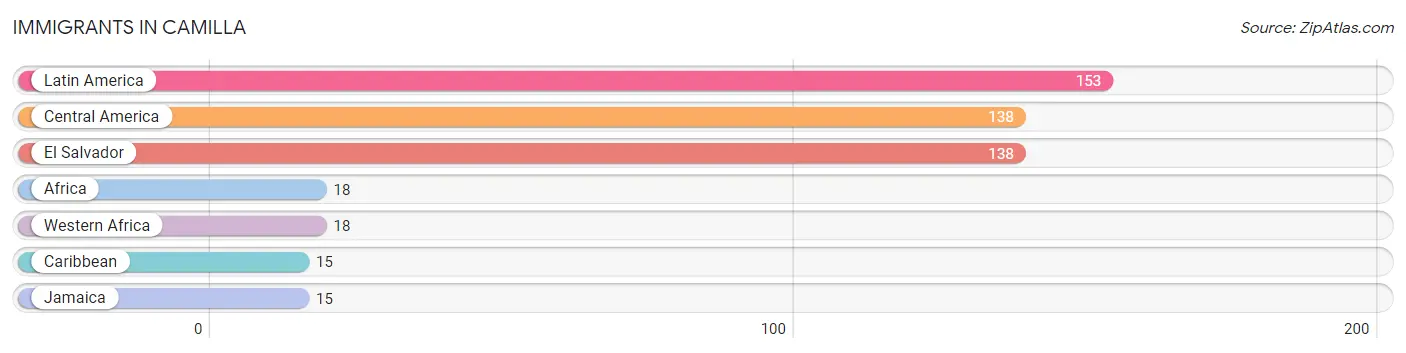
| Immigration Origin | # Population | % Population |
| Africa | 18 | 0.4% |
| Caribbean | 15 | 0.3% |
| Central America | 138 | 2.7% |
| El Salvador | 138 | 2.7% |
| Jamaica | 15 | 0.3% |
| Latin America | 153 | 3.0% |
| Western Africa | 18 | 0.4% | View All 7 Rows |
Sex and Age in Camilla
Sex and Age in Camilla
The most populous age groups in Camilla are 35 to 39 Years (297 | 12.4%) for men and 5 to 9 Years (341 | 12.3%) for women.
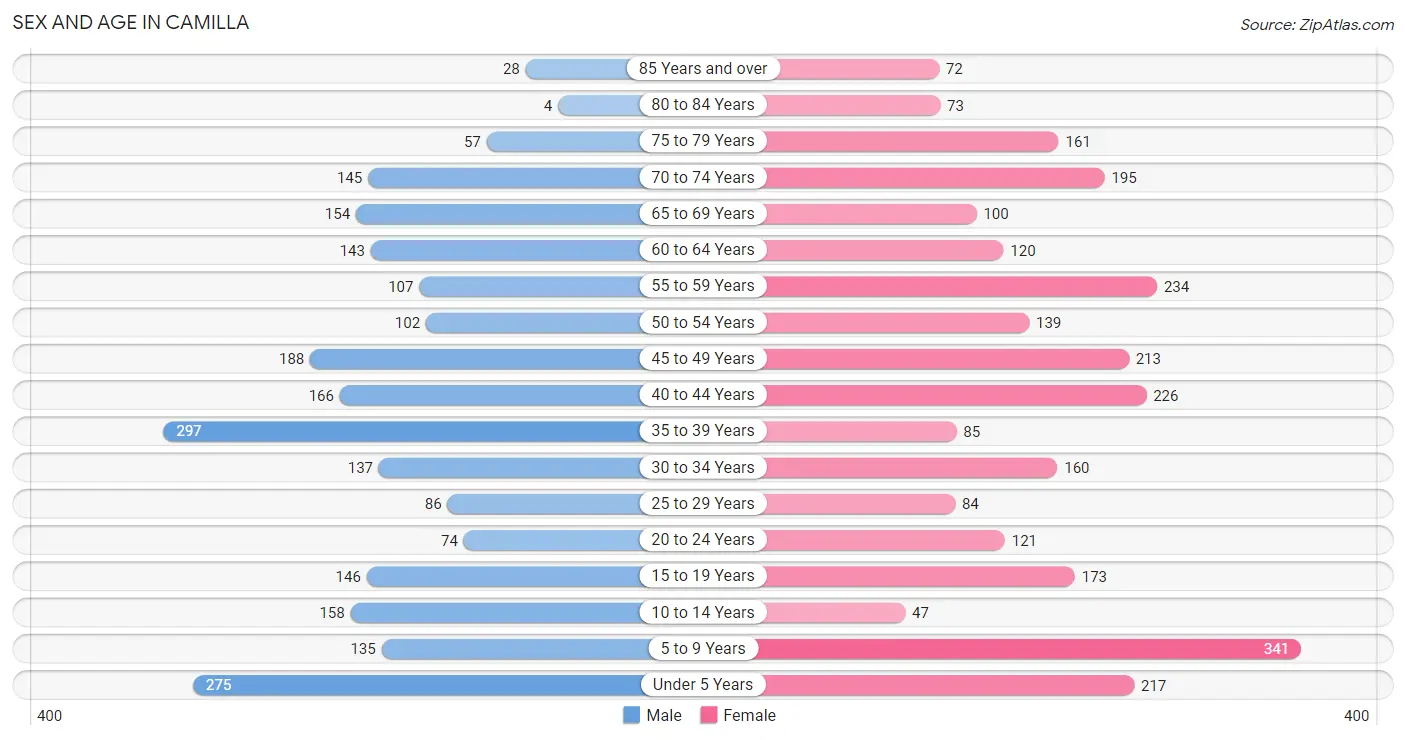
| Age Bracket | Male | Female |
| Under 5 Years | 275 (11.5%) | 217 (7.9%) |
| 5 to 9 Years | 135 (5.6%) | 341 (12.3%) |
| 10 to 14 Years | 158 (6.6%) | 47 (1.7%) |
| 15 to 19 Years | 146 (6.1%) | 173 (6.3%) |
| 20 to 24 Years | 74 (3.1%) | 121 (4.4%) |
| 25 to 29 Years | 86 (3.6%) | 84 (3.0%) |
| 30 to 34 Years | 137 (5.7%) | 160 (5.8%) |
| 35 to 39 Years | 297 (12.4%) | 85 (3.1%) |
| 40 to 44 Years | 166 (6.9%) | 226 (8.2%) |
| 45 to 49 Years | 188 (7.8%) | 213 (7.7%) |
| 50 to 54 Years | 102 (4.3%) | 139 (5.0%) |
| 55 to 59 Years | 107 (4.4%) | 234 (8.5%) |
| 60 to 64 Years | 143 (5.9%) | 120 (4.3%) |
| 65 to 69 Years | 154 (6.4%) | 100 (3.6%) |
| 70 to 74 Years | 145 (6.0%) | 195 (7.1%) |
| 75 to 79 Years | 57 (2.4%) | 161 (5.8%) |
| 80 to 84 Years | 4 (0.2%) | 73 (2.6%) |
| 85 Years and over | 28 (1.2%) | 72 (2.6%) |
| Total | 2,402 (100.0%) | 2,761 (100.0%) |
Families and Households in Camilla
Median Family Size in Camilla
The median family size in Camilla is 3.19 persons per family, with single female/mother families (700 | 57.5%) accounting for the largest median family size of 3.37 persons per family. On the other hand, single male/father families (43 | 3.5%) represent the smallest median family size with 2.79 persons per family.
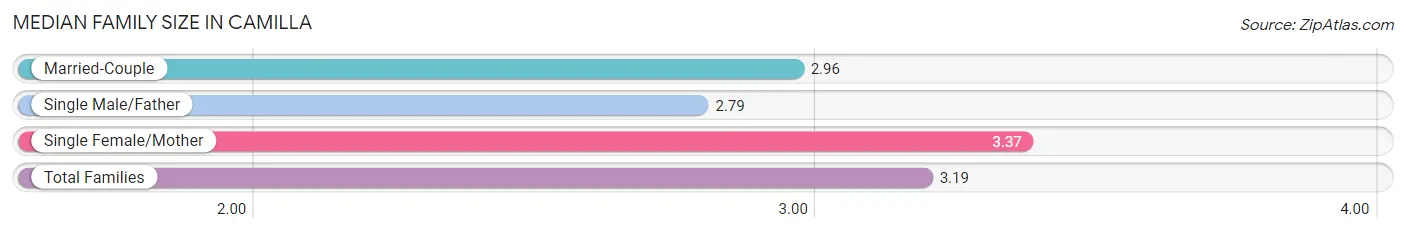
| Family Type | # Families | Family Size |
| Married-Couple | 475 (39.0%) | 2.96 |
| Single Male/Father | 43 (3.5%) | 2.79 |
| Single Female/Mother | 700 (57.5%) | 3.37 |
| Total Families | 1,218 (100.0%) | 3.19 |
Median Household Size in Camilla
The median household size in Camilla is 2.33 persons per household, with single female/mother households (700 | 31.9%) accounting for the largest median household size of 3.37 persons per household. non-family households (977 | 44.5%) represent the smallest median household size with 1.24 persons per household.
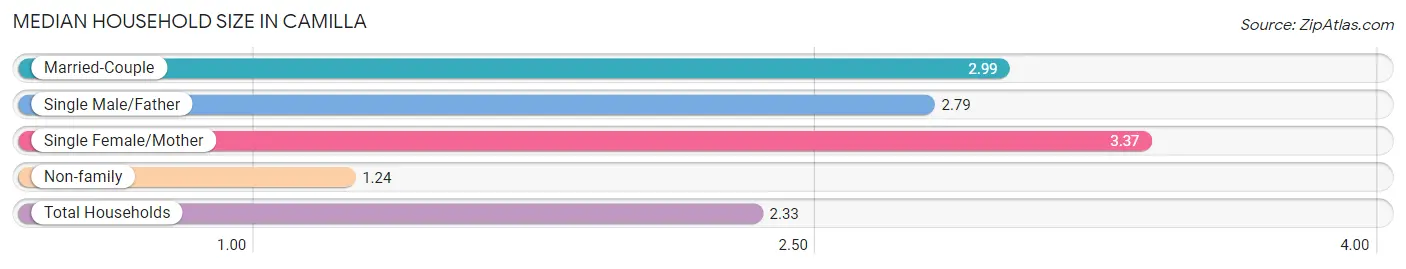
| Household Type | # Households | Household Size |
| Married-Couple | 475 (21.6%) | 2.99 |
| Single Male/Father | 43 (2.0%) | 2.79 |
| Single Female/Mother | 700 (31.9%) | 3.37 |
| Non-family | 977 (44.5%) | 1.24 |
| Total Households | 2,195 (100.0%) | 2.33 |
Household Size by Marriage Status in Camilla
Out of a total of 2,195 households in Camilla, 1,218 (55.5%) are family households, while 977 (44.5%) are nonfamily households. The most numerous type of family households are 2-person households, comprising 490, and the most common type of nonfamily households are 1-person households, comprising 641.
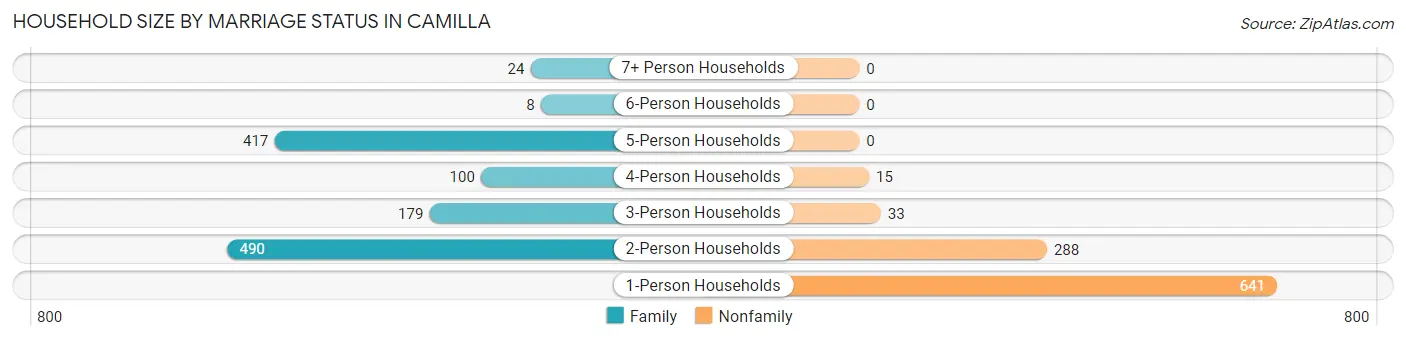
| Household Size | Family Households | Nonfamily Households |
| 1-Person Households | - | 641 (29.2%) |
| 2-Person Households | 490 (22.3%) | 288 (13.1%) |
| 3-Person Households | 179 (8.2%) | 33 (1.5%) |
| 4-Person Households | 100 (4.6%) | 15 (0.7%) |
| 5-Person Households | 417 (19.0%) | 0 (0.0%) |
| 6-Person Households | 8 (0.4%) | 0 (0.0%) |
| 7+ Person Households | 24 (1.1%) | 0 (0.0%) |
| Total | 1,218 (55.5%) | 977 (44.5%) |
Female Fertility in Camilla
Fertility by Age in Camilla
Average fertility rate in Camilla is 16.0 births per 1,000 women. Women in the age bracket of 20 to 34 years have the highest fertility rate with 49.0 births per 1,000 women. Women in the age bracket of 20 to 34 years acount for 100.0% of all women with births.
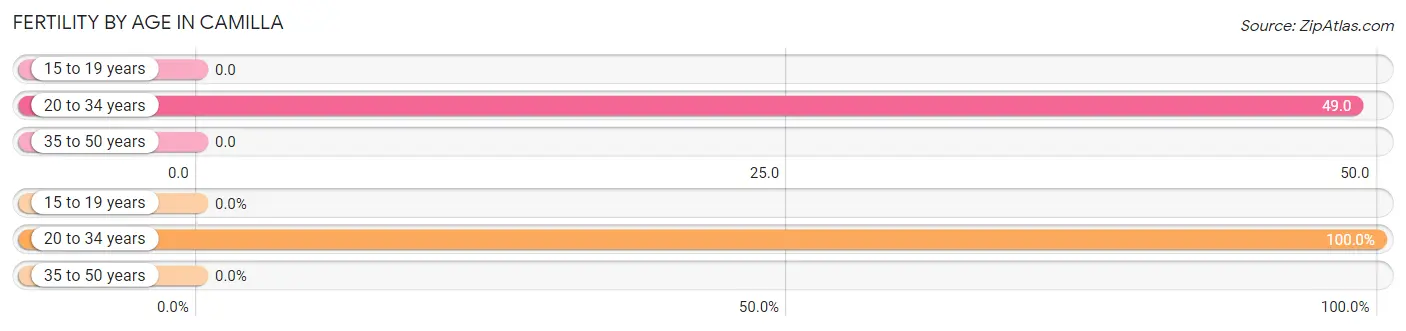
| Age Bracket | Women with Births | Births / 1,000 Women |
| 15 to 19 years | 0 (0.0%) | 0.0 |
| 20 to 34 years | 18 (100.0%) | 49.0 |
| 35 to 50 years | 0 (0.0%) | 0.0 |
| Total | 18 (100.0%) | 16.0 |
Fertility by Age by Marriage Status in Camilla
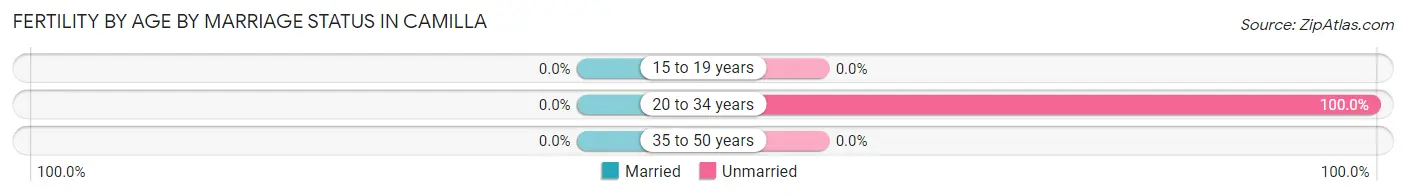
| Age Bracket | Married | Unmarried |
| 15 to 19 years | 0 (0.0%) | 0 (0.0%) |
| 20 to 34 years | 0 (0.0%) | 18 (100.0%) |
| 35 to 50 years | 0 (0.0%) | 0 (0.0%) |
| Total | 0 (0.0%) | 18 (100.0%) |
Fertility by Education in Camilla
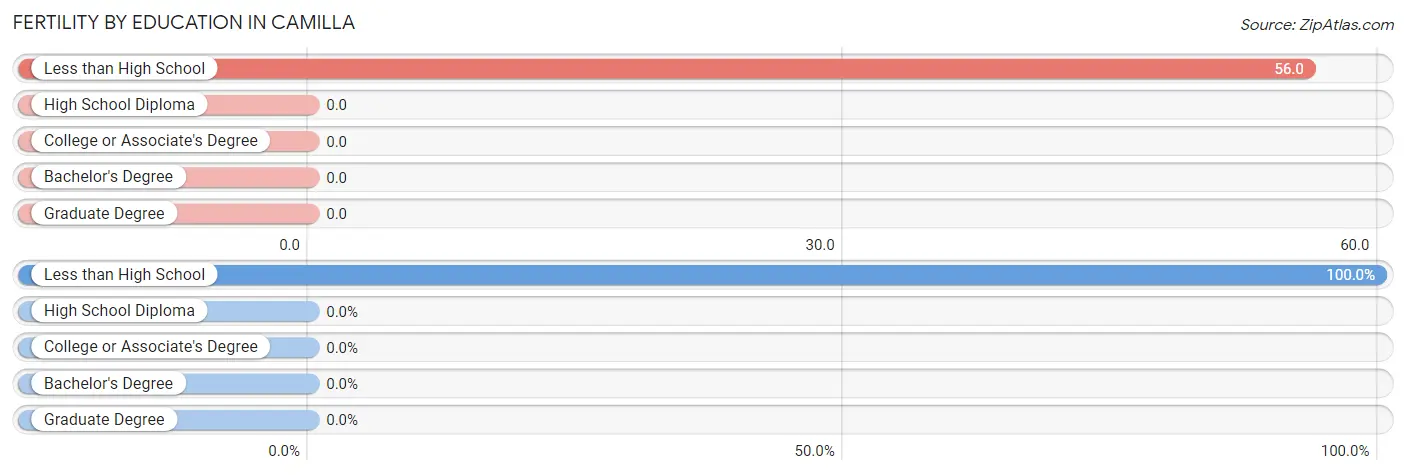
| Educational Attainment | Women with Births | Births / 1,000 Women |
| Less than High School | 18 (100.0%) | 56.0 |
| High School Diploma | 0 (0.0%) | 0.0 |
| College or Associate's Degree | 0 (0.0%) | 0.0 |
| Bachelor's Degree | 0 (0.0%) | 0.0 |
| Graduate Degree | 0 (0.0%) | 0.0 |
| Total | 18 (100.0%) | 16.0 |
Fertility by Education by Marriage Status in Camilla
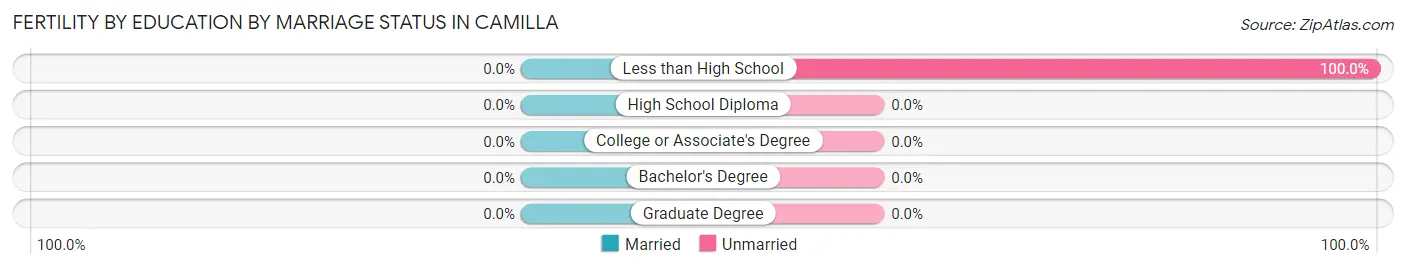
| Educational Attainment | Married | Unmarried |
| Less than High School | 0 (0.0%) | 18 (100.0%) |
| High School Diploma | 0 (0.0%) | 0 (0.0%) |
| College or Associate's Degree | 0 (0.0%) | 0 (0.0%) |
| Bachelor's Degree | 0 (0.0%) | 0 (0.0%) |
| Graduate Degree | 0 (0.0%) | 0 (0.0%) |
| Total | 0 (0.0%) | 18 (100.0%) |
Employment Characteristics in Camilla
Employment by Class of Employer in Camilla
Among the 1,636 employed individuals in Camilla, private company employees (1,157 | 70.7%), self-employed (not incorporated) (184 | 11.3%), and local government employees (134 | 8.2%) make up the most common classes of employment.
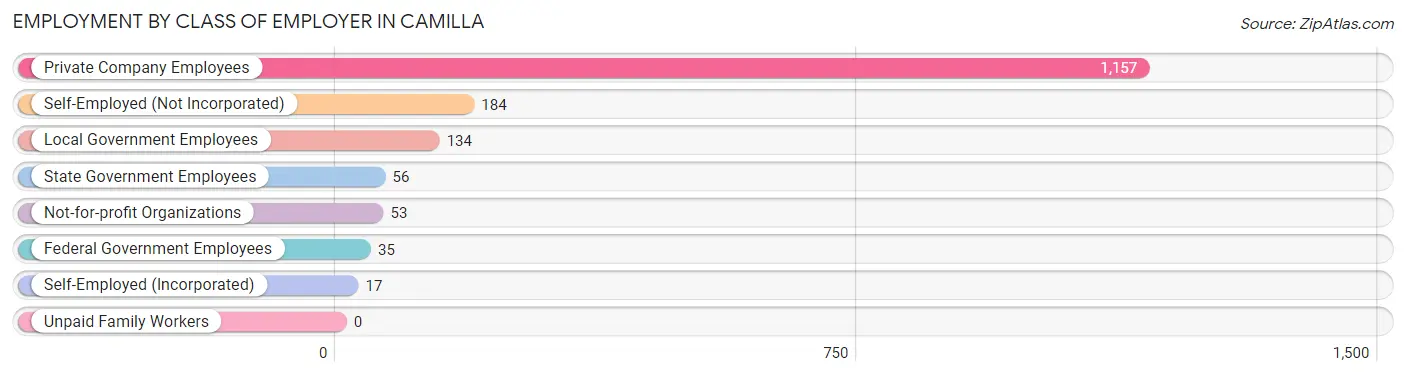
| Employer Class | # Employees | % Employees |
| Private Company Employees | 1,157 | 70.7% |
| Self-Employed (Incorporated) | 17 | 1.0% |
| Self-Employed (Not Incorporated) | 184 | 11.3% |
| Not-for-profit Organizations | 53 | 3.2% |
| Local Government Employees | 134 | 8.2% |
| State Government Employees | 56 | 3.4% |
| Federal Government Employees | 35 | 2.1% |
| Unpaid Family Workers | 0 | 0.0% |
| Total | 1,636 | 100.0% |
Employment Status by Age in Camilla
According to the labor force statistics for Camilla, out of the total population over 16 years of age (3,897), 48.3% or 1,882 individuals are in the labor force, with 11.3% or 213 of them unemployed. The age group with the highest labor force participation rate is 25 to 29 years, with 85.3% or 145 individuals in the labor force. Within the labor force, the 55 to 59 years age range has the highest percentage of unemployed individuals, with 38.9% or 74 of them being unemployed.
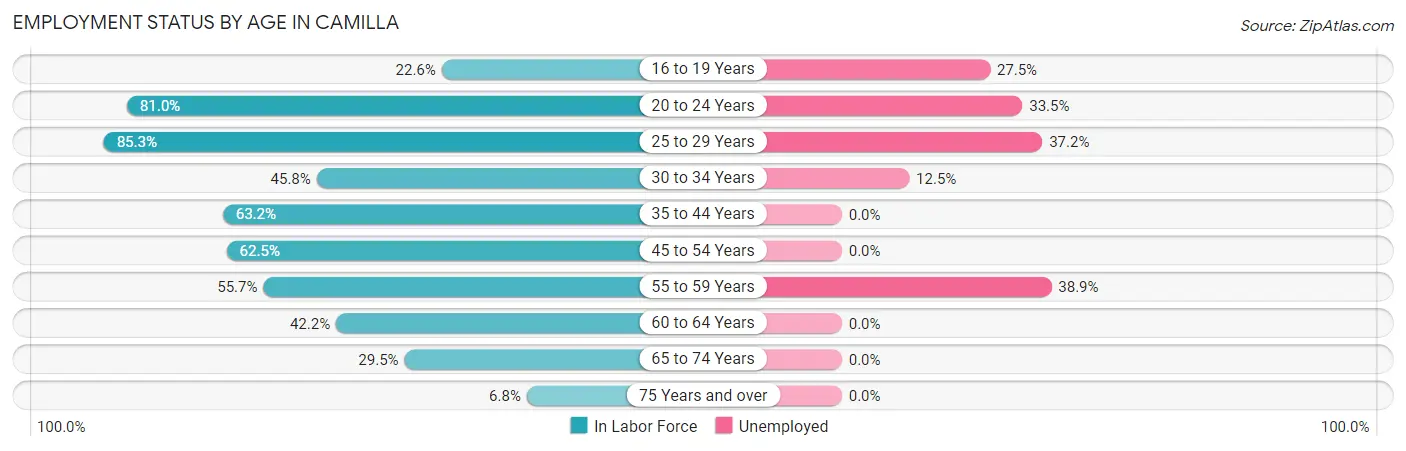
| Age Bracket | In Labor Force | Unemployed |
| 16 to 19 Years | 51 (22.6%) | 14 (27.5%) |
| 20 to 24 Years | 158 (81.0%) | 53 (33.5%) |
| 25 to 29 Years | 145 (85.3%) | 54 (37.2%) |
| 30 to 34 Years | 136 (45.8%) | 17 (12.5%) |
| 35 to 44 Years | 489 (63.2%) | 0 (0.0%) |
| 45 to 54 Years | 401 (62.5%) | 0 (0.0%) |
| 55 to 59 Years | 190 (55.7%) | 74 (38.9%) |
| 60 to 64 Years | 111 (42.2%) | 0 (0.0%) |
| 65 to 74 Years | 175 (29.5%) | 0 (0.0%) |
| 75 Years and over | 27 (6.8%) | 0 (0.0%) |
| Total | 1,882 (48.3%) | 213 (11.3%) |
Employment Status by Educational Attainment in Camilla
According to labor force statistics for Camilla, 59.2% of individuals (1,472) out of the total population between 25 and 64 years of age (2,487) are in the labor force, with 9.9% or 146 of them being unemployed. The group with the highest labor force participation rate are those with the educational attainment of bachelor's degree or higher, with 78.5% or 95 individuals in the labor force. Within the labor force, individuals with high school diploma education have the highest percentage of unemployment, with 21.0% or 92 of them being unemployed.
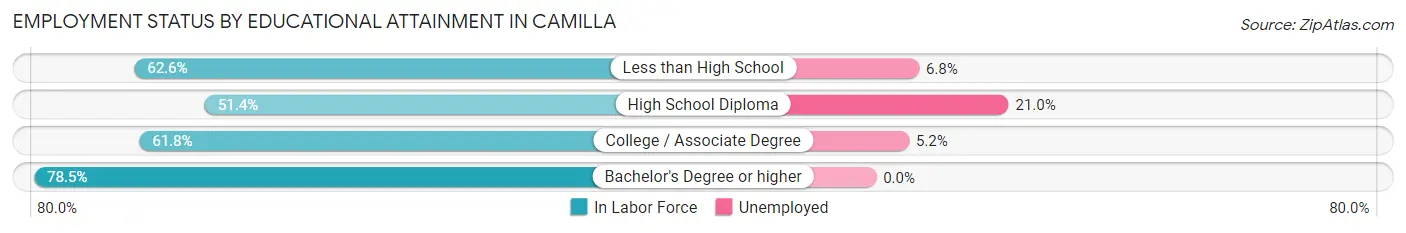
| Educational Attainment | In Labor Force | Unemployed |
| Less than High School | 251 (62.6%) | 27 (6.8%) |
| High School Diploma | 438 (51.4%) | 179 (21.0%) |
| College / Associate Degree | 688 (61.8%) | 58 (5.2%) |
| Bachelor's Degree or higher | 95 (78.5%) | 0 (0.0%) |
| Total | 1,472 (59.2%) | 246 (9.9%) |
Employment Occupations by Sex in Camilla
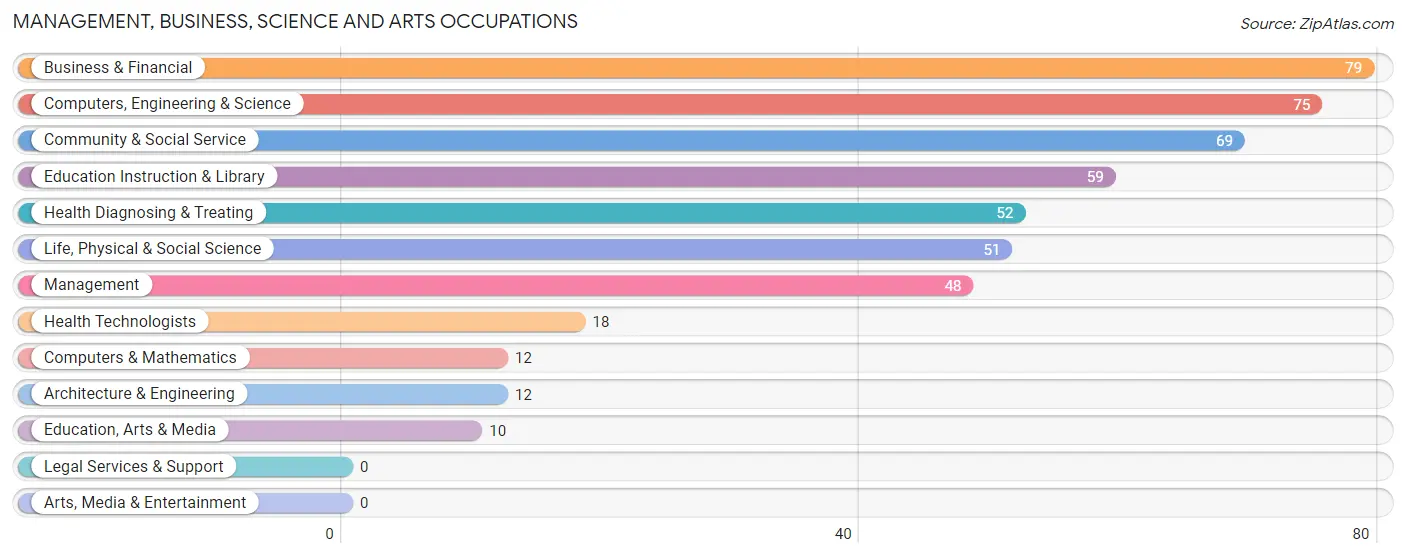
Management, Business, Science and Arts Occupations
The most common Management, Business, Science and Arts occupations in Camilla are Business & Financial (79 | 4.7%), Computers, Engineering & Science (75 | 4.5%), Community & Social Service (69 | 4.1%), Education Instruction & Library (59 | 3.5%), and Health Diagnosing & Treating (52 | 3.1%).
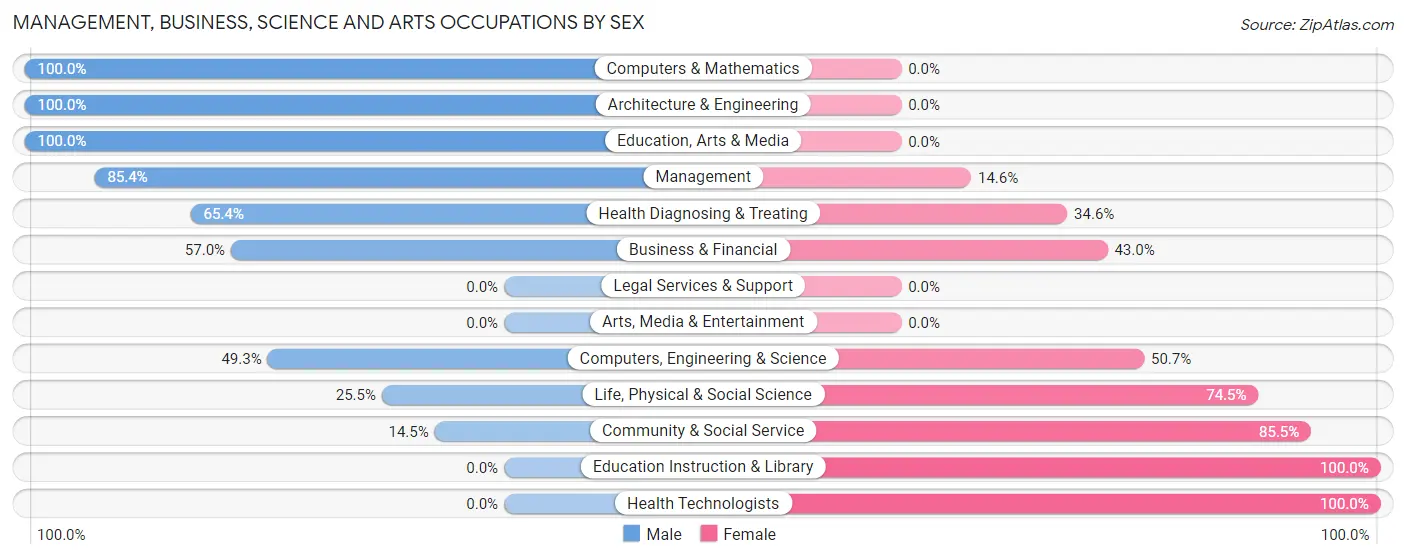
Management, Business, Science and Arts Occupations by Sex
Within the Management, Business, Science and Arts occupations in Camilla, the most male-oriented occupations are Computers & Mathematics (100.0%), Architecture & Engineering (100.0%), and Education, Arts & Media (100.0%), while the most female-oriented occupations are Education Instruction & Library (100.0%), Health Technologists (100.0%), and Community & Social Service (85.5%).
| Occupation | Male | Female |
| Management | 41 (85.4%) | 7 (14.6%) |
| Business & Financial | 45 (57.0%) | 34 (43.0%) |
| Computers, Engineering & Science | 37 (49.3%) | 38 (50.7%) |
| Computers & Mathematics | 12 (100.0%) | 0 (0.0%) |
| Architecture & Engineering | 12 (100.0%) | 0 (0.0%) |
| Life, Physical & Social Science | 13 (25.5%) | 38 (74.5%) |
| Community & Social Service | 10 (14.5%) | 59 (85.5%) |
| Education, Arts & Media | 10 (100.0%) | 0 (0.0%) |
| Legal Services & Support | 0 (0.0%) | 0 (0.0%) |
| Education Instruction & Library | 0 (0.0%) | 59 (100.0%) |
| Arts, Media & Entertainment | 0 (0.0%) | 0 (0.0%) |
| Health Diagnosing & Treating | 34 (65.4%) | 18 (34.6%) |
| Health Technologists | 0 (0.0%) | 18 (100.0%) |
| Total (Category) | 167 (51.7%) | 156 (48.3%) |
| Total (Overall) | 1,040 (62.2%) | 631 (37.8%) |
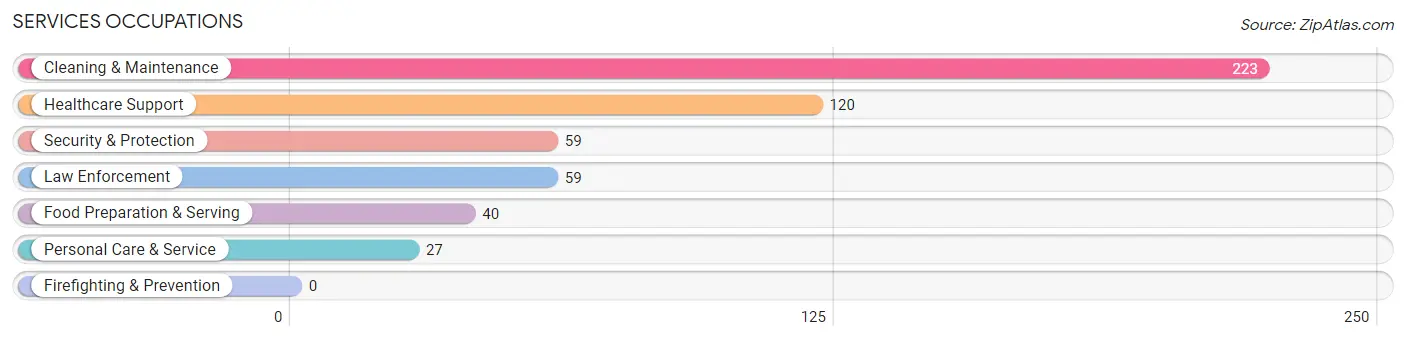
Services Occupations
The most common Services occupations in Camilla are Cleaning & Maintenance (223 | 13.4%), Healthcare Support (120 | 7.2%), Security & Protection (59 | 3.5%), Law Enforcement (59 | 3.5%), and Food Preparation & Serving (40 | 2.4%).
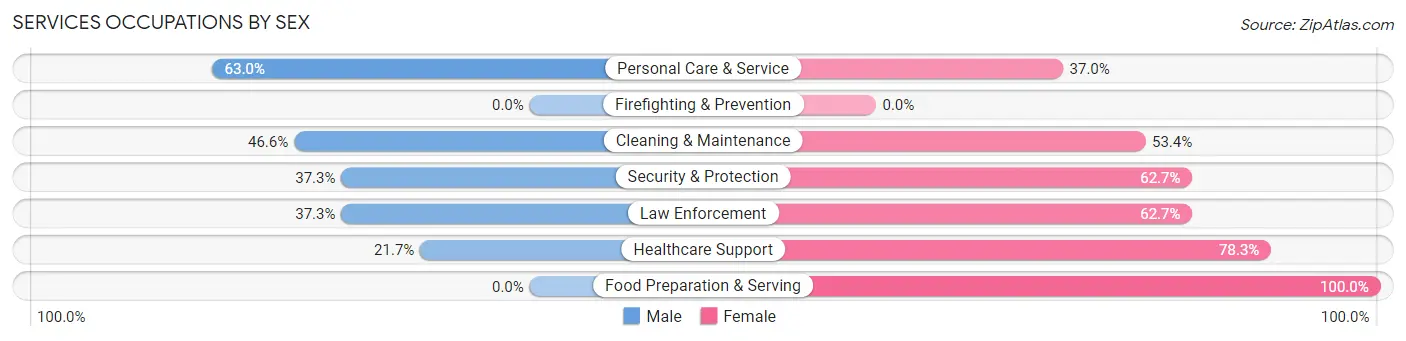
Services Occupations by Sex
Within the Services occupations in Camilla, the most male-oriented occupations are Personal Care & Service (63.0%), Cleaning & Maintenance (46.6%), and Security & Protection (37.3%), while the most female-oriented occupations are Food Preparation & Serving (100.0%), Healthcare Support (78.3%), and Security & Protection (62.7%).
| Occupation | Male | Female |
| Healthcare Support | 26 (21.7%) | 94 (78.3%) |
| Security & Protection | 22 (37.3%) | 37 (62.7%) |
| Firefighting & Prevention | 0 (0.0%) | 0 (0.0%) |
| Law Enforcement | 22 (37.3%) | 37 (62.7%) |
| Food Preparation & Serving | 0 (0.0%) | 40 (100.0%) |
| Cleaning & Maintenance | 104 (46.6%) | 119 (53.4%) |
| Personal Care & Service | 17 (63.0%) | 10 (37.0%) |
| Total (Category) | 169 (36.0%) | 300 (64.0%) |
| Total (Overall) | 1,040 (62.2%) | 631 (37.8%) |
Sales and Office Occupations
The most common Sales and Office occupations in Camilla are Sales & Related (350 | 20.9%), and Office & Administration (130 | 7.8%).

Sales and Office Occupations by Sex
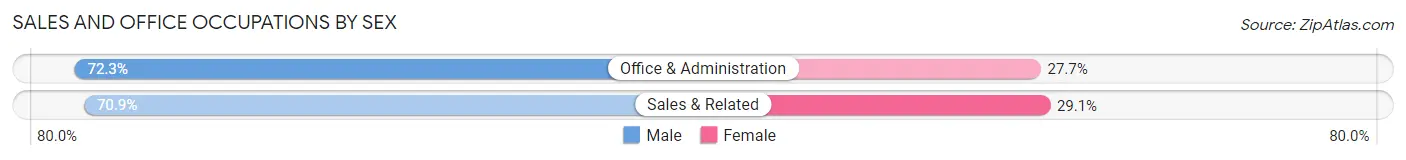
| Occupation | Male | Female |
| Sales & Related | 248 (70.9%) | 102 (29.1%) |
| Office & Administration | 94 (72.3%) | 36 (27.7%) |
| Total (Category) | 342 (71.3%) | 138 (28.7%) |
| Total (Overall) | 1,040 (62.2%) | 631 (37.8%) |
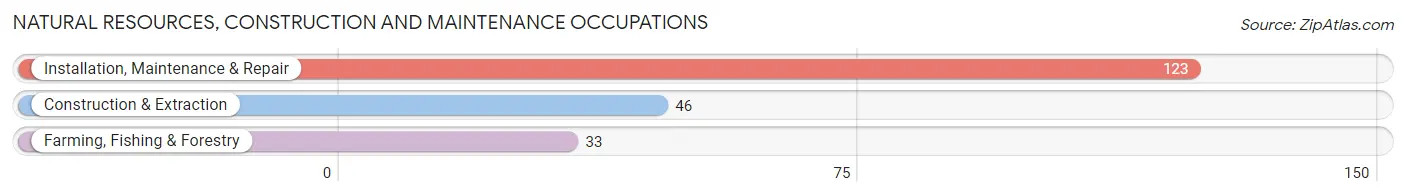
Natural Resources, Construction and Maintenance Occupations
The most common Natural Resources, Construction and Maintenance occupations in Camilla are Installation, Maintenance & Repair (123 | 7.4%), Construction & Extraction (46 | 2.8%), and Farming, Fishing & Forestry (33 | 2.0%).
Natural Resources, Construction and Maintenance Occupations by Sex
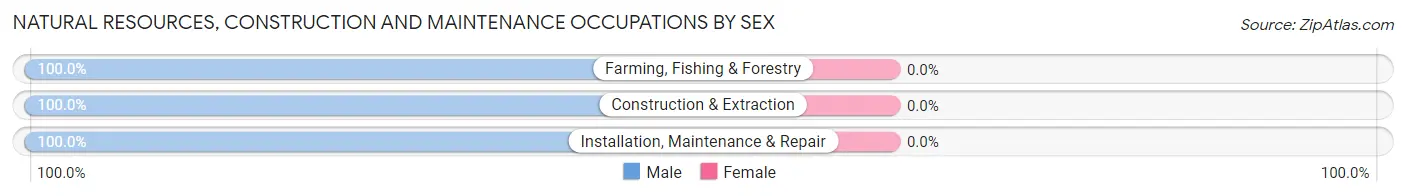
| Occupation | Male | Female |
| Farming, Fishing & Forestry | 33 (100.0%) | 0 (0.0%) |
| Construction & Extraction | 46 (100.0%) | 0 (0.0%) |
| Installation, Maintenance & Repair | 123 (100.0%) | 0 (0.0%) |
| Total (Category) | 202 (100.0%) | 0 (0.0%) |
| Total (Overall) | 1,040 (62.2%) | 631 (37.8%) |
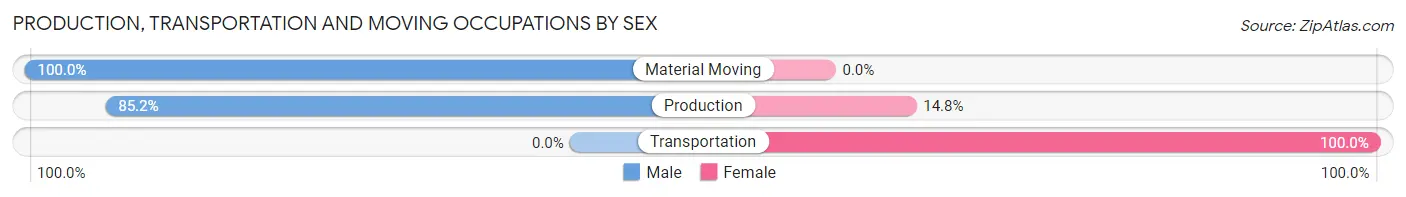
Production, Transportation and Moving Occupations
The most common Production, Transportation and Moving occupations in Camilla are Material Moving (114 | 6.8%), Production (54 | 3.2%), and Transportation (29 | 1.7%).
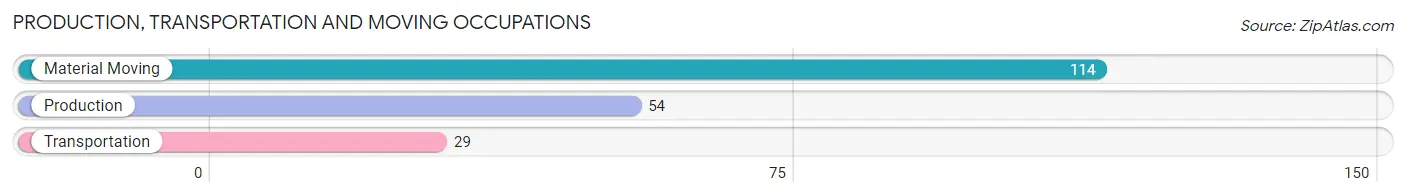
Production, Transportation and Moving Occupations by Sex
| Occupation | Male | Female |
| Production | 46 (85.2%) | 8 (14.8%) |
| Transportation | 0 (0.0%) | 29 (100.0%) |
| Material Moving | 114 (100.0%) | 0 (0.0%) |
| Total (Category) | 160 (81.2%) | 37 (18.8%) |
| Total (Overall) | 1,040 (62.2%) | 631 (37.8%) |
Employment Industries by Sex in Camilla
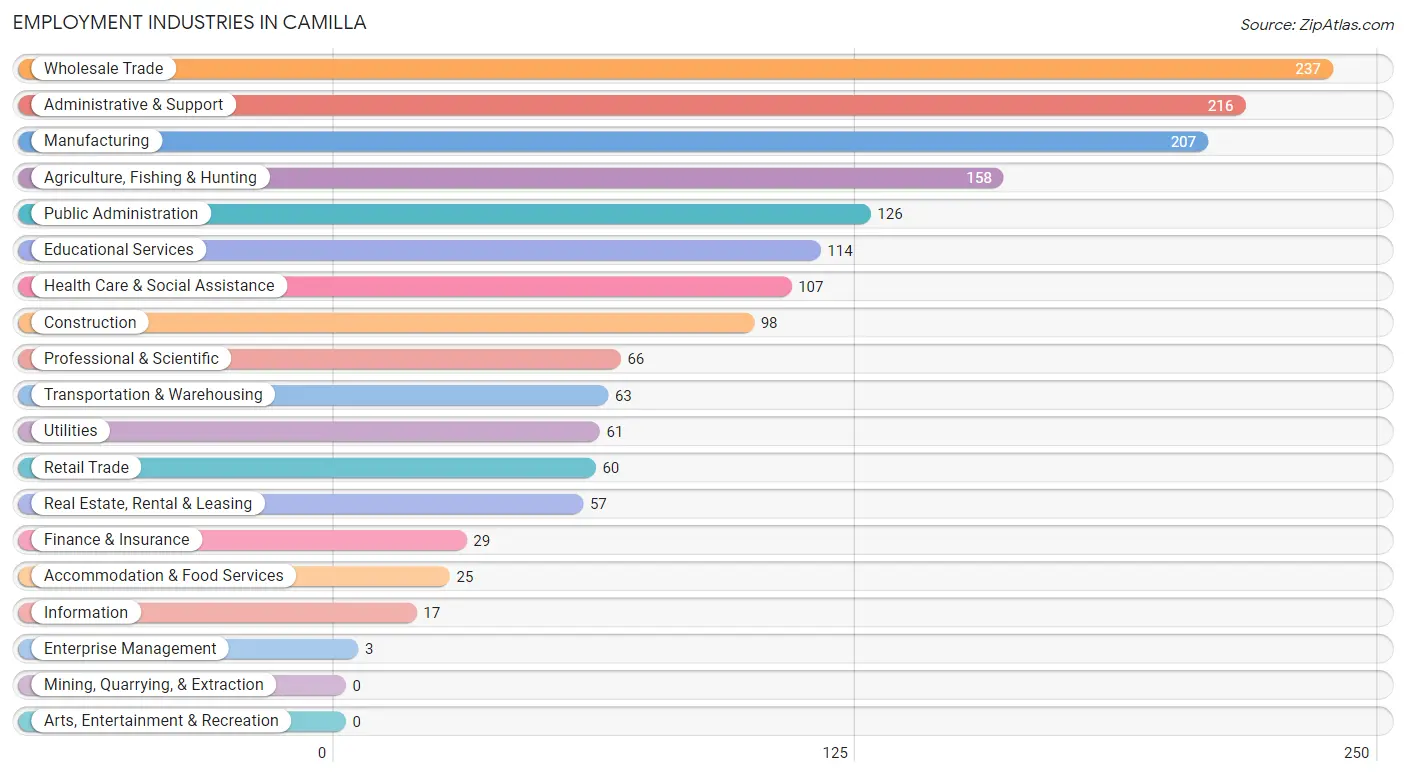
Employment Industries in Camilla
The major employment industries in Camilla include Wholesale Trade (237 | 14.2%), Administrative & Support (216 | 12.9%), Manufacturing (207 | 12.4%), Agriculture, Fishing & Hunting (158 | 9.5%), and Public Administration (126 | 7.5%).
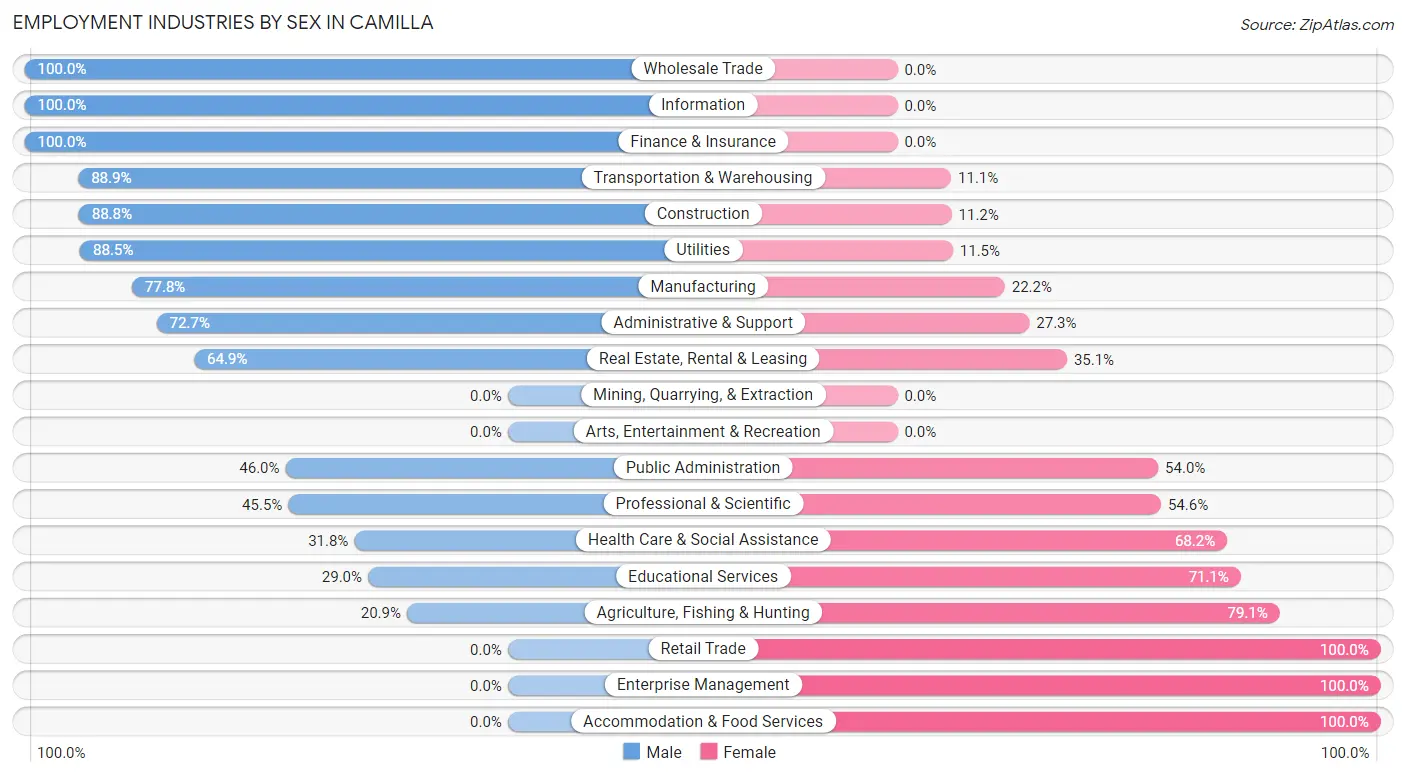
Employment Industries by Sex in Camilla
The Camilla industries that see more men than women are Wholesale Trade (100.0%), Information (100.0%), and Finance & Insurance (100.0%), whereas the industries that tend to have a higher number of women are Retail Trade (100.0%), Enterprise Management (100.0%), and Accommodation & Food Services (100.0%).
| Industry | Male | Female |
| Agriculture, Fishing & Hunting | 33 (20.9%) | 125 (79.1%) |
| Mining, Quarrying, & Extraction | 0 (0.0%) | 0 (0.0%) |
| Construction | 87 (88.8%) | 11 (11.2%) |
| Manufacturing | 161 (77.8%) | 46 (22.2%) |
| Wholesale Trade | 237 (100.0%) | 0 (0.0%) |
| Retail Trade | 0 (0.0%) | 60 (100.0%) |
| Transportation & Warehousing | 56 (88.9%) | 7 (11.1%) |
| Utilities | 54 (88.5%) | 7 (11.5%) |
| Information | 17 (100.0%) | 0 (0.0%) |
| Finance & Insurance | 29 (100.0%) | 0 (0.0%) |
| Real Estate, Rental & Leasing | 37 (64.9%) | 20 (35.1%) |
| Professional & Scientific | 30 (45.5%) | 36 (54.5%) |
| Enterprise Management | 0 (0.0%) | 3 (100.0%) |
| Administrative & Support | 157 (72.7%) | 59 (27.3%) |
| Educational Services | 33 (28.9%) | 81 (71.1%) |
| Health Care & Social Assistance | 34 (31.8%) | 73 (68.2%) |
| Arts, Entertainment & Recreation | 0 (0.0%) | 0 (0.0%) |
| Accommodation & Food Services | 0 (0.0%) | 25 (100.0%) |
| Public Administration | 58 (46.0%) | 68 (54.0%) |
| Total | 1,040 (62.2%) | 631 (37.8%) |
Education in Camilla
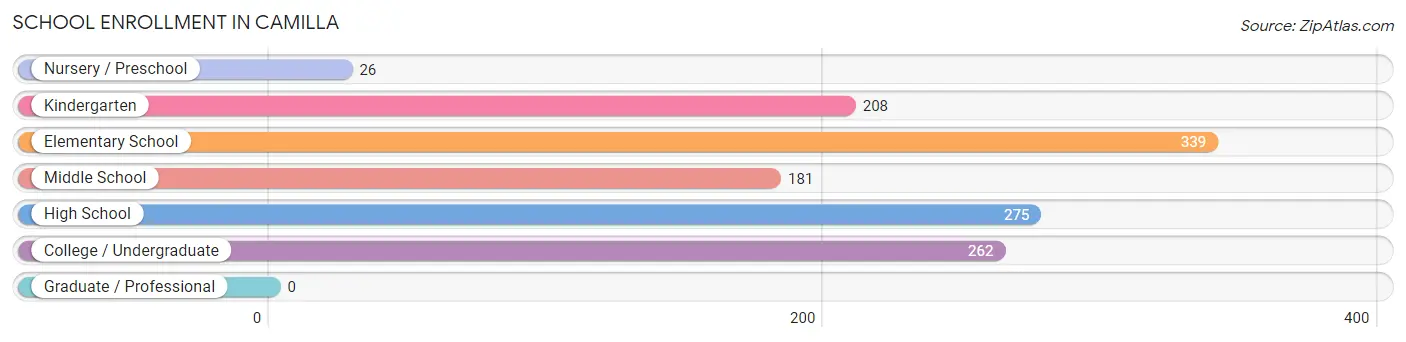
School Enrollment in Camilla
The most common levels of schooling among the 1,291 students in Camilla are elementary school (339 | 26.3%), high school (275 | 21.3%), and college / undergraduate (262 | 20.3%).
| School Level | # Students | % Students |
| Nursery / Preschool | 26 | 2.0% |
| Kindergarten | 208 | 16.1% |
| Elementary School | 339 | 26.3% |
| Middle School | 181 | 14.0% |
| High School | 275 | 21.3% |
| College / Undergraduate | 262 | 20.3% |
| Graduate / Professional | 0 | 0.0% |
| Total | 1,291 | 100.0% |
School Enrollment by Age by Funding Source in Camilla
Out of a total of 1,291 students who are enrolled in schools in Camilla, 127 (9.8%) attend a private institution, while the remaining 1,164 (90.2%) are enrolled in public schools. The age group of 35 years and over has the highest likelihood of being enrolled in private schools, with 92 (86.8% in the age bracket) enrolled. Conversely, the age group of 3 to 4 year olds has the lowest likelihood of being enrolled in a private school, with 95 (100.0% in the age bracket) attending a public institution.
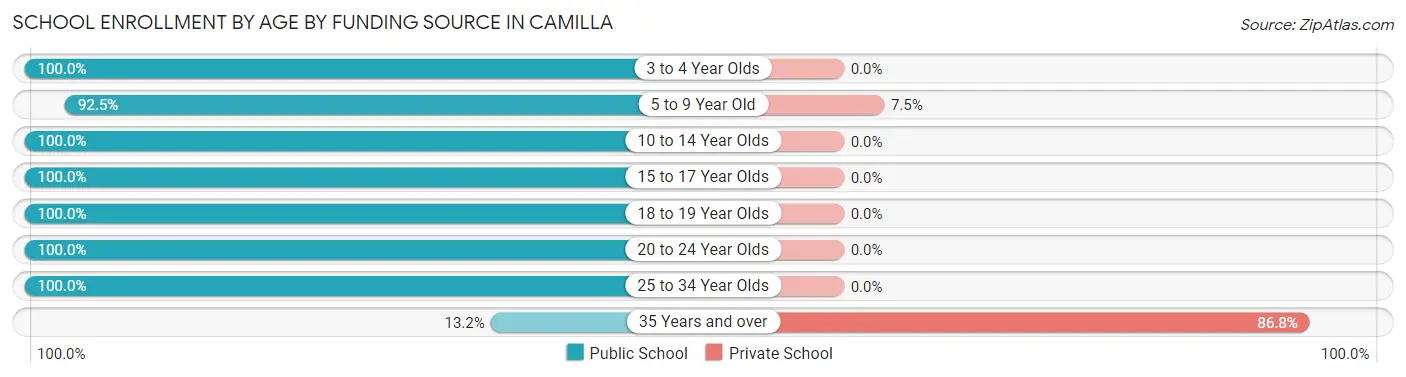
| Age Bracket | Public School | Private School |
| 3 to 4 Year Olds | 95 (100.0%) | 0 (0.0%) |
| 5 to 9 Year Old | 431 (92.5%) | 35 (7.5%) |
| 10 to 14 Year Olds | 200 (100.0%) | 0 (0.0%) |
| 15 to 17 Year Olds | 247 (100.0%) | 0 (0.0%) |
| 18 to 19 Year Olds | 43 (100.0%) | 0 (0.0%) |
| 20 to 24 Year Olds | 58 (100.0%) | 0 (0.0%) |
| 25 to 34 Year Olds | 76 (100.0%) | 0 (0.0%) |
| 35 Years and over | 14 (13.2%) | 92 (86.8%) |
| Total | 1,164 (90.2%) | 127 (9.8%) |
Educational Attainment by Field of Study in Camilla
Education (109 | 33.8%), business (103 | 31.9%), arts & humanities (25 | 7.7%), social sciences (20 | 6.2%), and literature & languages (19 | 5.9%) are the most common fields of study among 323 individuals in Camilla who have obtained a bachelor's degree or higher.
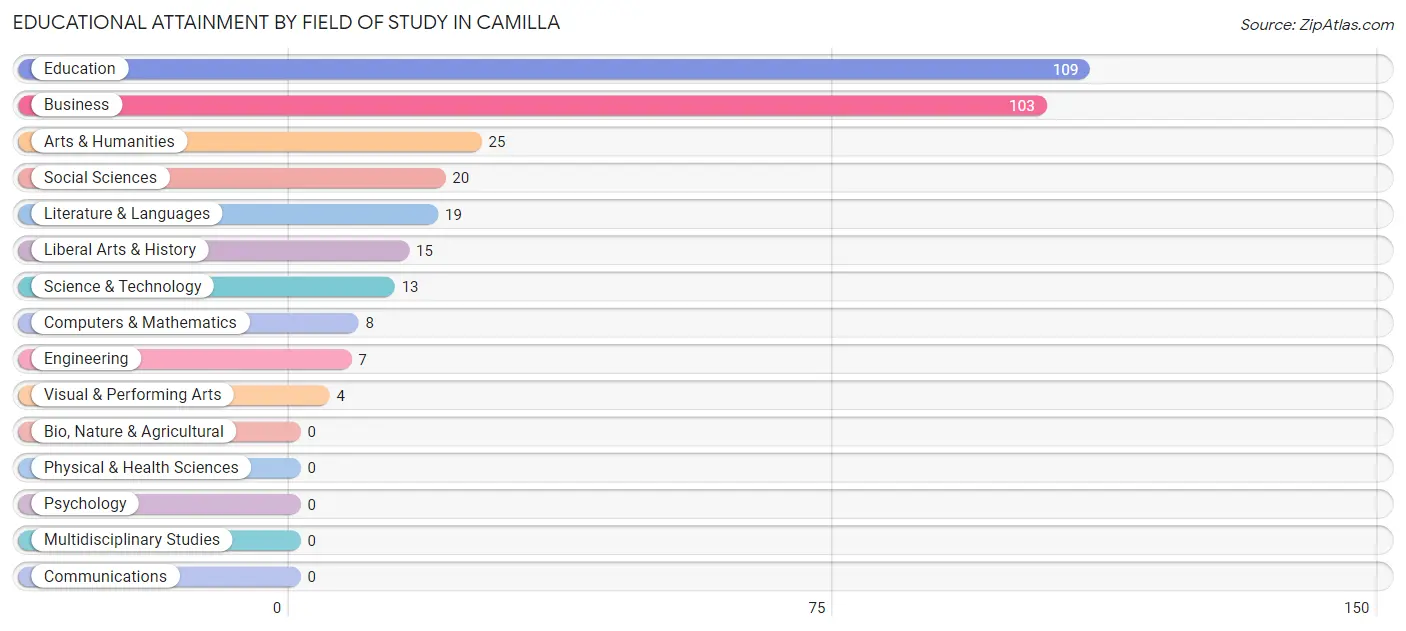
| Field of Study | # Graduates | % Graduates |
| Computers & Mathematics | 8 | 2.5% |
| Bio, Nature & Agricultural | 0 | 0.0% |
| Physical & Health Sciences | 0 | 0.0% |
| Psychology | 0 | 0.0% |
| Social Sciences | 20 | 6.2% |
| Engineering | 7 | 2.2% |
| Multidisciplinary Studies | 0 | 0.0% |
| Science & Technology | 13 | 4.0% |
| Business | 103 | 31.9% |
| Education | 109 | 33.8% |
| Literature & Languages | 19 | 5.9% |
| Liberal Arts & History | 15 | 4.6% |
| Visual & Performing Arts | 4 | 1.2% |
| Communications | 0 | 0.0% |
| Arts & Humanities | 25 | 7.7% |
| Total | 323 | 100.0% |
Transportation & Commute in Camilla
Vehicle Availability by Sex in Camilla
The most prevalent vehicle ownership categories in Camilla are males with no vehicle (332, accounting for 31.9%) and females with no vehicle (98, making up 55.7%).
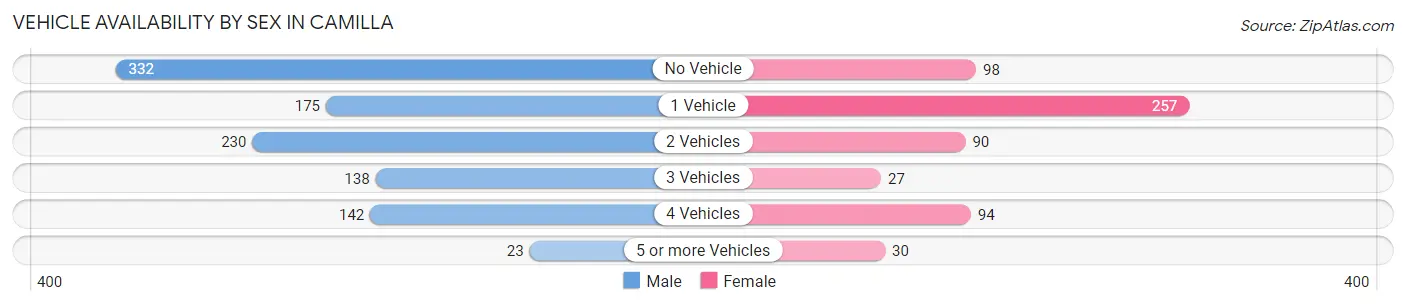
| Vehicles Available | Male | Female |
| No Vehicle | 332 (31.9%) | 98 (16.4%) |
| 1 Vehicle | 175 (16.8%) | 257 (43.1%) |
| 2 Vehicles | 230 (22.1%) | 90 (15.1%) |
| 3 Vehicles | 138 (13.3%) | 27 (4.5%) |
| 4 Vehicles | 142 (13.7%) | 94 (15.8%) |
| 5 or more Vehicles | 23 (2.2%) | 30 (5.0%) |
| Total | 1,040 (100.0%) | 596 (100.0%) |
Commute Time in Camilla
The most frequently occuring commute durations in Camilla are 5 to 9 minutes (361 commuters, 22.4%), 45 to 59 minutes (280 commuters, 17.4%), and 10 to 14 minutes (263 commuters, 16.3%).
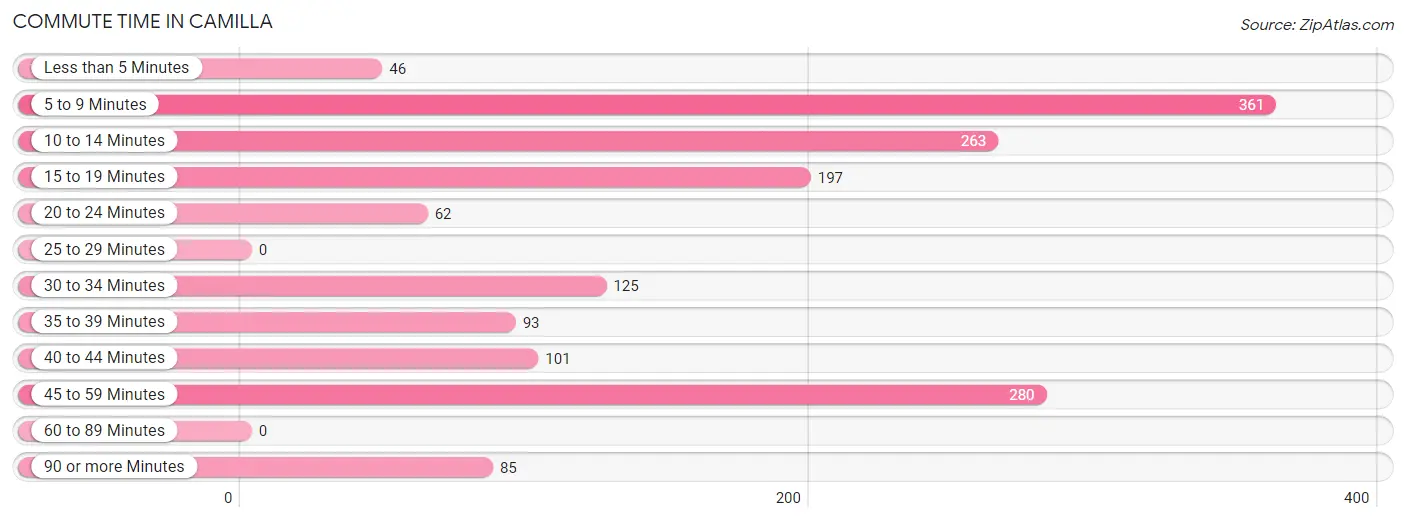
| Commute Time | # Commuters | % Commuters |
| Less than 5 Minutes | 46 | 2.9% |
| 5 to 9 Minutes | 361 | 22.4% |
| 10 to 14 Minutes | 263 | 16.3% |
| 15 to 19 Minutes | 197 | 12.2% |
| 20 to 24 Minutes | 62 | 3.8% |
| 25 to 29 Minutes | 0 | 0.0% |
| 30 to 34 Minutes | 125 | 7.7% |
| 35 to 39 Minutes | 93 | 5.8% |
| 40 to 44 Minutes | 101 | 6.3% |
| 45 to 59 Minutes | 280 | 17.4% |
| 60 to 89 Minutes | 0 | 0.0% |
| 90 or more Minutes | 85 | 5.3% |
Commute Time by Sex in Camilla
The most common commute times in Camilla are 45 to 59 minutes (268 commuters, 26.0%) for males and 15 to 19 minutes (197 commuters, 33.9%) for females.
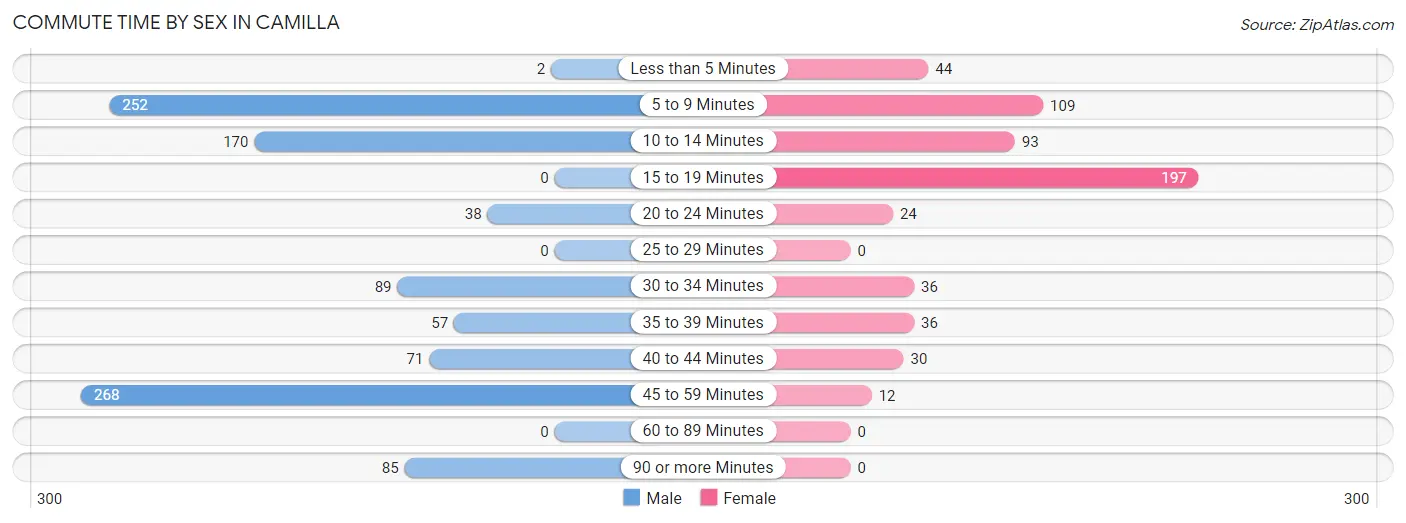
| Commute Time | Male | Female |
| Less than 5 Minutes | 2 (0.2%) | 44 (7.6%) |
| 5 to 9 Minutes | 252 (24.4%) | 109 (18.8%) |
| 10 to 14 Minutes | 170 (16.5%) | 93 (16.0%) |
| 15 to 19 Minutes | 0 (0.0%) | 197 (33.9%) |
| 20 to 24 Minutes | 38 (3.7%) | 24 (4.1%) |
| 25 to 29 Minutes | 0 (0.0%) | 0 (0.0%) |
| 30 to 34 Minutes | 89 (8.6%) | 36 (6.2%) |
| 35 to 39 Minutes | 57 (5.5%) | 36 (6.2%) |
| 40 to 44 Minutes | 71 (6.9%) | 30 (5.2%) |
| 45 to 59 Minutes | 268 (26.0%) | 12 (2.1%) |
| 60 to 89 Minutes | 0 (0.0%) | 0 (0.0%) |
| 90 or more Minutes | 85 (8.2%) | 0 (0.0%) |
Time of Departure to Work by Sex in Camilla
The most frequent times of departure to work in Camilla are 5:00 AM to 5:29 AM (235, 22.8%) for males and 7:30 AM to 7:59 AM (146, 25.1%) for females.
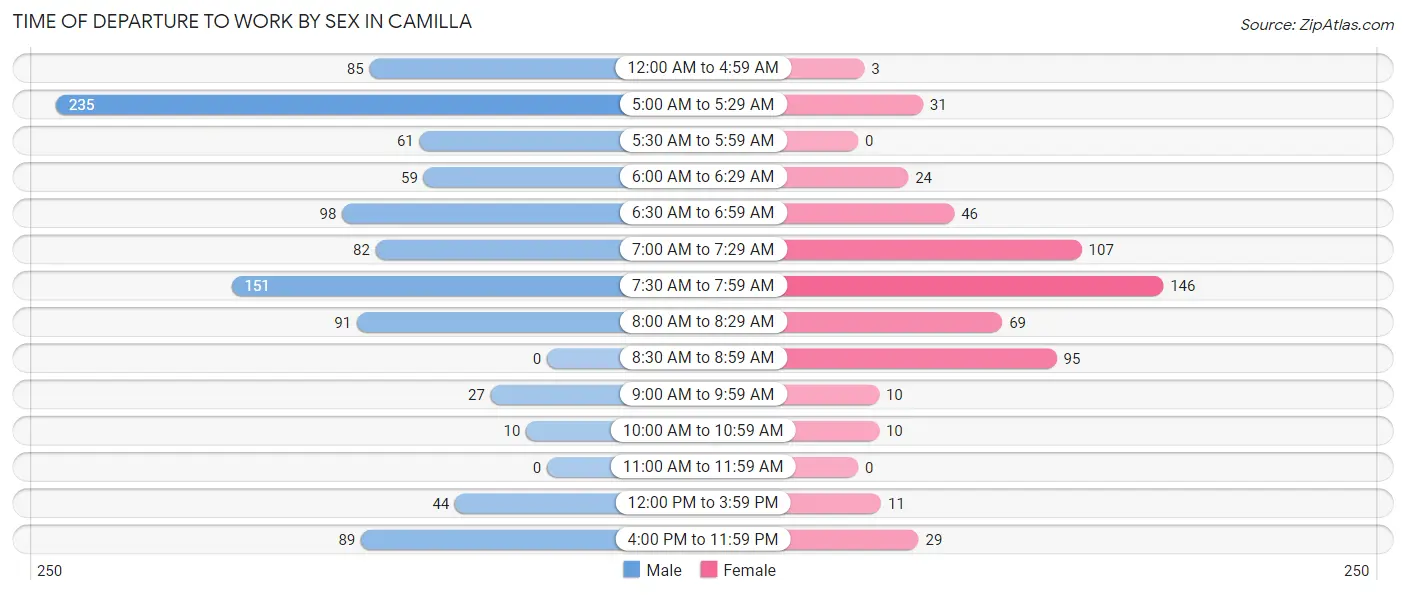
| Time of Departure | Male | Female |
| 12:00 AM to 4:59 AM | 85 (8.2%) | 3 (0.5%) |
| 5:00 AM to 5:29 AM | 235 (22.8%) | 31 (5.3%) |
| 5:30 AM to 5:59 AM | 61 (5.9%) | 0 (0.0%) |
| 6:00 AM to 6:29 AM | 59 (5.7%) | 24 (4.1%) |
| 6:30 AM to 6:59 AM | 98 (9.5%) | 46 (7.9%) |
| 7:00 AM to 7:29 AM | 82 (8.0%) | 107 (18.4%) |
| 7:30 AM to 7:59 AM | 151 (14.6%) | 146 (25.1%) |
| 8:00 AM to 8:29 AM | 91 (8.8%) | 69 (11.9%) |
| 8:30 AM to 8:59 AM | 0 (0.0%) | 95 (16.4%) |
| 9:00 AM to 9:59 AM | 27 (2.6%) | 10 (1.7%) |
| 10:00 AM to 10:59 AM | 10 (1.0%) | 10 (1.7%) |
| 11:00 AM to 11:59 AM | 0 (0.0%) | 0 (0.0%) |
| 12:00 PM to 3:59 PM | 44 (4.3%) | 11 (1.9%) |
| 4:00 PM to 11:59 PM | 89 (8.6%) | 29 (5.0%) |
| Total | 1,032 (100.0%) | 581 (100.0%) |
Housing Occupancy in Camilla
Occupancy by Ownership in Camilla
Of the total 2,195 dwellings in Camilla, owner-occupied units account for 1,029 (46.9%), while renter-occupied units make up 1,166 (53.1%).
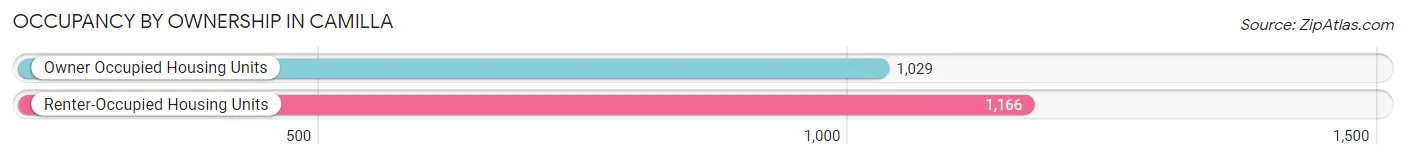
| Occupancy | # Housing Units | % Housing Units |
| Owner Occupied Housing Units | 1,029 | 46.9% |
| Renter-Occupied Housing Units | 1,166 | 53.1% |
| Total Occupied Housing Units | 2,195 | 100.0% |
Occupancy by Household Size in Camilla
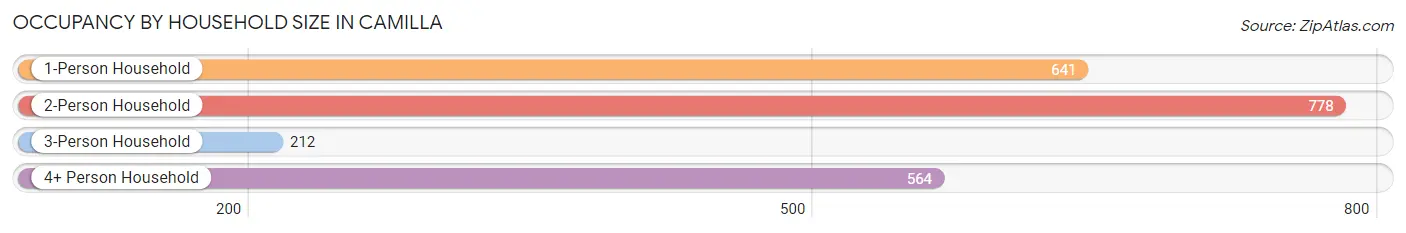
| Household Size | # Housing Units | % Housing Units |
| 1-Person Household | 641 | 29.2% |
| 2-Person Household | 778 | 35.4% |
| 3-Person Household | 212 | 9.7% |
| 4+ Person Household | 564 | 25.7% |
| Total Housing Units | 2,195 | 100.0% |
Occupancy by Ownership by Household Size in Camilla
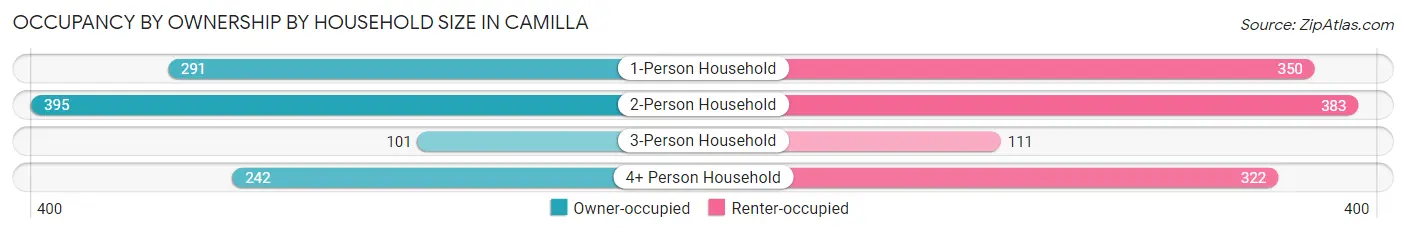
| Household Size | Owner-occupied | Renter-occupied |
| 1-Person Household | 291 (45.4%) | 350 (54.6%) |
| 2-Person Household | 395 (50.8%) | 383 (49.2%) |
| 3-Person Household | 101 (47.6%) | 111 (52.4%) |
| 4+ Person Household | 242 (42.9%) | 322 (57.1%) |
| Total Housing Units | 1,029 (46.9%) | 1,166 (53.1%) |
Occupancy by Educational Attainment in Camilla
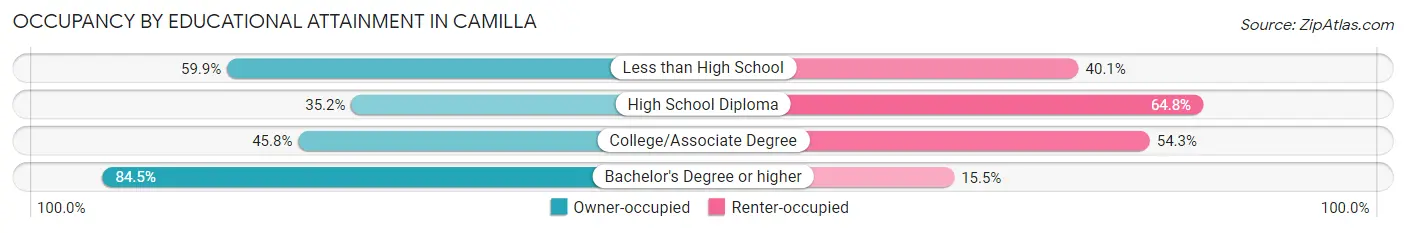
| Household Size | Owner-occupied | Renter-occupied |
| Less than High School | 170 (59.9%) | 114 (40.1%) |
| High School Diploma | 286 (35.2%) | 526 (64.8%) |
| College/Associate Degree | 420 (45.8%) | 498 (54.2%) |
| Bachelor's Degree or higher | 153 (84.5%) | 28 (15.5%) |
Occupancy by Age of Householder in Camilla
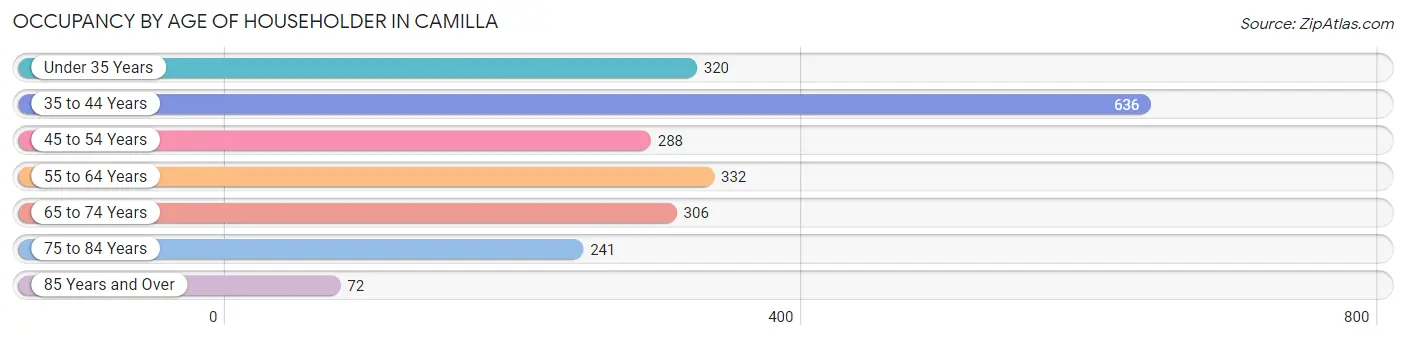
| Age Bracket | # Households | % Households |
| Under 35 Years | 320 | 14.6% |
| 35 to 44 Years | 636 | 29.0% |
| 45 to 54 Years | 288 | 13.1% |
| 55 to 64 Years | 332 | 15.1% |
| 65 to 74 Years | 306 | 13.9% |
| 75 to 84 Years | 241 | 11.0% |
| 85 Years and Over | 72 | 3.3% |
| Total | 2,195 | 100.0% |
Housing Finances in Camilla
Median Income by Occupancy in Camilla
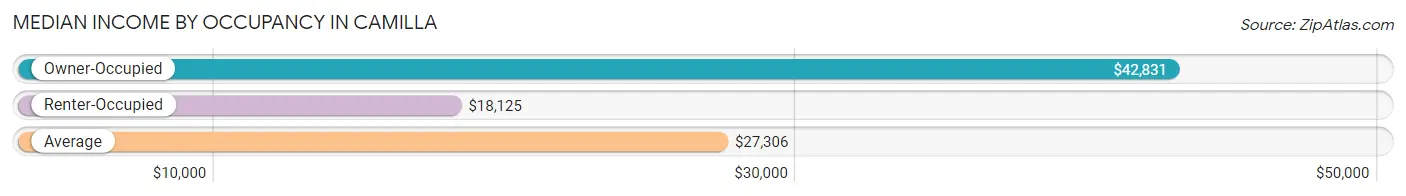
| Occupancy Type | # Households | Median Income |
| Owner-Occupied | 1,029 (46.9%) | $42,831 |
| Renter-Occupied | 1,166 (53.1%) | $18,125 |
| Average | 2,195 (100.0%) | $27,306 |
Occupancy by Householder Income Bracket in Camilla
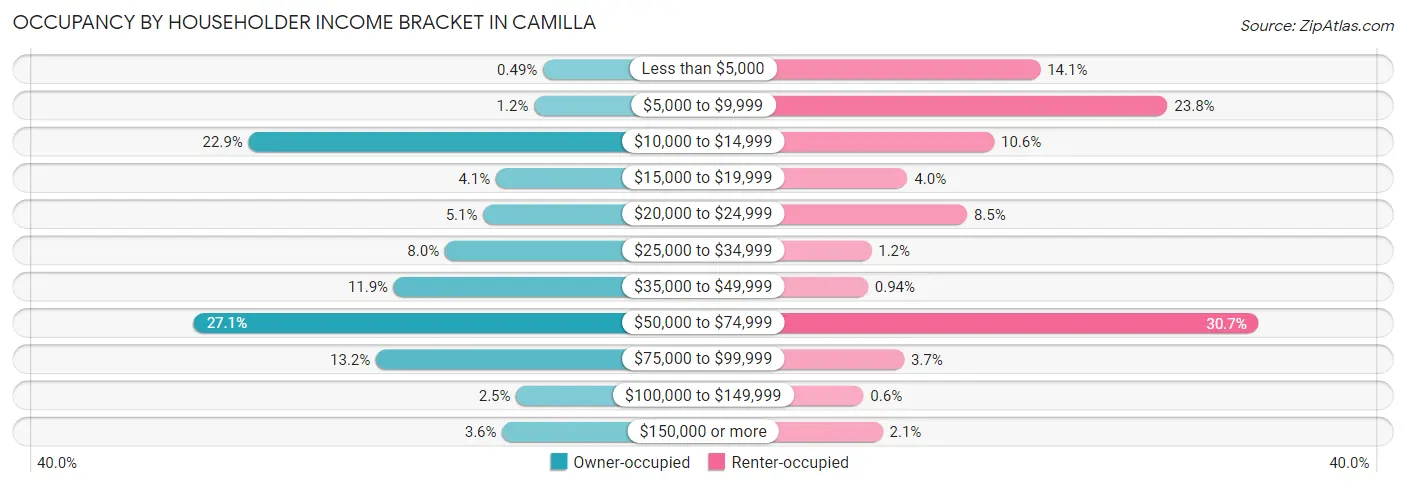
| Income Bracket | Owner-occupied | Renter-occupied |
| Less than $5,000 | 5 (0.5%) | 164 (14.1%) |
| $5,000 to $9,999 | 12 (1.2%) | 277 (23.8%) |
| $10,000 to $14,999 | 236 (22.9%) | 123 (10.5%) |
| $15,000 to $19,999 | 42 (4.1%) | 46 (4.0%) |
| $20,000 to $24,999 | 52 (5.1%) | 99 (8.5%) |
| $25,000 to $34,999 | 82 (8.0%) | 14 (1.2%) |
| $35,000 to $49,999 | 122 (11.9%) | 11 (0.9%) |
| $50,000 to $74,999 | 279 (27.1%) | 358 (30.7%) |
| $75,000 to $99,999 | 136 (13.2%) | 43 (3.7%) |
| $100,000 to $149,999 | 26 (2.5%) | 7 (0.6%) |
| $150,000 or more | 37 (3.6%) | 24 (2.1%) |
| Total | 1,029 (100.0%) | 1,166 (100.0%) |
Monthly Housing Cost Tiers in Camilla
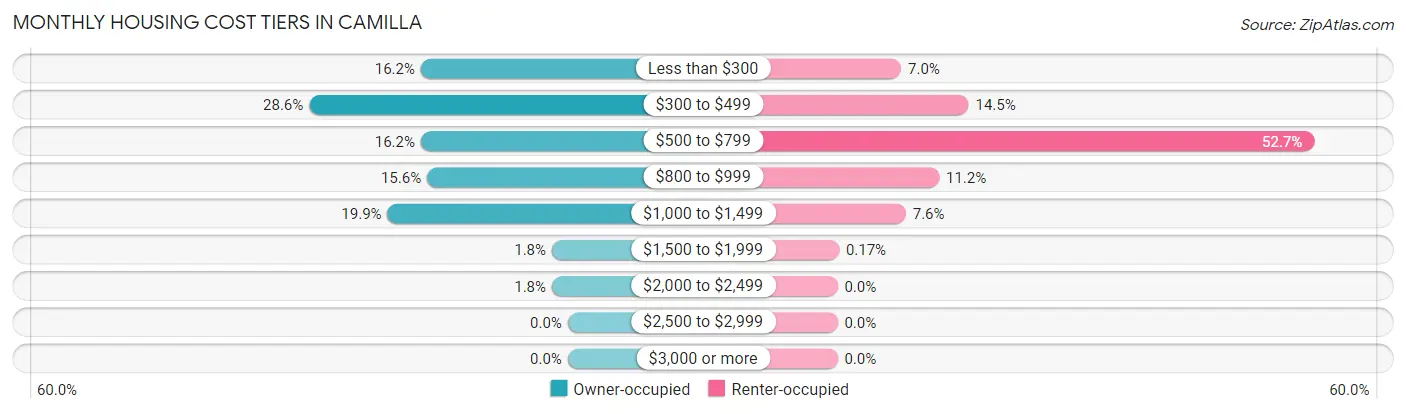
| Monthly Cost | Owner-occupied | Renter-occupied |
| Less than $300 | 167 (16.2%) | 82 (7.0%) |
| $300 to $499 | 294 (28.6%) | 169 (14.5%) |
| $500 to $799 | 167 (16.2%) | 614 (52.7%) |
| $800 to $999 | 160 (15.5%) | 131 (11.2%) |
| $1,000 to $1,499 | 205 (19.9%) | 88 (7.5%) |
| $1,500 to $1,999 | 18 (1.8%) | 2 (0.2%) |
| $2,000 to $2,499 | 18 (1.8%) | 0 (0.0%) |
| $2,500 to $2,999 | 0 (0.0%) | 0 (0.0%) |
| $3,000 or more | 0 (0.0%) | 0 (0.0%) |
| Total | 1,029 (100.0%) | 1,166 (100.0%) |
Physical Housing Characteristics in Camilla
Housing Structures in Camilla
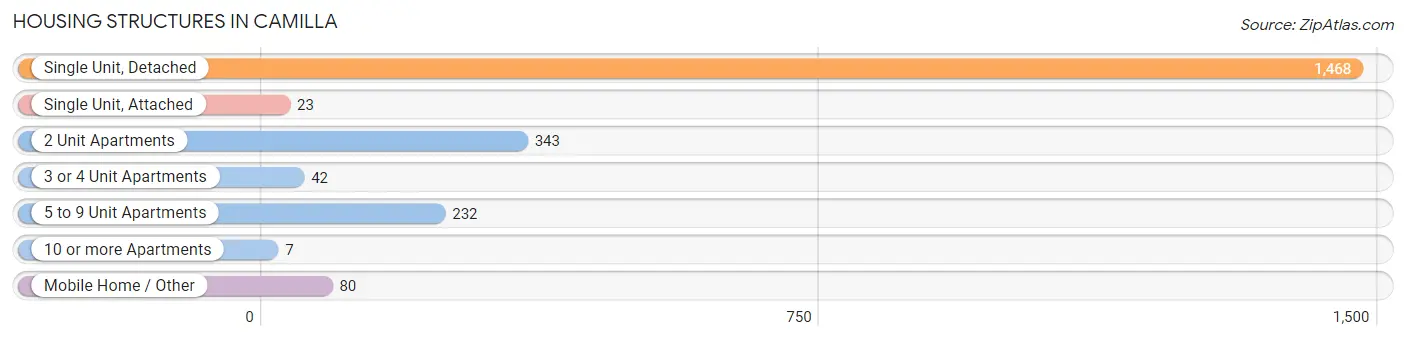
| Structure Type | # Housing Units | % Housing Units |
| Single Unit, Detached | 1,468 | 66.9% |
| Single Unit, Attached | 23 | 1.1% |
| 2 Unit Apartments | 343 | 15.6% |
| 3 or 4 Unit Apartments | 42 | 1.9% |
| 5 to 9 Unit Apartments | 232 | 10.6% |
| 10 or more Apartments | 7 | 0.3% |
| Mobile Home / Other | 80 | 3.6% |
| Total | 2,195 | 100.0% |
Housing Structures by Occupancy in Camilla
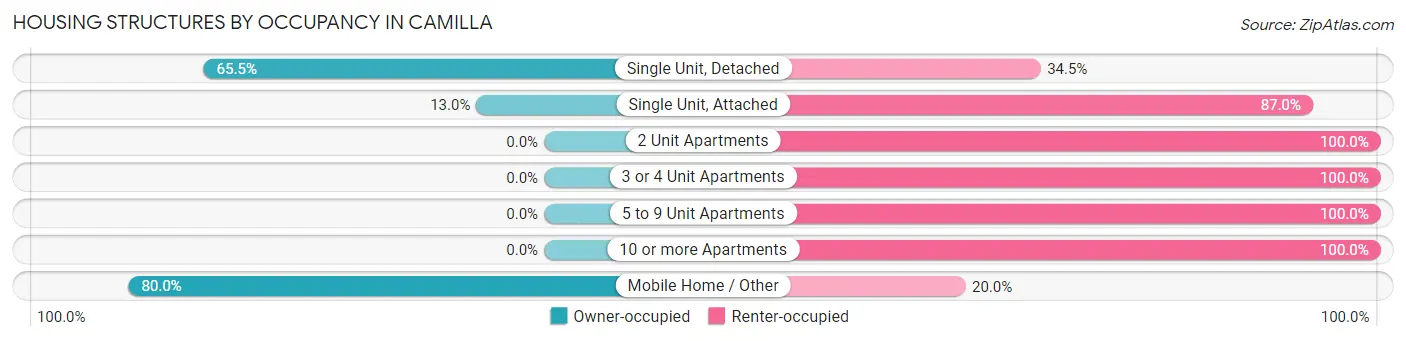
| Structure Type | Owner-occupied | Renter-occupied |
| Single Unit, Detached | 962 (65.5%) | 506 (34.5%) |
| Single Unit, Attached | 3 (13.0%) | 20 (87.0%) |
| 2 Unit Apartments | 0 (0.0%) | 343 (100.0%) |
| 3 or 4 Unit Apartments | 0 (0.0%) | 42 (100.0%) |
| 5 to 9 Unit Apartments | 0 (0.0%) | 232 (100.0%) |
| 10 or more Apartments | 0 (0.0%) | 7 (100.0%) |
| Mobile Home / Other | 64 (80.0%) | 16 (20.0%) |
| Total | 1,029 (46.9%) | 1,166 (53.1%) |
Housing Structures by Number of Rooms in Camilla
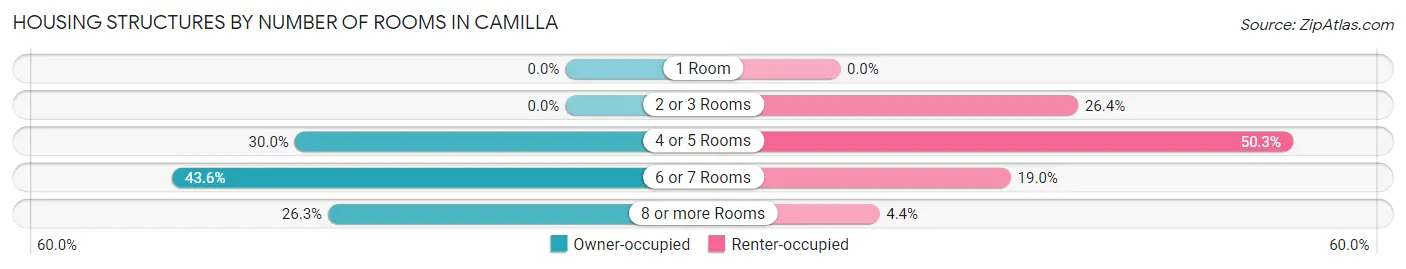
| Number of Rooms | Owner-occupied | Renter-occupied |
| 1 Room | 0 (0.0%) | 0 (0.0%) |
| 2 or 3 Rooms | 0 (0.0%) | 308 (26.4%) |
| 4 or 5 Rooms | 309 (30.0%) | 586 (50.3%) |
| 6 or 7 Rooms | 449 (43.6%) | 221 (19.0%) |
| 8 or more Rooms | 271 (26.3%) | 51 (4.4%) |
| Total | 1,029 (100.0%) | 1,166 (100.0%) |
Housing Structure by Heating Type in Camilla
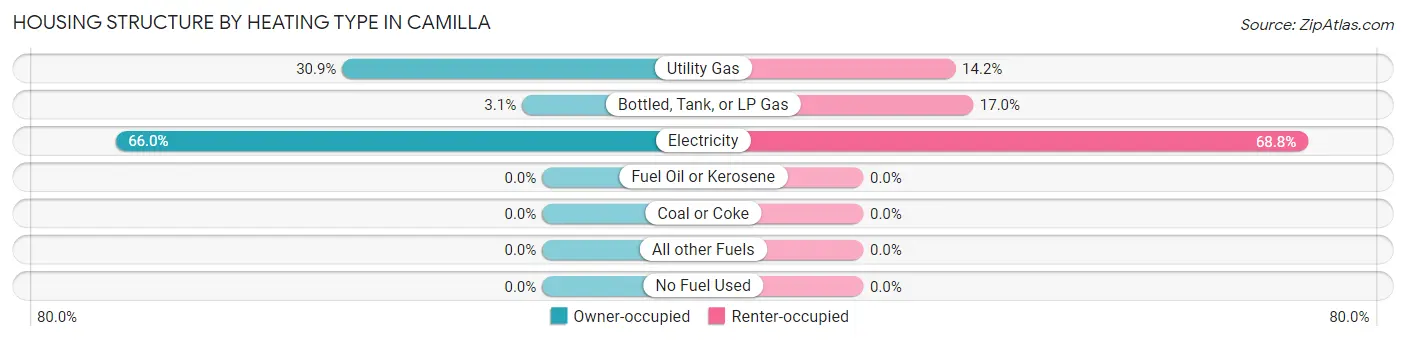
| Heating Type | Owner-occupied | Renter-occupied |
| Utility Gas | 318 (30.9%) | 166 (14.2%) |
| Bottled, Tank, or LP Gas | 32 (3.1%) | 198 (17.0%) |
| Electricity | 679 (66.0%) | 802 (68.8%) |
| Fuel Oil or Kerosene | 0 (0.0%) | 0 (0.0%) |
| Coal or Coke | 0 (0.0%) | 0 (0.0%) |
| All other Fuels | 0 (0.0%) | 0 (0.0%) |
| No Fuel Used | 0 (0.0%) | 0 (0.0%) |
| Total | 1,029 (100.0%) | 1,166 (100.0%) |
Household Vehicle Usage in Camilla
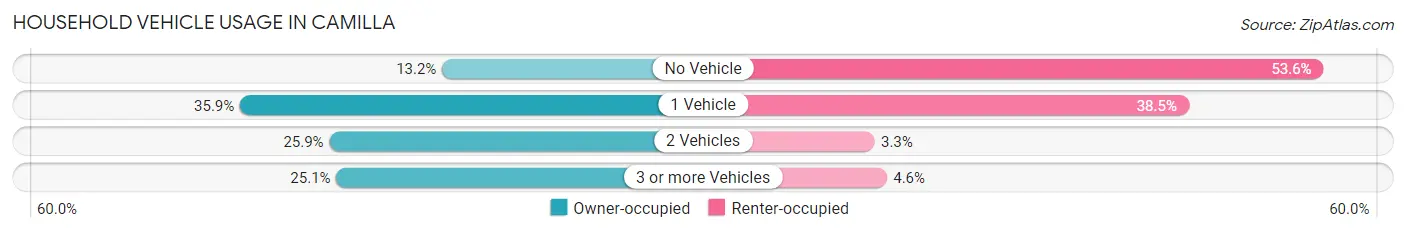
| Vehicles per Household | Owner-occupied | Renter-occupied |
| No Vehicle | 136 (13.2%) | 625 (53.6%) |
| 1 Vehicle | 369 (35.9%) | 449 (38.5%) |
| 2 Vehicles | 266 (25.9%) | 38 (3.3%) |
| 3 or more Vehicles | 258 (25.1%) | 54 (4.6%) |
| Total | 1,029 (100.0%) | 1,166 (100.0%) |
Real Estate & Mortgages in Camilla
Real Estate and Mortgage Overview in Camilla
| Characteristic | Without Mortgage | With Mortgage |
| Housing Units | 578 | 451 |
| Median Property Value | $66,800 | $90,200 |
| Median Household Income | $43,897 | $15 |
| Monthly Housing Costs | $339 | $0 |
| Real Estate Taxes | $769 | $22 |
Property Value by Mortgage Status in Camilla
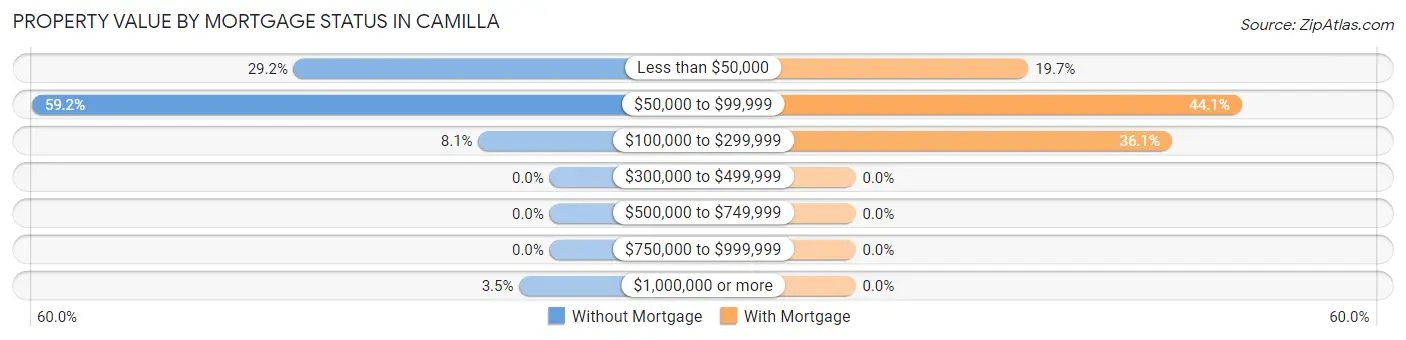
| Property Value | Without Mortgage | With Mortgage |
| Less than $50,000 | 169 (29.2%) | 89 (19.7%) |
| $50,000 to $99,999 | 342 (59.2%) | 199 (44.1%) |
| $100,000 to $299,999 | 47 (8.1%) | 163 (36.1%) |
| $300,000 to $499,999 | 0 (0.0%) | 0 (0.0%) |
| $500,000 to $749,999 | 0 (0.0%) | 0 (0.0%) |
| $750,000 to $999,999 | 0 (0.0%) | 0 (0.0%) |
| $1,000,000 or more | 20 (3.5%) | 0 (0.0%) |
| Total | 578 (100.0%) | 451 (100.0%) |
Household Income by Mortgage Status in Camilla
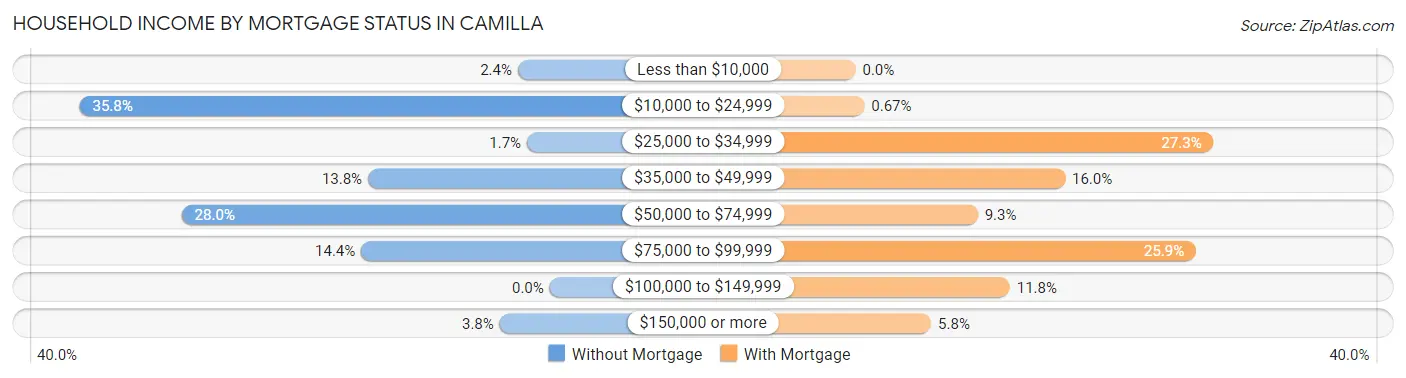
| Household Income | Without Mortgage | With Mortgage |
| Less than $10,000 | 14 (2.4%) | 0 (0.0%) |
| $10,000 to $24,999 | 207 (35.8%) | 3 (0.7%) |
| $25,000 to $34,999 | 10 (1.7%) | 123 (27.3%) |
| $35,000 to $49,999 | 80 (13.8%) | 72 (16.0%) |
| $50,000 to $74,999 | 162 (28.0%) | 42 (9.3%) |
| $75,000 to $99,999 | 83 (14.4%) | 117 (25.9%) |
| $100,000 to $149,999 | 0 (0.0%) | 53 (11.7%) |
| $150,000 or more | 22 (3.8%) | 26 (5.8%) |
| Total | 578 (100.0%) | 451 (100.0%) |
Property Value to Household Income Ratio in Camilla
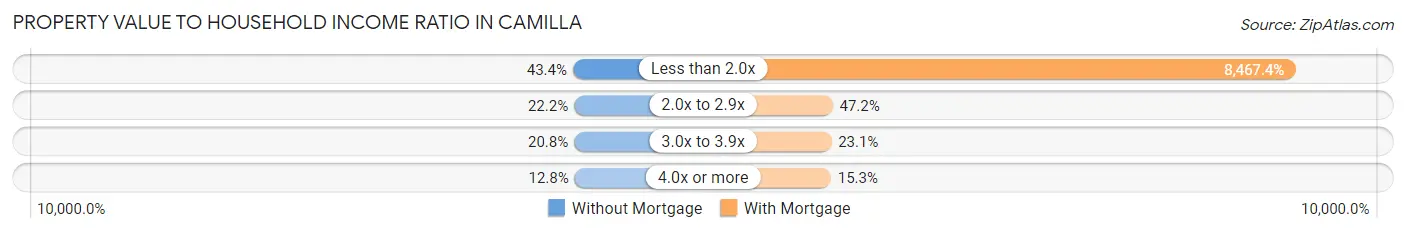
| Value-to-Income Ratio | Without Mortgage | With Mortgage |
| Less than 2.0x | 251 (43.4%) | 38,188 (8,467.4%) |
| 2.0x to 2.9x | 128 (22.2%) | 213 (47.2%) |
| 3.0x to 3.9x | 120 (20.8%) | 104 (23.1%) |
| 4.0x or more | 74 (12.8%) | 69 (15.3%) |
| Total | 578 (100.0%) | 451 (100.0%) |
Real Estate Taxes by Mortgage Status in Camilla
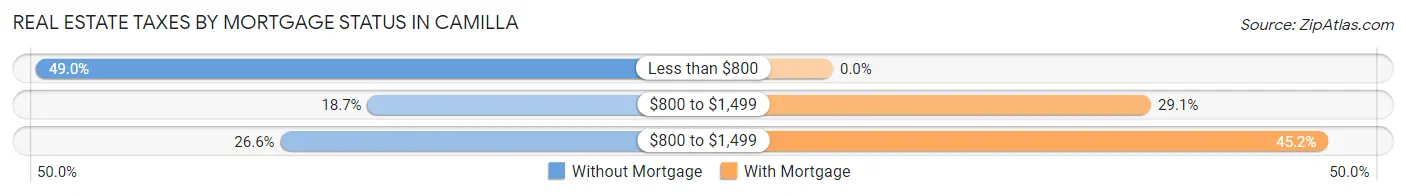
| Property Taxes | Without Mortgage | With Mortgage |
| Less than $800 | 283 (49.0%) | 0 (0.0%) |
| $800 to $1,499 | 108 (18.7%) | 131 (29.0%) |
| $800 to $1,499 | 154 (26.6%) | 204 (45.2%) |
| Total | 578 (100.0%) | 451 (100.0%) |
Health & Disability in Camilla
Health Insurance Coverage by Age in Camilla
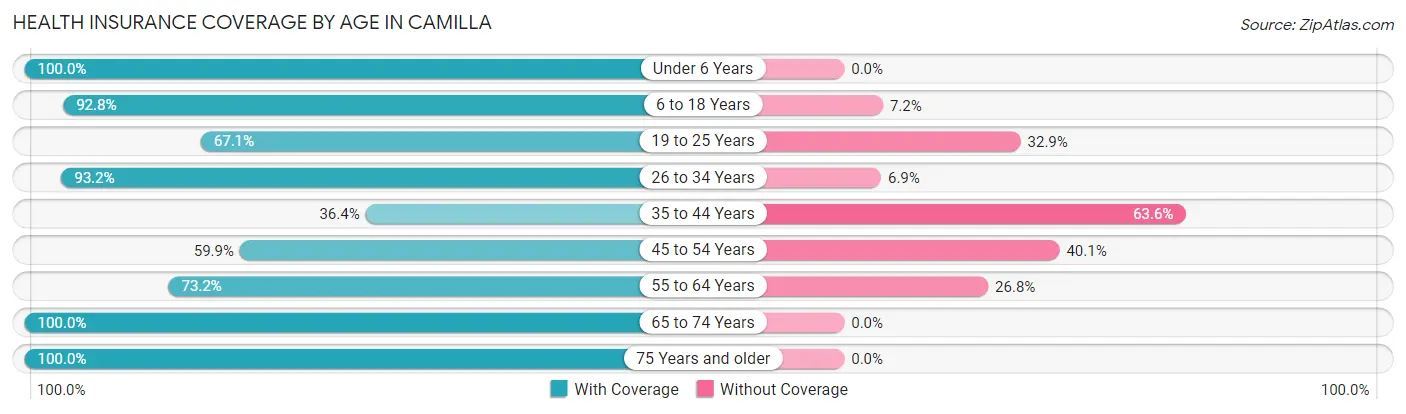
| Age Bracket | With Coverage | Without Coverage |
| Under 6 Years | 563 (100.0%) | 0 (0.0%) |
| 6 to 18 Years | 837 (92.8%) | 65 (7.2%) |
| 19 to 25 Years | 149 (67.1%) | 73 (32.9%) |
| 26 to 34 Years | 435 (93.1%) | 32 (6.9%) |
| 35 to 44 Years | 282 (36.4%) | 492 (63.6%) |
| 45 to 54 Years | 382 (59.9%) | 256 (40.1%) |
| 55 to 64 Years | 439 (73.2%) | 161 (26.8%) |
| 65 to 74 Years | 587 (100.0%) | 0 (0.0%) |
| 75 Years and older | 356 (100.0%) | 0 (0.0%) |
| Total | 4,030 (78.9%) | 1,079 (21.1%) |
Health Insurance Coverage by Citizenship Status in Camilla
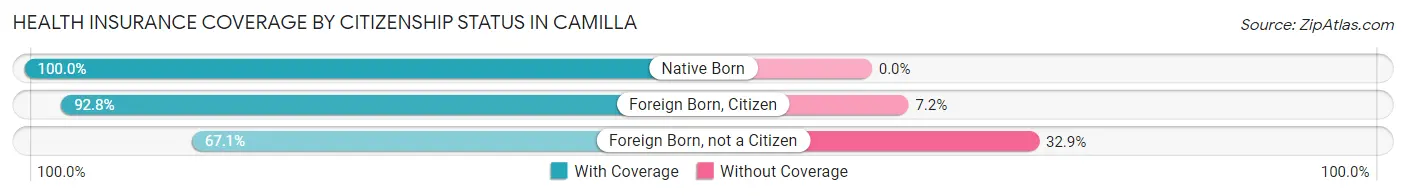
| Citizenship Status | With Coverage | Without Coverage |
| Native Born | 563 (100.0%) | 0 (0.0%) |
| Foreign Born, Citizen | 837 (92.8%) | 65 (7.2%) |
| Foreign Born, not a Citizen | 149 (67.1%) | 73 (32.9%) |
Health Insurance Coverage by Household Income in Camilla
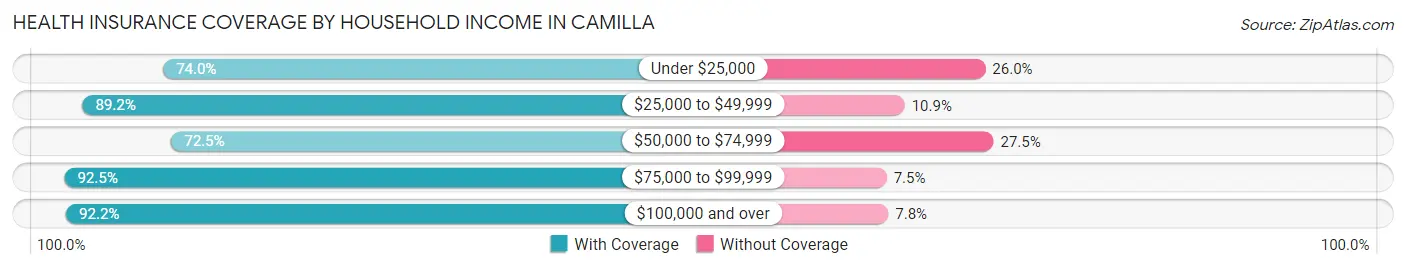
| Household Income | With Coverage | Without Coverage |
| Under $25,000 | 1,656 (74.0%) | 581 (26.0%) |
| $25,000 to $49,999 | 682 (89.1%) | 83 (10.8%) |
| $50,000 to $74,999 | 926 (72.5%) | 351 (27.5%) |
| $75,000 to $99,999 | 470 (92.5%) | 38 (7.5%) |
| $100,000 and over | 296 (92.2%) | 25 (7.8%) |
Public vs Private Health Insurance Coverage by Age in Camilla
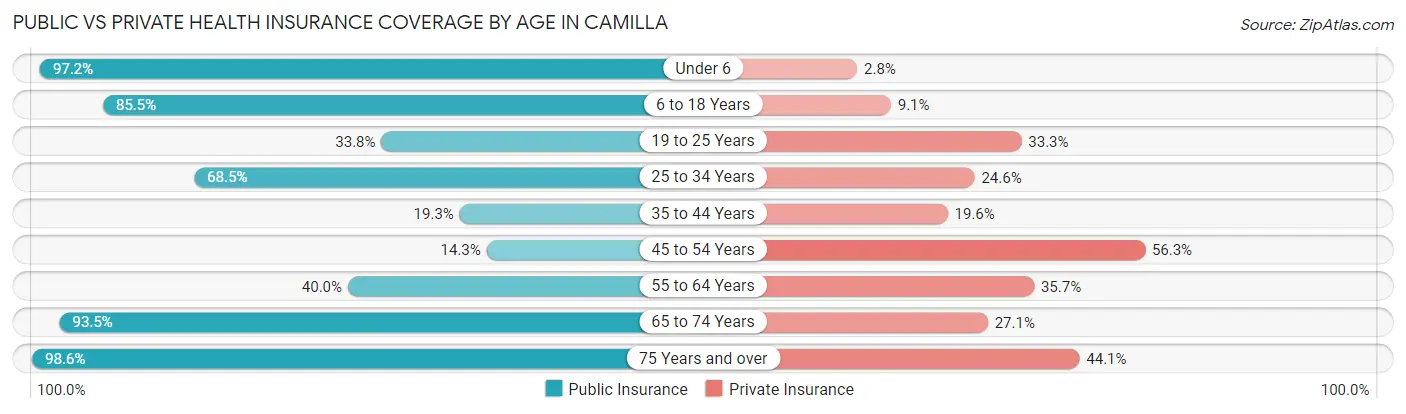
| Age Bracket | Public Insurance | Private Insurance |
| Under 6 | 547 (97.2%) | 16 (2.8%) |
| 6 to 18 Years | 771 (85.5%) | 82 (9.1%) |
| 19 to 25 Years | 75 (33.8%) | 74 (33.3%) |
| 25 to 34 Years | 320 (68.5%) | 115 (24.6%) |
| 35 to 44 Years | 149 (19.3%) | 152 (19.6%) |
| 45 to 54 Years | 91 (14.3%) | 359 (56.3%) |
| 55 to 64 Years | 240 (40.0%) | 214 (35.7%) |
| 65 to 74 Years | 549 (93.5%) | 159 (27.1%) |
| 75 Years and over | 351 (98.6%) | 157 (44.1%) |
| Total | 3,093 (60.5%) | 1,328 (26.0%) |
Disability Status by Sex by Age in Camilla
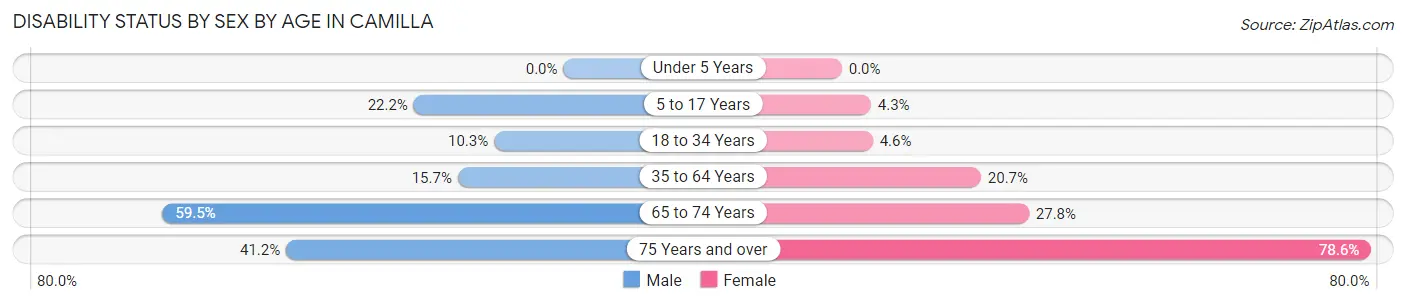
| Age Bracket | Male | Female |
| Under 5 Years | 0 (0.0%) | 0 (0.0%) |
| 5 to 17 Years | 88 (22.2%) | 23 (4.3%) |
| 18 to 34 Years | 35 (10.3%) | 18 (4.6%) |
| 35 to 64 Years | 156 (15.7%) | 210 (20.6%) |
| 65 to 74 Years | 178 (59.5%) | 80 (27.8%) |
| 75 Years and over | 35 (41.2%) | 213 (78.6%) |
Disability Class by Sex by Age in Camilla
Disability Class: Hearing Difficulty
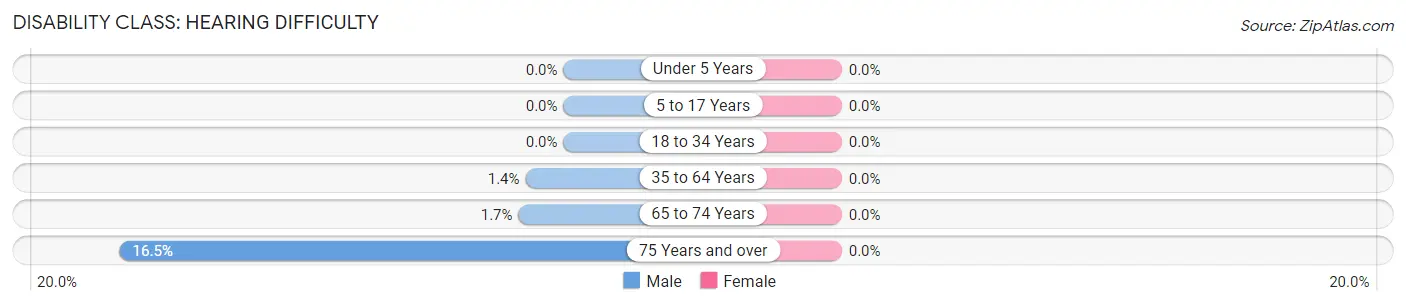
| Age Bracket | Male | Female |
| Under 5 Years | 0 (0.0%) | 0 (0.0%) |
| 5 to 17 Years | 0 (0.0%) | 0 (0.0%) |
| 18 to 34 Years | 0 (0.0%) | 0 (0.0%) |
| 35 to 64 Years | 14 (1.4%) | 0 (0.0%) |
| 65 to 74 Years | 5 (1.7%) | 0 (0.0%) |
| 75 Years and over | 14 (16.5%) | 0 (0.0%) |
Disability Class: Vision Difficulty
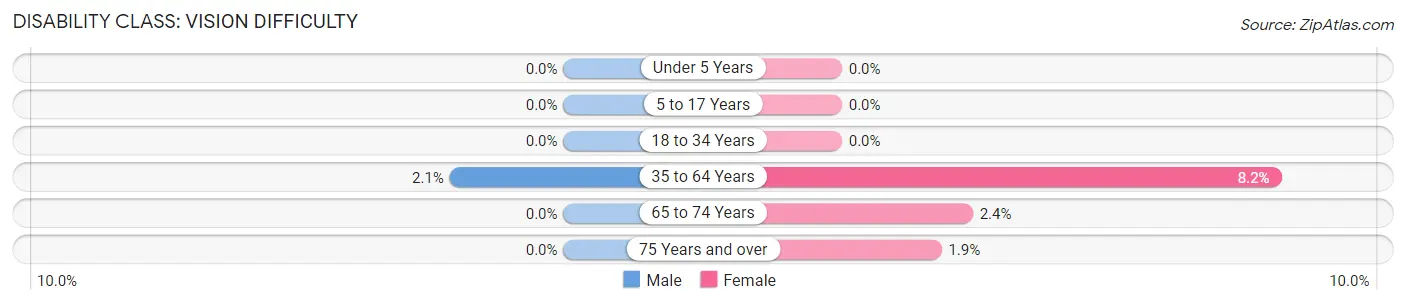
| Age Bracket | Male | Female |
| Under 5 Years | 0 (0.0%) | 0 (0.0%) |
| 5 to 17 Years | 0 (0.0%) | 0 (0.0%) |
| 18 to 34 Years | 0 (0.0%) | 0 (0.0%) |
| 35 to 64 Years | 21 (2.1%) | 83 (8.2%) |
| 65 to 74 Years | 0 (0.0%) | 7 (2.4%) |
| 75 Years and over | 0 (0.0%) | 5 (1.8%) |
Disability Class: Cognitive Difficulty
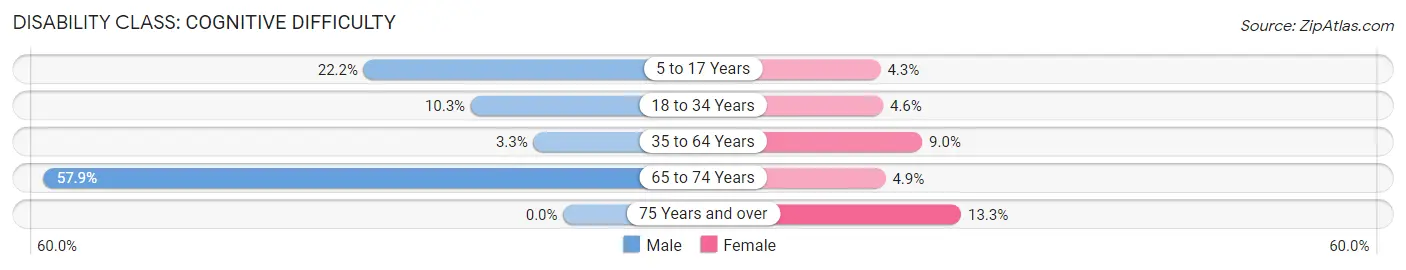
| Age Bracket | Male | Female |
| 5 to 17 Years | 88 (22.2%) | 23 (4.3%) |
| 18 to 34 Years | 35 (10.3%) | 18 (4.6%) |
| 35 to 64 Years | 33 (3.3%) | 91 (8.9%) |
| 65 to 74 Years | 173 (57.9%) | 14 (4.9%) |
| 75 Years and over | 0 (0.0%) | 36 (13.3%) |
Disability Class: Ambulatory Difficulty
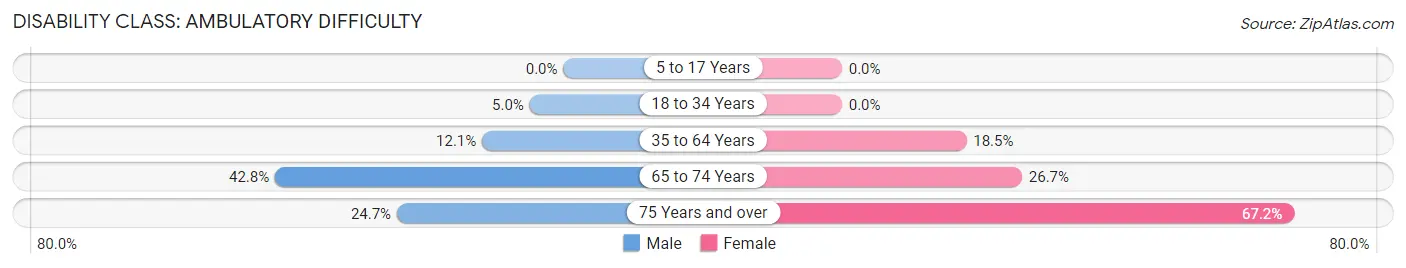
| Age Bracket | Male | Female |
| 5 to 17 Years | 0 (0.0%) | 0 (0.0%) |
| 18 to 34 Years | 17 (5.0%) | 0 (0.0%) |
| 35 to 64 Years | 120 (12.1%) | 188 (18.5%) |
| 65 to 74 Years | 128 (42.8%) | 77 (26.7%) |
| 75 Years and over | 21 (24.7%) | 182 (67.2%) |
Disability Class: Self-Care Difficulty
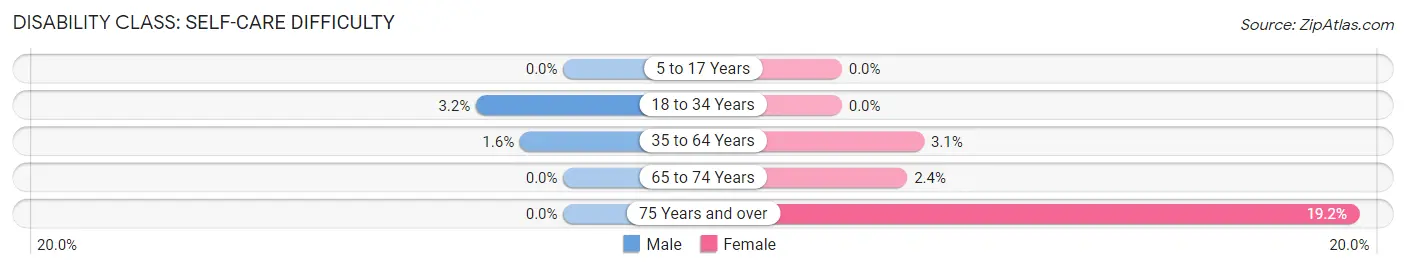
| Age Bracket | Male | Female |
| 5 to 17 Years | 0 (0.0%) | 0 (0.0%) |
| 18 to 34 Years | 11 (3.2%) | 0 (0.0%) |
| 35 to 64 Years | 16 (1.6%) | 31 (3.0%) |
| 65 to 74 Years | 0 (0.0%) | 7 (2.4%) |
| 75 Years and over | 0 (0.0%) | 52 (19.2%) |
Technology Access in Camilla
Computing Device Access in Camilla
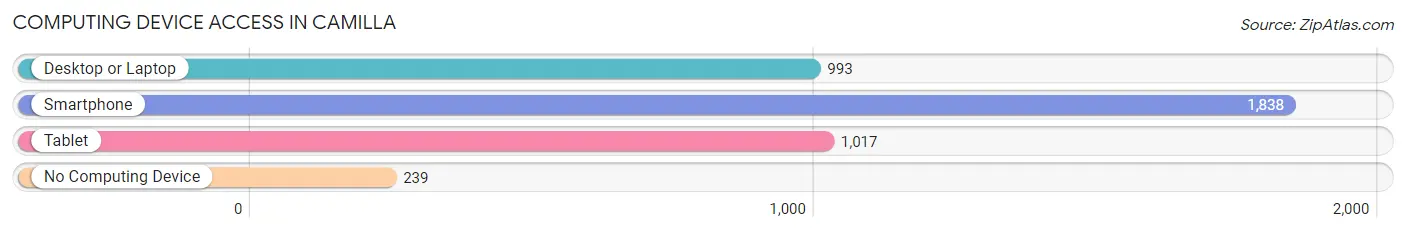
| Device Type | # Households | % Households |
| Desktop or Laptop | 993 | 45.2% |
| Smartphone | 1,838 | 83.7% |
| Tablet | 1,017 | 46.3% |
| No Computing Device | 239 | 10.9% |
| Total | 2,195 | 100.0% |
Internet Access in Camilla
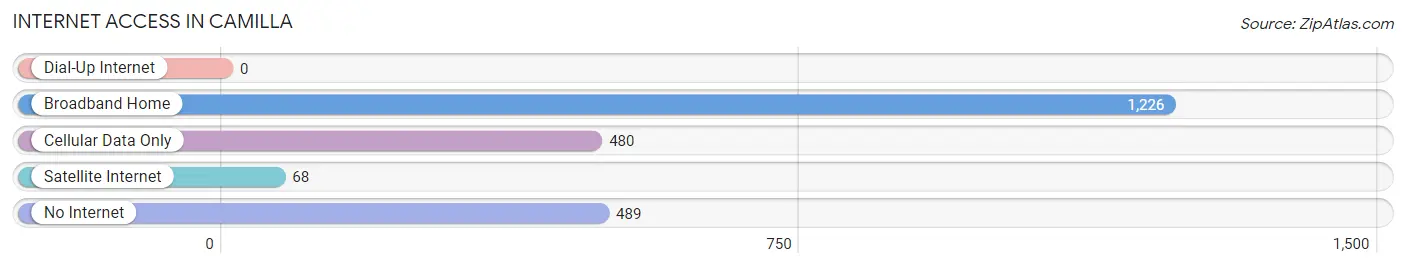
| Internet Type | # Households | % Households |
| Dial-Up Internet | 0 | 0.0% |
| Broadband Home | 1,226 | 55.8% |
| Cellular Data Only | 480 | 21.9% |
| Satellite Internet | 68 | 3.1% |
| No Internet | 489 | 22.3% |
| Total | 2,195 | 100.0% |
Camilla Summary
Camilla, Georgia is a small city located in Mitchell County, in the southwestern part of the state. It is situated along the Flint River, about 40 miles south of Albany and about 90 miles north of Tallahassee, Florida. The city has a population of 5,400 people, according to the 2010 census.
History
The area that is now Camilla was first settled in the early 1800s by settlers from the Carolinas. The town was originally known as "Cotton Town" due to the large amount of cotton grown in the area. In 1854, the town was officially incorporated as Camilla, named after the daughter of a local plantation owner.
During the Civil War, Camilla was a major supply center for the Confederate Army. After the war, the town experienced a period of growth and prosperity, with the establishment of several businesses, including a cotton gin, a sawmill, and a gristmill.
In the early 1900s, Camilla was a major center for the production of turpentine and naval stores. The town also had a thriving lumber industry, with several sawmills located in the area.
Geography
Camilla is located in the southwestern part of Georgia, in Mitchell County. The city is situated along the Flint River, about 40 miles south of Albany and about 90 miles north of Tallahassee, Florida. The city has a total area of 4.2 square miles, all of which is land.
The climate in Camilla is classified as humid subtropical, with hot, humid summers and mild winters. The average annual temperature is around 70 degrees Fahrenheit, with an average high of around 90 degrees in the summer and an average low of around 50 degrees in the winter.
Economy
The economy of Camilla is largely based on agriculture. The city is home to several large farms, which produce cotton, peanuts, corn, and soybeans. The city also has a thriving timber industry, with several sawmills located in the area.
In addition to agriculture and timber, Camilla is home to several manufacturing companies, including a furniture factory, a paper mill, and a plastics plant. The city also has a growing tourism industry, with several bed and breakfasts, restaurants, and antique shops located in the downtown area.
Demographics
According to the 2010 census, Camilla has a population of 5,400 people. The racial makeup of the city is 54.3% White, 39.7% African American, 0.3% Native American, 0.7% Asian, and 4.9% from other races. The median household income is $30,000, and the median age is 37.
Camilla is a small, close-knit community with a strong sense of pride and tradition. The city is home to several churches, a library, and a museum, as well as a variety of recreational activities, including fishing, hunting, and camping. The city also hosts several annual festivals, including the Camilla Cotton Festival and the Camilla Watermelon Festival.
Common Questions
What is Per Capita Income in Camilla?
Per Capita income in Camilla is $22,648.
What is the Median Family Income in Camilla?
Median Family Income in Camilla is $25,500.
What is the Median Household income in Camilla?
Median Household Income in Camilla is $27,306.
What is Income or Wage Gap in Camilla?
Income or Wage Gap in Camilla is 47.5%.
Women in Camilla earn 52.5 cents for every dollar earned by a man.
What is Inequality or Gini Index in Camilla?
Inequality or Gini Index in Camilla is 0.54.
What is the Total Population of Camilla?
Total Population of Camilla is 5,163.
What is the Total Male Population of Camilla?
Total Male Population of Camilla is 2,402.
What is the Total Female Population of Camilla?
Total Female Population of Camilla is 2,761.
What is the Ratio of Males per 100 Females in Camilla?
There are 87.00 Males per 100 Females in Camilla.
What is the Ratio of Females per 100 Males in Camilla?
There are 114.95 Females per 100 Males in Camilla.
What is the Median Population Age in Camilla?
Median Population Age in Camilla is 40.6 Years.
What is the Average Family Size in Camilla
Average Family Size in Camilla is 3.2 People.
What is the Average Household Size in Camilla
Average Household Size in Camilla is 2.3 People.
How Large is the Labor Force in Camilla?
There are 1,882 People in the Labor Forcein in Camilla.
What is the Percentage of People in the Labor Force in Camilla?
48.3% of People are in the Labor Force in Camilla.
What is the Unemployment Rate in Camilla?
Unemployment Rate in Camilla is 11.3%.