Zip Codes with the Highest Percentage of Households with Income Above $200,000 in Denver, CO
RELATED REPORTS & OPTIONS
Household Income | $200k+
Denver
Compare Zip Codes
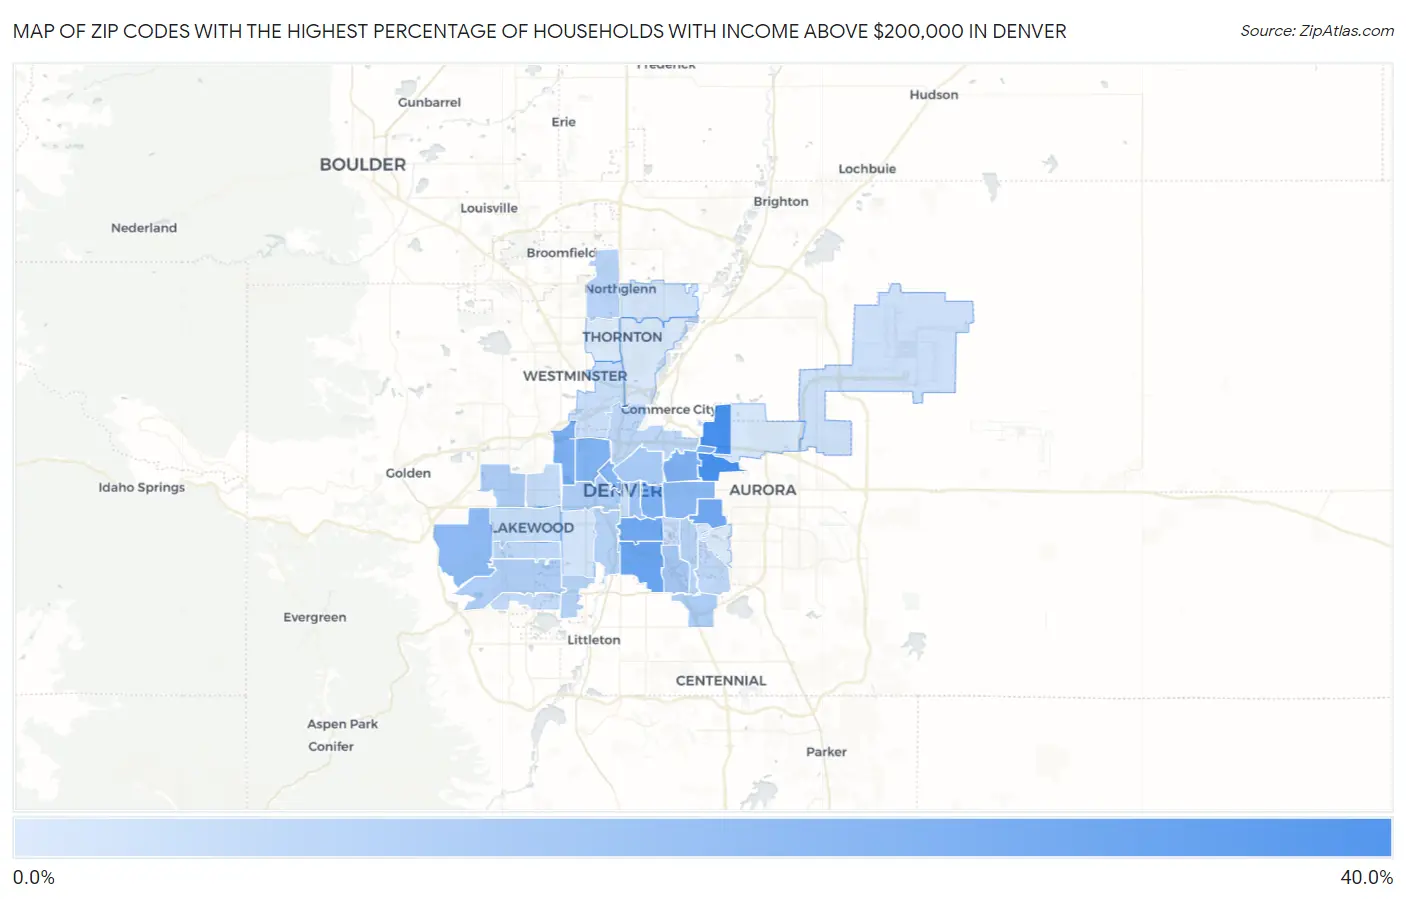
Map of Zip Codes with the Highest Percentage of Households with Income Above $200,000 in Denver
3.1%
36.3%
Zip Codes with the Highest Percentage of Households with Income Above $200,000 in Denver, CO
| Zip Code | Households with Income > $200k | vs State | vs National | |
| 1. | 80238 | 36.3% | 13.9%(+22.4)#11 | 11.4%(+24.9)#885 |
| 2. | 80210 | 28.0% | 13.9%(+14.1)#36 | 11.4%(+16.6)#1,719 |
| 3. | 80230 | 26.4% | 13.9%(+12.5)#42 | 11.4%(+15.0)#1,969 |
| 4. | 80209 | 25.9% | 13.9%(+12.0)#46 | 11.4%(+14.5)#2,041 |
| 5. | 80212 | 23.3% | 13.9%(+9.40)#54 | 11.4%(+11.9)#2,495 |
| 6. | 80206 | 23.2% | 13.9%(+9.30)#56 | 11.4%(+11.8)#2,519 |
| 7. | 80207 | 22.9% | 13.9%(+9.00)#57 | 11.4%(+11.5)#2,574 |
| 8. | 80211 | 22.3% | 13.9%(+8.40)#64 | 11.4%(+10.9)#2,715 |
| 9. | 80202 | 21.5% | 13.9%(+7.60)#70 | 11.4%(+10.1)#2,886 |
| 10. | 80220 | 20.2% | 13.9%(+6.30)#79 | 11.4%(+8.80)#3,229 |
| 11. | 80228 | 19.1% | 13.9%(+5.20)#84 | 11.4%(+7.70)#3,531 |
| 12. | 80218 | 15.6% | 13.9%(+1.70)#113 | 11.4%(+4.20)#4,725 |
| 13. | 80222 | 14.5% | 13.9%(+0.600)#119 | 11.4%(+3.10)#5,217 |
| 14. | 80205 | 13.9% | 13.9%(=0.000)#122 | 11.4%(+2.50)#5,515 |
| 15. | 80204 | 12.9% | 13.9%(-1.00)#132 | 11.4%(+1.50)#6,069 |
| 16. | 80215 | 12.9% | 13.9%(-1.00)#133 | 11.4%(+1.50)#6,085 |
| 17. | 80237 | 12.7% | 13.9%(-1.20)#135 | 11.4%(+1.30)#6,203 |
| 18. | 80227 | 12.2% | 13.9%(-1.70)#146 | 11.4%(+0.800)#6,529 |
| 19. | 80224 | 11.1% | 13.9%(-2.80)#160 | 11.4%(-0.300)#7,316 |
| 20. | 80223 | 11.0% | 13.9%(-2.90)#163 | 11.4%(-0.400)#7,408 |
| 21. | 80236 | 10.7% | 13.9%(-3.20)#170 | 11.4%(-0.700)#7,634 |
| 22. | 80234 | 10.4% | 13.9%(-3.50)#174 | 11.4%(-1.000)#7,875 |
| 23. | 80216 | 9.3% | 13.9%(-4.60)#199 | 11.4%(-2.10)#8,947 |
| 24. | 80232 | 9.2% | 13.9%(-4.70)#200 | 11.4%(-2.20)#9,044 |
| 25. | 80231 | 9.1% | 13.9%(-4.80)#204 | 11.4%(-2.30)#9,130 |
| 26. | 80214 | 8.3% | 13.9%(-5.60)#218 | 11.4%(-3.10)#10,005 |
| 27. | 80235 | 8.2% | 13.9%(-5.70)#220 | 11.4%(-3.20)#10,131 |
| 28. | 80226 | 7.4% | 13.9%(-6.50)#238 | 11.4%(-4.00)#11,192 |
| 29. | 80246 | 7.4% | 13.9%(-6.50)#239 | 11.4%(-4.00)#11,218 |
| 30. | 80221 | 7.3% | 13.9%(-6.60)#241 | 11.4%(-4.10)#11,327 |
| 31. | 80203 | 7.2% | 13.9%(-6.70)#245 | 11.4%(-4.20)#11,504 |
| 32. | 80249 | 6.4% | 13.9%(-7.50)#267 | 11.4%(-5.00)#12,715 |
| 33. | 80233 | 5.5% | 13.9%(-8.40)#294 | 11.4%(-5.90)#14,471 |
| 34. | 80219 | 5.3% | 13.9%(-8.60)#296 | 11.4%(-6.10)#14,860 |
| 35. | 80239 | 4.5% | 13.9%(-9.40)#319 | 11.4%(-6.90)#16,757 |
| 36. | 80229 | 4.2% | 13.9%(-9.70)#332 | 11.4%(-7.20)#17,528 |
| 37. | 80247 | 3.3% | 13.9%(-10.6)#370 | 11.4%(-8.10)#20,023 |
| 38. | 80260 | 3.1% | 13.9%(-10.8)#373 | 11.4%(-8.30)#20,577 |
1
Common Questions
What are the Top 10 Zip Codes with the Highest Percentage of Households with Income Above $200,000 in Denver, CO?
Top 10 Zip Codes with the Highest Percentage of Households with Income Above $200,000 in Denver, CO are:
What zip code has the Highest Percentage of Households with Income Above $200,000 in Denver, CO?
80238 has the Highest Percentage of Households with Income Above $200,000 in Denver, CO with 36.3%.
What is the Percentage of Households with Income Above $200,000 in Denver, CO?
Percentage of Households with Income Above $200,000 in Denver is 15.3%.
What is the Percentage of Households with Income Above $200,000 in Colorado?
Percentage of Households with Income Above $200,000 in Colorado is 13.9%.
What is the Percentage of Households with Income Above $200,000 in the United States?
Percentage of Households with Income Above $200,000 in the United States is 11.4%.