Zip Codes with the Highest Percentage of Population Employed in Administrative & Support Services in Denver, CO
RELATED REPORTS & OPTIONS
Administrative & Support Services
Denver
Compare Zip Codes
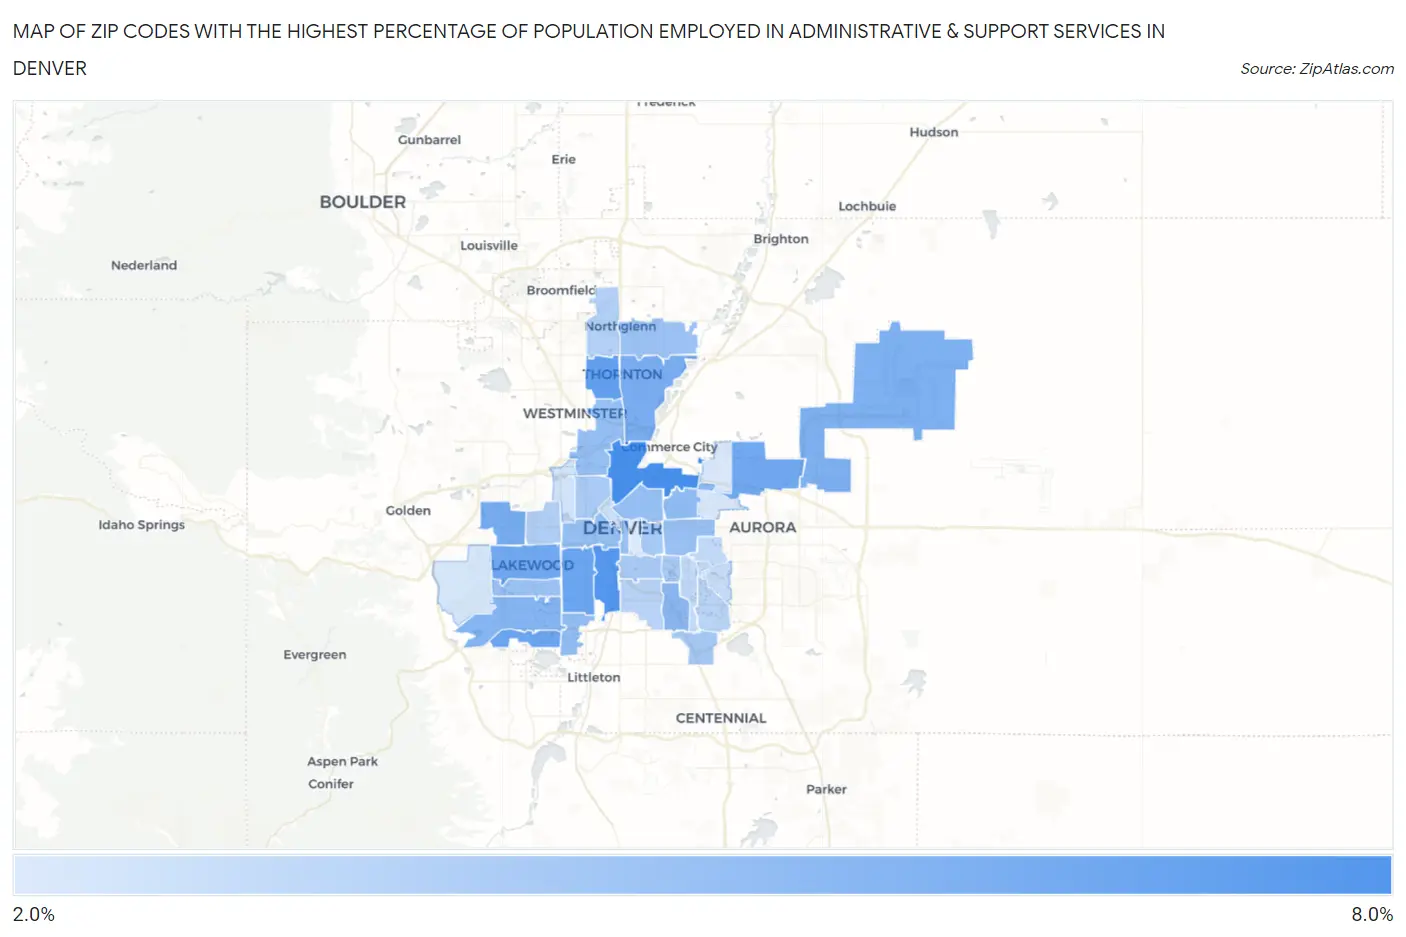
Map of Zip Codes with the Highest Percentage of Population Employed in Administrative & Support Services in Denver
2.1%
7.9%
Zip Codes with the Highest Percentage of Population Employed in Administrative & Support Services in Denver, CO
| Zip Code | % Employed | vs State | vs National | |
| 1. | 80216 | 7.9% | 4.1%(+3.82)#30 | 4.1%(+3.77)#2,341 |
| 2. | 80223 | 7.3% | 4.1%(+3.24)#39 | 4.1%(+3.18)#2,859 |
| 3. | 80260 | 6.8% | 4.1%(+2.71)#47 | 4.1%(+2.65)#3,484 |
| 4. | 80219 | 6.5% | 4.1%(+2.41)#58 | 4.1%(+2.35)#3,911 |
| 5. | 80235 | 6.5% | 4.1%(+2.39)#59 | 4.1%(+2.33)#3,933 |
| 6. | 80226 | 6.3% | 4.1%(+2.17)#65 | 4.1%(+2.11)#4,303 |
| 7. | 80239 | 6.2% | 4.1%(+2.15)#67 | 4.1%(+2.09)#4,344 |
| 8. | 80215 | 6.0% | 4.1%(+1.88)#73 | 4.1%(+1.83)#4,835 |
| 9. | 80229 | 5.9% | 4.1%(+1.80)#76 | 4.1%(+1.74)#4,974 |
| 10. | 80249 | 5.8% | 4.1%(+1.68)#79 | 4.1%(+1.62)#5,208 |
| 11. | 80227 | 5.5% | 4.1%(+1.37)#89 | 4.1%(+1.32)#5,925 |
| 12. | 80222 | 5.2% | 4.1%(+1.13)#97 | 4.1%(+1.08)#6,539 |
| 13. | 80207 | 5.1% | 4.1%(+0.960)#107 | 4.1%(+0.902)#6,964 |
| 14. | 80236 | 4.9% | 4.1%(+0.820)#115 | 4.1%(+0.762)#7,378 |
| 15. | 80205 | 4.9% | 4.1%(+0.789)#118 | 4.1%(+0.730)#7,465 |
| 16. | 80204 | 4.9% | 4.1%(+0.776)#120 | 4.1%(+0.718)#7,511 |
| 17. | 80221 | 4.8% | 4.1%(+0.735)#123 | 4.1%(+0.677)#7,640 |
| 18. | 80220 | 4.8% | 4.1%(+0.667)#125 | 4.1%(+0.608)#7,855 |
| 19. | 80232 | 4.6% | 4.1%(+0.557)#131 | 4.1%(+0.498)#8,197 |
| 20. | 80233 | 4.6% | 4.1%(+0.545)#132 | 4.1%(+0.487)#8,234 |
| 21. | 80203 | 4.6% | 4.1%(+0.480)#135 | 4.1%(+0.422)#8,465 |
| 22. | 80237 | 4.2% | 4.1%(+0.125)#155 | 4.1%(+0.067)#9,761 |
| 23. | 80246 | 4.2% | 4.1%(+0.079)#156 | 4.1%(+0.021)#9,959 |
| 24. | 80206 | 4.1% | 4.1%(+0.020)#163 | 4.1%(-0.038)#10,191 |
| 25. | 80211 | 4.1% | 4.1%(-0.035)#167 | 4.1%(-0.093)#10,443 |
| 26. | 80209 | 4.0% | 4.1%(-0.061)#169 | 4.1%(-0.119)#10,556 |
| 27. | 80214 | 3.8% | 4.1%(-0.269)#178 | 4.1%(-0.328)#11,434 |
| 28. | 80234 | 3.7% | 4.1%(-0.420)#187 | 4.1%(-0.479)#12,138 |
| 29. | 80210 | 3.5% | 4.1%(-0.606)#201 | 4.1%(-0.664)#13,045 |
| 30. | 80231 | 3.5% | 4.1%(-0.637)#204 | 4.1%(-0.696)#13,190 |
| 31. | 80224 | 3.2% | 4.1%(-0.885)#224 | 4.1%(-0.943)#14,442 |
| 32. | 80230 | 3.2% | 4.1%(-0.934)#230 | 4.1%(-0.992)#14,700 |
| 33. | 80247 | 2.9% | 4.1%(-1.16)#251 | 4.1%(-1.21)#15,828 |
| 34. | 80202 | 2.8% | 4.1%(-1.26)#257 | 4.1%(-1.32)#16,346 |
| 35. | 80212 | 2.6% | 4.1%(-1.52)#280 | 4.1%(-1.58)#17,747 |
| 36. | 80228 | 2.4% | 4.1%(-1.72)#298 | 4.1%(-1.78)#18,793 |
| 37. | 80238 | 2.2% | 4.1%(-1.91)#311 | 4.1%(-1.97)#19,765 |
| 38. | 80218 | 2.1% | 4.1%(-1.96)#315 | 4.1%(-2.02)#20,005 |
1
Common Questions
What are the Top 10 Zip Codes with the Highest Percentage of Population Employed in Administrative & Support Services in Denver, CO?
Top 10 Zip Codes with the Highest Percentage of Population Employed in Administrative & Support Services in Denver, CO are:
What zip code has the Highest Percentage of Population Employed in Administrative & Support Services in Denver, CO?
80216 has the Highest Percentage of Population Employed in Administrative & Support Services in Denver, CO with 7.9%.
What is the Percentage of Population Employed in Administrative & Support Services in Denver, CO?
Percentage of Population Employed in Administrative & Support Services in Denver is 4.7%.
What is the Percentage of Population Employed in Administrative & Support Services in Colorado?
Percentage of Population Employed in Administrative & Support Services in Colorado is 4.1%.
What is the Percentage of Population Employed in Administrative & Support Services in the United States?
Percentage of Population Employed in Administrative & Support Services in the United States is 4.1%.