Zip Codes with the Highest Percentage of Population Employed in Office & Administration in Denver, CO
RELATED REPORTS & OPTIONS
Office & Administration
Denver
Compare Zip Codes
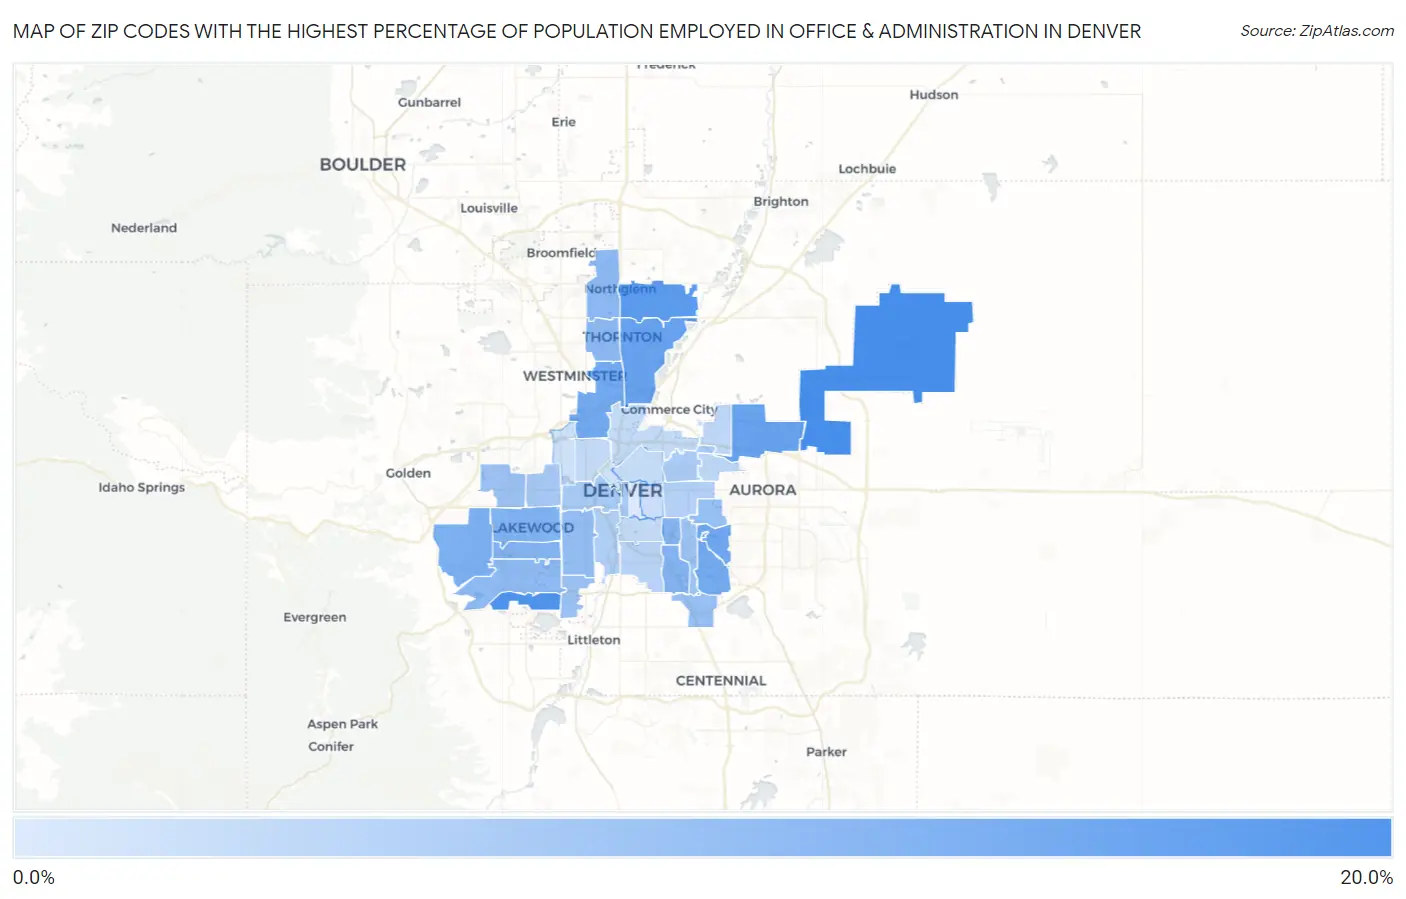
Map of Zip Codes with the Highest Percentage of Population Employed in Office & Administration in Denver
4.6%
15.7%
Zip Codes with the Highest Percentage of Population Employed in Office & Administration in Denver, CO
| Zip Code | % Employed | vs State | vs National | |
| 1. | 80249 | 15.7% | 10.1%(+5.54)#58 | 10.9%(+4.81)#3,862 |
| 2. | 80235 | 15.0% | 10.1%(+4.85)#66 | 10.9%(+4.13)#4,573 |
| 3. | 80233 | 14.0% | 10.1%(+3.87)#80 | 10.9%(+3.14)#6,017 |
| 4. | 80239 | 13.3% | 10.1%(+3.12)#95 | 10.9%(+2.40)#7,467 |
| 5. | 80229 | 13.2% | 10.1%(+3.07)#96 | 10.9%(+2.34)#7,586 |
| 6. | 80247 | 12.5% | 10.1%(+2.42)#116 | 10.9%(+1.69)#9,154 |
| 7. | 80221 | 12.3% | 10.1%(+2.17)#127 | 10.9%(+1.44)#9,862 |
| 8. | 80231 | 12.2% | 10.1%(+2.02)#130 | 10.9%(+1.30)#10,279 |
| 9. | 80228 | 11.6% | 10.1%(+1.45)#145 | 10.9%(+0.721)#12,015 |
| 10. | 80226 | 11.2% | 10.1%(+1.12)#161 | 10.9%(+0.391)#13,064 |
| 11. | 80232 | 11.1% | 10.1%(+0.998)#166 | 10.9%(+0.272)#13,430 |
| 12. | 80222 | 10.9% | 10.1%(+0.788)#177 | 10.9%(+0.062)#14,106 |
| 13. | 80246 | 10.7% | 10.1%(+0.614)#182 | 10.9%(-0.112)#14,658 |
| 14. | 80260 | 10.4% | 10.1%(+0.271)#201 | 10.9%(-0.455)#15,821 |
| 15. | 80234 | 10.4% | 10.1%(+0.254)#203 | 10.9%(-0.472)#15,879 |
| 16. | 80227 | 10.3% | 10.1%(+0.195)#207 | 10.9%(-0.531)#16,079 |
| 17. | 80219 | 9.9% | 10.1%(-0.233)#230 | 10.9%(-0.959)#17,462 |
| 18. | 80230 | 9.7% | 10.1%(-0.464)#237 | 10.9%(-1.19)#18,205 |
| 19. | 80237 | 9.6% | 10.1%(-0.570)#243 | 10.9%(-1.30)#18,550 |
| 20. | 80236 | 9.4% | 10.1%(-0.741)#252 | 10.9%(-1.47)#19,118 |
| 21. | 80215 | 9.3% | 10.1%(-0.867)#255 | 10.9%(-1.59)#19,482 |
| 22. | 80224 | 9.0% | 10.1%(-1.09)#267 | 10.9%(-1.81)#20,131 |
| 23. | 80214 | 8.5% | 10.1%(-1.64)#293 | 10.9%(-2.37)#21,721 |
| 24. | 80203 | 8.4% | 10.1%(-1.78)#302 | 10.9%(-2.50)#22,078 |
| 25. | 80204 | 8.4% | 10.1%(-1.78)#303 | 10.9%(-2.50)#22,079 |
| 26. | 80207 | 8.3% | 10.1%(-1.86)#307 | 10.9%(-2.58)#22,296 |
| 27. | 80223 | 7.7% | 10.1%(-2.42)#335 | 10.9%(-3.15)#23,673 |
| 28. | 80220 | 7.6% | 10.1%(-2.52)#339 | 10.9%(-3.25)#23,905 |
| 29. | 80210 | 7.2% | 10.1%(-2.98)#361 | 10.9%(-3.70)#24,919 |
| 30. | 80238 | 6.7% | 10.1%(-3.40)#375 | 10.9%(-4.13)#25,706 |
| 31. | 80216 | 6.4% | 10.1%(-3.68)#381 | 10.9%(-4.41)#26,181 |
| 32. | 80211 | 6.3% | 10.1%(-3.80)#382 | 10.9%(-4.53)#26,360 |
| 33. | 80290 | 6.2% | 10.1%(-3.92)#386 | 10.9%(-4.64)#26,530 |
| 34. | 80205 | 6.2% | 10.1%(-3.95)#389 | 10.9%(-4.67)#26,580 |
| 35. | 80209 | 6.2% | 10.1%(-3.95)#390 | 10.9%(-4.68)#26,590 |
| 36. | 80206 | 5.8% | 10.1%(-4.30)#400 | 10.9%(-5.03)#27,103 |
| 37. | 80212 | 5.5% | 10.1%(-4.63)#413 | 10.9%(-5.35)#27,533 |
| 38. | 80202 | 5.3% | 10.1%(-4.81)#418 | 10.9%(-5.53)#27,753 |
| 39. | 80218 | 4.6% | 10.1%(-5.54)#433 | 10.9%(-6.27)#28,490 |
1
Common Questions
What are the Top 10 Zip Codes with the Highest Percentage of Population Employed in Office & Administration in Denver, CO?
Top 10 Zip Codes with the Highest Percentage of Population Employed in Office & Administration in Denver, CO are:
What zip code has the Highest Percentage of Population Employed in Office & Administration in Denver, CO?
80249 has the Highest Percentage of Population Employed in Office & Administration in Denver, CO with 15.7%.
What is the Percentage of Population Employed in Office & Administration in Denver, CO?
Percentage of Population Employed in Office & Administration in Denver is 8.6%.
What is the Percentage of Population Employed in Office & Administration in Colorado?
Percentage of Population Employed in Office & Administration in Colorado is 10.1%.
What is the Percentage of Population Employed in Office & Administration in the United States?
Percentage of Population Employed in Office & Administration in the United States is 10.9%.