Zip Codes with the Highest Percentage of Population Employed in Arts, Entertainment & Recreation in Denver, CO

RELATED REPORTS & OPTIONS

Arts, Entertainment & Recreation
Population
Families and Households
Female Fertility
Female Fertility (Unmarried)
Race (Community Size)
Race (Percentage)
Ancestry (Community Size)
AfghanAfricanAlaska NativeAlbanianAlsatianAmericanApacheArabArapahoArgentineanArmenianAssyrian / Chaldean / SyriacAustralianAustrianBahamianBangladeshiBarbadianBasqueBelgianBhutaneseBlackfeetBolivianBrazilianBritishBritish West IndianBulgarianBurmeseCajunCambodianCanadianCape VerdeanCelticCentral AmericanCentral American IndianCherokeeCheyenneChickasawChileanChippewaChoctawColombianComancheCosta RicanCreeCreekCroatianCrowCubanCzechCzechoslovakianDanishDelawareDominicanDutchEastern EuropeanEcuadorianEgyptianEnglishEstonianEthiopianEuropeanFijianFilipinoFinnishFrenchFrench American IndianFrench CanadianGermanGerman RussianGhanaianGreekGuamanian / ChamorroGuatemalanGuyaneseHaitianHonduranHopiHungarianIcelanderIndian (Asian)IndonesianInupiatIranianIraqiIrishIroquoisIsraeliItalianJamaicanJapaneseJordanianKenyanKiowaKoreanLaotianLatvianLebaneseLiberianLithuanianLuxembourgerMacedonianMalaysianMalteseMarshalleseMenomineeMexicanMexican American IndianMongolianMoroccanNative HawaiianNavajoNew ZealanderNicaraguanNigerianNorthern EuropeanNorwegianOkinawanOsagePakistaniPalestinianPanamanianParaguayanPennsylvania GermanPeruvianPimaPolishPortuguesePotawatomiPuebloPuerto RicanRomanianRussianSalvadoranSamoanScandinavianScotch-IrishScottishSeminoleSenegaleseSerbianShoshoneSierra LeoneanSiouxSlavicSlovakSloveneSomaliSouth AfricanSouth AmericanSouth American IndianSpaniardSpanishSpanish AmericanSpanish American IndianSri LankanSubsaharan AfricanSudaneseSwedishSwissSyrianThaiTrinidadian and TobagonianTurkishU.S. Virgin IslanderUgandanUkrainianUruguayanUteVenezuelanVietnameseWelshWest IndianYaquiYugoslavian
Ancestry (Percentage)
AfghanAfricanAlaska NativeAlbanianAlsatianAmericanApacheArabArapahoArgentineanArmenianAssyrian / Chaldean / SyriacAustralianAustrianBahamianBangladeshiBarbadianBasqueBelgianBhutaneseBlackfeetBolivianBrazilianBritishBritish West IndianBulgarianBurmeseCajunCambodianCanadianCape VerdeanCelticCentral AmericanCentral American IndianCherokeeCheyenneChickasawChileanChippewaChoctawColombianComancheCosta RicanCreeCreekCroatianCrowCubanCzechCzechoslovakianDanishDelawareDominicanDutchEastern EuropeanEcuadorianEgyptianEnglishEstonianEthiopianEuropeanFijianFilipinoFinnishFrenchFrench American IndianFrench CanadianGermanGerman RussianGhanaianGreekGuamanian / ChamorroGuatemalanGuyaneseHaitianHonduranHopiHungarianIcelanderIndian (Asian)IndonesianInupiatIranianIraqiIrishIroquoisIsraeliItalianJamaicanJapaneseJordanianKenyanKiowaKoreanLaotianLatvianLebaneseLiberianLithuanianLuxembourgerMacedonianMalaysianMalteseMarshalleseMenomineeMexicanMexican American IndianMongolianMoroccanNative HawaiianNavajoNew ZealanderNicaraguanNigerianNorthern EuropeanNorwegianOkinawanOsagePakistaniPalestinianPanamanianParaguayanPennsylvania GermanPeruvianPimaPolishPortuguesePotawatomiPuebloPuerto RicanRomanianRussianSalvadoranSamoanScandinavianScotch-IrishScottishSeminoleSenegaleseSerbianShoshoneSierra LeoneanSiouxSlavicSlovakSloveneSomaliSouth AfricanSouth AmericanSouth American IndianSpaniardSpanishSpanish AmericanSpanish American IndianSri LankanSubsaharan AfricanSudaneseSwedishSwissSyrianThaiTrinidadian and TobagonianTurkishU.S. Virgin IslanderUgandanUkrainianUruguayanUteVenezuelanVietnameseWelshWest IndianYaquiYugoslavian
Immigrant Origin (Total)
AfghanistanAfricaAlbaniaArgentinaArmeniaAsiaAustraliaAustriaBangladeshBarbadosBelarusBelgiumBoliviaBosnia and HerzegovinaBrazilBulgariaBurma / MyanmarCambodiaCameroonCanadaCaribbeanCentral AmericaChileChinaColombiaCongoCosta RicaCroatiaCubaCzechoslovakiaDenmarkDominican RepublicEastern AfricaEastern AsiaEastern EuropeEcuadorEgyptEl SalvadorEnglandEritreaEthiopiaEuropeFranceGermanyGhanaGreeceGuatemalaHaitiHondurasHong KongHungaryIndiaIndonesiaIranIraqIrelandIsraelItalyJamaicaJapanJordanKazakhstanKenyaKoreaLaosLatin AmericaLatviaLebanonLiberiaLithuaniaMalaysiaMexicoMicronesiaMiddle AfricaMoldovaMoroccoNepalNetherlandsNicaraguaNigeriaNorthern AfricaNorthern EuropeNorwayOceaniaPakistanPanamaPeruPhilippinesPolandPortugalRomaniaRussiaSaudi ArabiaScotlandSenegalSerbiaSingaporeSomaliaSouth AfricaSouth AmericaSouth Central AsiaSouth Eastern AsiaSouthern EuropeSpainSudanSwedenSwitzerlandSyriaTaiwanThailandTrinidad and TobagoTurkeyUgandaUkraineUzbekistanVenezuelaVietnamWestern AfricaWestern AsiaWestern EuropeZaire
Immigrant Origin (Percentage)
AfghanistanAfricaAlbaniaArgentinaArmeniaAsiaAustraliaAustriaBangladeshBarbadosBelarusBelgiumBoliviaBosnia and HerzegovinaBrazilBulgariaBurma / MyanmarCambodiaCameroonCanadaCaribbeanCentral AmericaChileChinaColombiaCongoCosta RicaCroatiaCubaCzechoslovakiaDenmarkDominican RepublicEastern AfricaEastern AsiaEastern EuropeEcuadorEgyptEl SalvadorEnglandEritreaEthiopiaEuropeFranceGermanyGhanaGreeceGuatemalaHaitiHondurasHong KongHungaryIndiaIndonesiaIranIraqIrelandIsraelItalyJamaicaJapanJordanKazakhstanKenyaKoreaLaosLatin AmericaLatviaLebanonLiberiaLithuaniaMalaysiaMexicoMicronesiaMiddle AfricaMoldovaMoroccoNepalNetherlandsNicaraguaNigeriaNorthern AfricaNorthern EuropeNorwayOceaniaPakistanPanamaPeruPhilippinesPolandPortugalRomaniaRussiaSaudi ArabiaScotlandSenegalSerbiaSingaporeSomaliaSouth AfricaSouth AmericaSouth Central AsiaSouth Eastern AsiaSouthern EuropeSpainSudanSwedenSwitzerlandSyriaTaiwanThailandTrinidad and TobagoTurkeyUgandaUkraineUzbekistanVenezuelaVietnamWestern AfricaWestern AsiaWestern EuropeZaire
Income
Income (Families)
Income (Households)
Poverty
Poverty (Families)
Unemployment
Employment Occupations
Employment Industries
Employer Class
Commute Time
Commute Means
School Enrollment
Education by Degree Field
Occupancy
Finances
Physical Characteristics
Denver
Compare Zip Codes
Comparison Subject

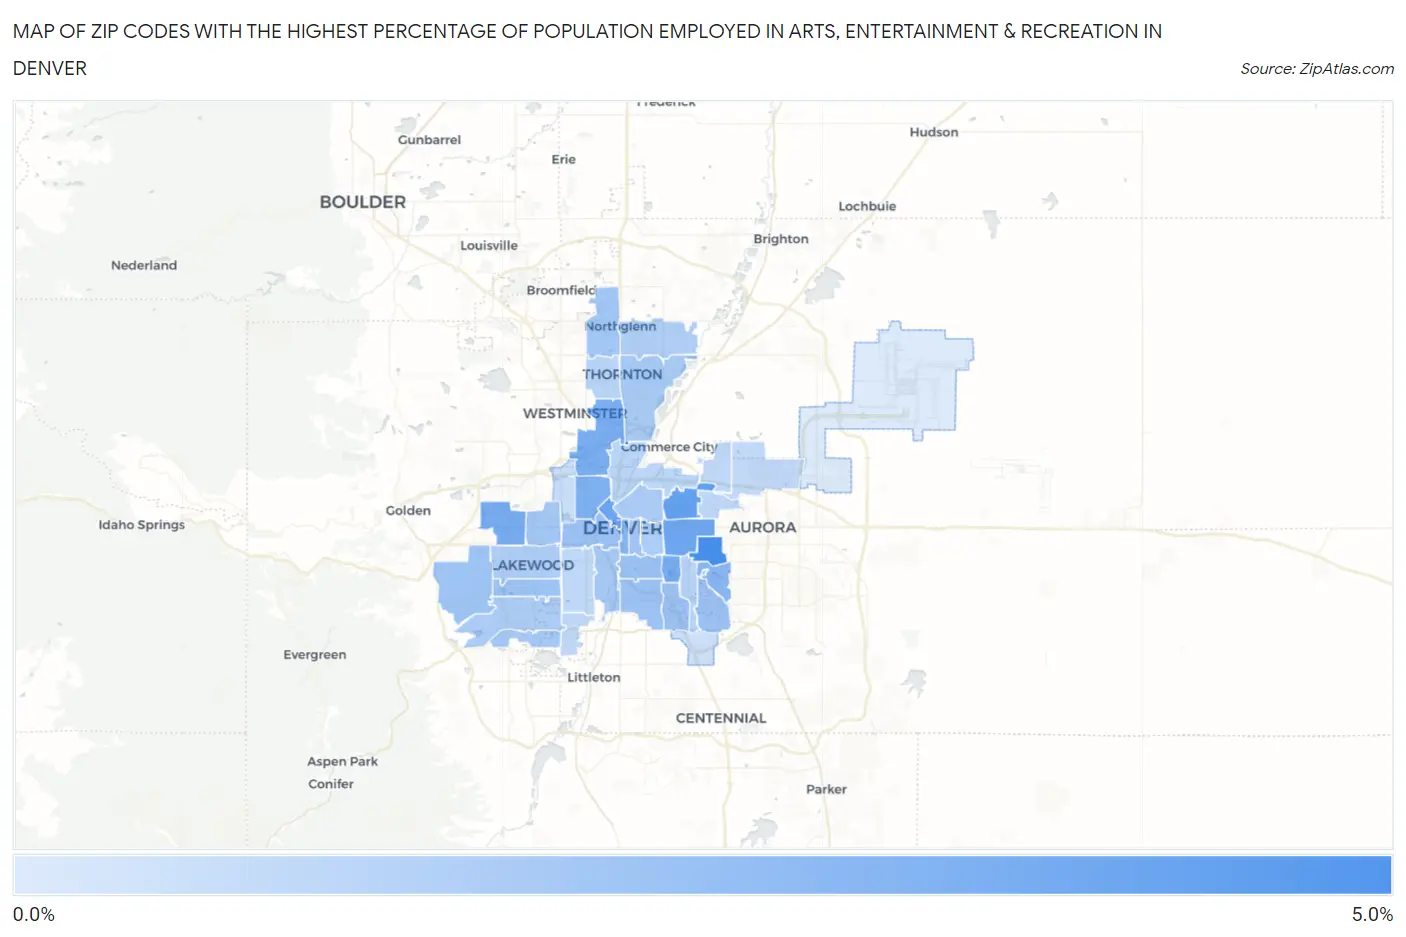
Map of Zip Codes with the Highest Percentage of Population Employed in Arts, Entertainment & Recreation in Denver

0.0%
5.0%
Zip Codes with the Highest Percentage of Population Employed in Arts, Entertainment & Recreation in Denver Map

Zip Codes with the Highest Percentage of Population Employed in Arts, Entertainment & Recreation in Denver, CO

Zip Code % Employed vs State vs National
1.802304.9%2.6%(+2.29)#742.1%(+2.78)#2,389
2.802074.1%2.6%(+1.49)#912.1%(+1.98)#3,257
3.802023.8%2.6%(+1.23)#1002.1%(+1.72)#3,625
4.802203.7%2.6%(+1.18)#1022.1%(+1.66)#3,709
5.802463.5%2.6%(+0.952)#1132.1%(+1.44)#4,073
6.802153.5%2.6%(+0.943)#1142.1%(+1.43)#4,101
7.802213.5%2.6%(+0.891)#1192.1%(+1.38)#4,218
8.802113.3%2.6%(+0.731)#1292.1%(+1.22)#4,560
9.802033.1%2.6%(+0.555)#1422.1%(+1.04)#4,993
10.802473.0%2.6%(+0.414)#1482.1%(+0.902)#5,402
11.802222.5%2.6%(-0.067)#1812.1%(+0.421)#7,153
12.802102.5%2.6%(-0.083)#1842.1%(+0.405)#7,230
13.802042.5%2.6%(-0.099)#1862.1%(+0.390)#7,300
14.802312.5%2.6%(-0.100)#1872.1%(+0.388)#7,306
15.802092.5%2.6%(-0.106)#1882.1%(+0.383)#7,327
16.802182.4%2.6%(-0.127)#1922.1%(+0.362)#7,445
17.802282.4%2.6%(-0.147)#1952.1%(+0.341)#7,538
18.802322.4%2.6%(-0.154)#1972.1%(+0.334)#7,565
19.802142.3%2.6%(-0.295)#2072.1%(+0.194)#8,241
20.802342.3%2.6%(-0.305)#2082.1%(+0.183)#8,297
21.802232.3%2.6%(-0.316)#2092.1%(+0.172)#8,364
22.802352.2%2.6%(-0.329)#2112.1%(+0.159)#8,416
23.802292.1%2.6%(-0.424)#2252.1%(+0.065)#8,942
24.802052.1%2.6%(-0.449)#2272.1%(+0.039)#9,093
25.802062.1%2.6%(-0.506)#2322.1%(-0.018)#9,402
26.802272.0%2.6%(-0.559)#2382.1%(-0.070)#9,698
27.802332.0%2.6%(-0.574)#2412.1%(-0.086)#9,798
28.802262.0%2.6%(-0.598)#2432.1%(-0.110)#9,935
29.802241.7%2.6%(-0.821)#2612.1%(-0.333)#11,374
30.802161.7%2.6%(-0.903)#2692.1%(-0.415)#11,959
31.802601.7%2.6%(-0.913)#2722.1%(-0.424)#12,031
32.802191.6%2.6%(-1.00)#2812.1%(-0.513)#12,711
33.802381.5%2.6%(-1.05)#2862.1%(-0.559)#13,076
34.802361.5%2.6%(-1.09)#2882.1%(-0.606)#13,402
35.802391.5%2.6%(-1.11)#2902.1%(-0.622)#13,517
36.802121.3%2.6%(-1.30)#3022.1%(-0.815)#14,963
37.802371.2%2.6%(-1.40)#3112.1%(-0.911)#15,687
38.802490.72%2.6%(-1.85)#3472.1%(-1.36)#18,963

Common Questions

What are the Top 10 Zip Codes with the Highest Percentage of Population Employed in Arts, Entertainment & Recreation in Denver, CO?
Top 10 Zip Codes with the Highest Percentage of Population Employed in Arts, Entertainment & Recreation in Denver, CO are:
#1
4.9%
#2
4.1%
#3
3.8%
#4
3.7%
#5
3.5%
#6
3.5%
#7
3.5%
#8
3.3%
#9
3.1%
#10
3.0%
What zip code has the Highest Percentage of Population Employed in Arts, Entertainment & Recreation in Denver, CO?
80230 has the Highest Percentage of Population Employed in Arts, Entertainment & Recreation in Denver, CO with 4.9%.
What is the Percentage of Population Employed in Arts, Entertainment & Recreation in Denver, CO?
Percentage of Population Employed in Arts, Entertainment & Recreation in Denver is 2.4%.
What is the Percentage of Population Employed in Arts, Entertainment & Recreation in Colorado?
Percentage of Population Employed in Arts, Entertainment & Recreation in Colorado is 2.6%.
What is the Percentage of Population Employed in Arts, Entertainment & Recreation in the United States?
Percentage of Population Employed in Arts, Entertainment & Recreation in the United States is 2.1%.