Zip Codes with the Highest Percentage of Population Employed in Agriculture, Fishing & Hunting in Denver, CO
RELATED REPORTS & OPTIONS
Agriculture, Fishing & Hunting
Denver
Compare Zip Codes
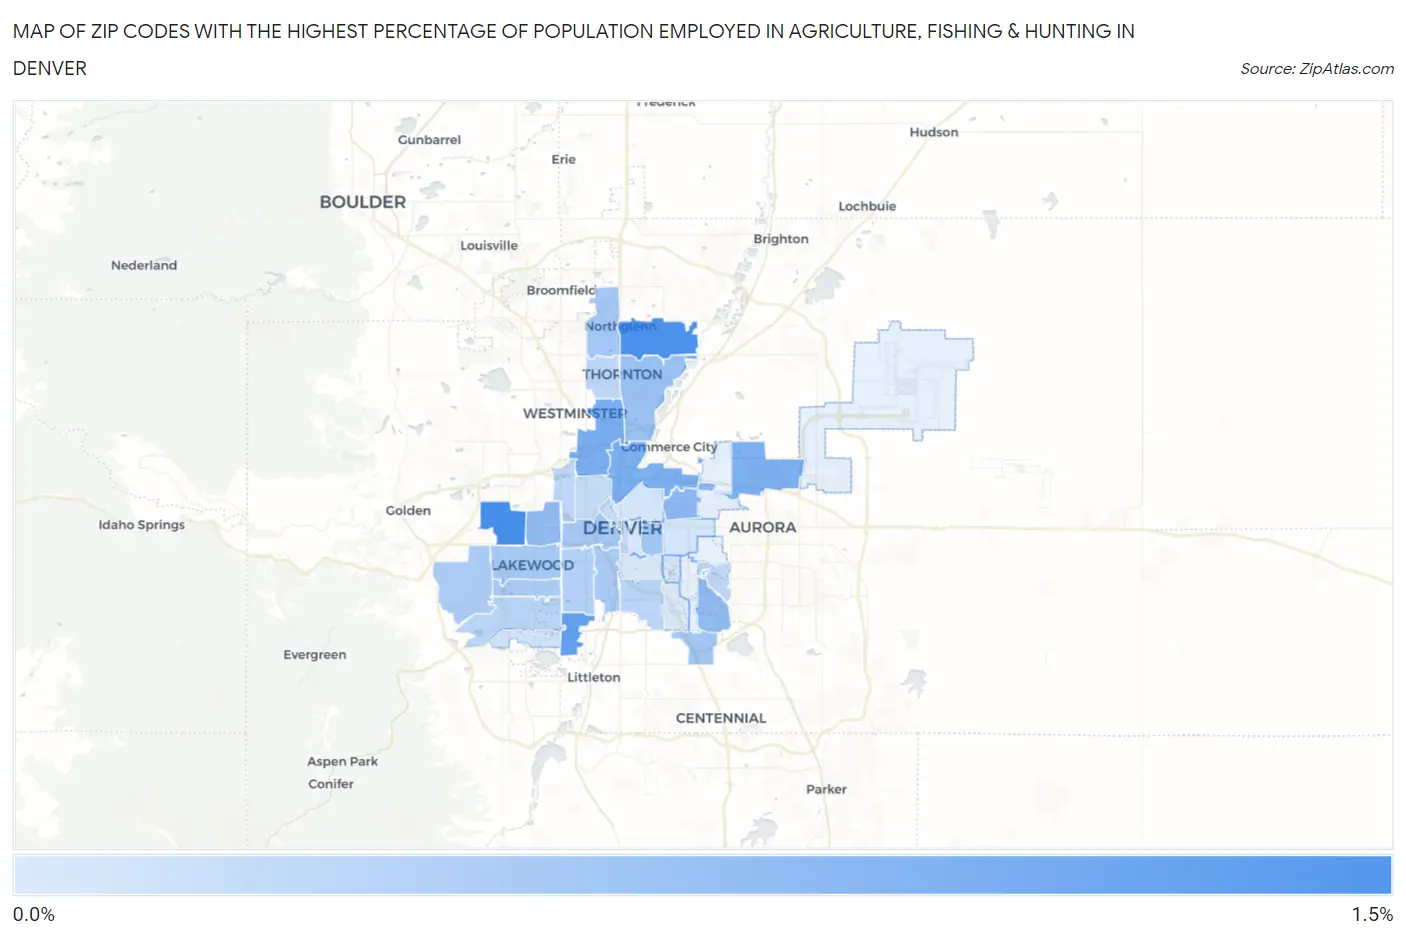
Map of Zip Codes with the Highest Percentage of Population Employed in Agriculture, Fishing & Hunting in Denver
0.049%
1.2%
Zip Codes with the Highest Percentage of Population Employed in Agriculture, Fishing & Hunting in Denver, CO
| Zip Code | % Employed | vs State | vs National | |
| 1. | 80215 | 1.2% | 1.1%(+0.068)#265 | 1.2%(+0.016)#15,335 |
| 2. | 80233 | 1.2% | 1.1%(+0.026)#268 | 1.2%(-0.026)#15,503 |
| 3. | 80236 | 0.99% | 1.1%(-0.155)#283 | 1.2%(-0.207)#16,260 |
| 4. | 80221 | 0.82% | 1.1%(-0.329)#295 | 1.2%(-0.381)#17,146 |
| 5. | 80216 | 0.80% | 1.1%(-0.349)#296 | 1.2%(-0.401)#17,247 |
| 6. | 80239 | 0.78% | 1.1%(-0.369)#301 | 1.2%(-0.421)#17,370 |
| 7. | 80207 | 0.68% | 1.1%(-0.471)#310 | 1.2%(-0.523)#17,979 |
| 8. | 80214 | 0.64% | 1.1%(-0.510)#314 | 1.2%(-0.561)#18,214 |
| 9. | 80231 | 0.64% | 1.1%(-0.512)#315 | 1.2%(-0.563)#18,229 |
| 10. | 80229 | 0.55% | 1.1%(-0.597)#326 | 1.2%(-0.649)#18,838 |
| 11. | 80237 | 0.50% | 1.1%(-0.650)#330 | 1.2%(-0.702)#19,303 |
| 12. | 80206 | 0.50% | 1.1%(-0.651)#331 | 1.2%(-0.703)#19,318 |
| 13. | 80234 | 0.49% | 1.1%(-0.661)#335 | 1.2%(-0.713)#19,391 |
| 14. | 80204 | 0.48% | 1.1%(-0.671)#339 | 1.2%(-0.723)#19,481 |
| 15. | 80226 | 0.47% | 1.1%(-0.681)#341 | 1.2%(-0.732)#19,561 |
| 16. | 80223 | 0.44% | 1.1%(-0.705)#344 | 1.2%(-0.757)#19,775 |
| 17. | 80228 | 0.43% | 1.1%(-0.714)#347 | 1.2%(-0.766)#19,863 |
| 18. | 80232 | 0.43% | 1.1%(-0.717)#348 | 1.2%(-0.768)#19,889 |
| 19. | 80219 | 0.37% | 1.1%(-0.774)#355 | 1.2%(-0.825)#20,397 |
| 20. | 80227 | 0.32% | 1.1%(-0.826)#370 | 1.2%(-0.878)#20,931 |
| 21. | 80210 | 0.31% | 1.1%(-0.834)#371 | 1.2%(-0.886)#21,029 |
| 22. | 80260 | 0.28% | 1.1%(-0.865)#381 | 1.2%(-0.917)#21,388 |
| 23. | 80212 | 0.27% | 1.1%(-0.873)#383 | 1.2%(-0.924)#21,473 |
| 24. | 80247 | 0.27% | 1.1%(-0.880)#389 | 1.2%(-0.932)#21,572 |
| 25. | 80203 | 0.26% | 1.1%(-0.883)#390 | 1.2%(-0.935)#21,595 |
| 26. | 80202 | 0.24% | 1.1%(-0.907)#397 | 1.2%(-0.959)#21,875 |
| 27. | 80211 | 0.22% | 1.1%(-0.927)#400 | 1.2%(-0.978)#22,093 |
| 28. | 80235 | 0.14% | 1.1%(-1.01)#407 | 1.2%(-1.06)#23,140 |
| 29. | 80205 | 0.12% | 1.1%(-1.03)#411 | 1.2%(-1.08)#23,449 |
| 30. | 80220 | 0.11% | 1.1%(-1.03)#413 | 1.2%(-1.09)#23,505 |
| 31. | 80246 | 0.092% | 1.1%(-1.06)#418 | 1.2%(-1.11)#23,785 |
| 32. | 80218 | 0.086% | 1.1%(-1.06)#419 | 1.2%(-1.11)#23,875 |
| 33. | 80209 | 0.057% | 1.1%(-1.09)#422 | 1.2%(-1.14)#24,260 |
| 34. | 80222 | 0.049% | 1.1%(-1.10)#424 | 1.2%(-1.15)#24,358 |
1
Common Questions
What are the Top 10 Zip Codes with the Highest Percentage of Population Employed in Agriculture, Fishing & Hunting in Denver, CO?
Top 10 Zip Codes with the Highest Percentage of Population Employed in Agriculture, Fishing & Hunting in Denver, CO are:
What zip code has the Highest Percentage of Population Employed in Agriculture, Fishing & Hunting in Denver, CO?
80215 has the Highest Percentage of Population Employed in Agriculture, Fishing & Hunting in Denver, CO with 1.2%.
What is the Percentage of Population Employed in Agriculture, Fishing & Hunting in Denver, CO?
Percentage of Population Employed in Agriculture, Fishing & Hunting in Denver is 0.29%.
What is the Percentage of Population Employed in Agriculture, Fishing & Hunting in Colorado?
Percentage of Population Employed in Agriculture, Fishing & Hunting in Colorado is 1.1%.
What is the Percentage of Population Employed in Agriculture, Fishing & Hunting in the United States?
Percentage of Population Employed in Agriculture, Fishing & Hunting in the United States is 1.2%.