Zip Codes with the Highest Percentage of Households with Income Above $200,000 in Golden, CO
RELATED REPORTS & OPTIONS
Household Income | $200k+
Golden
Compare Zip Codes
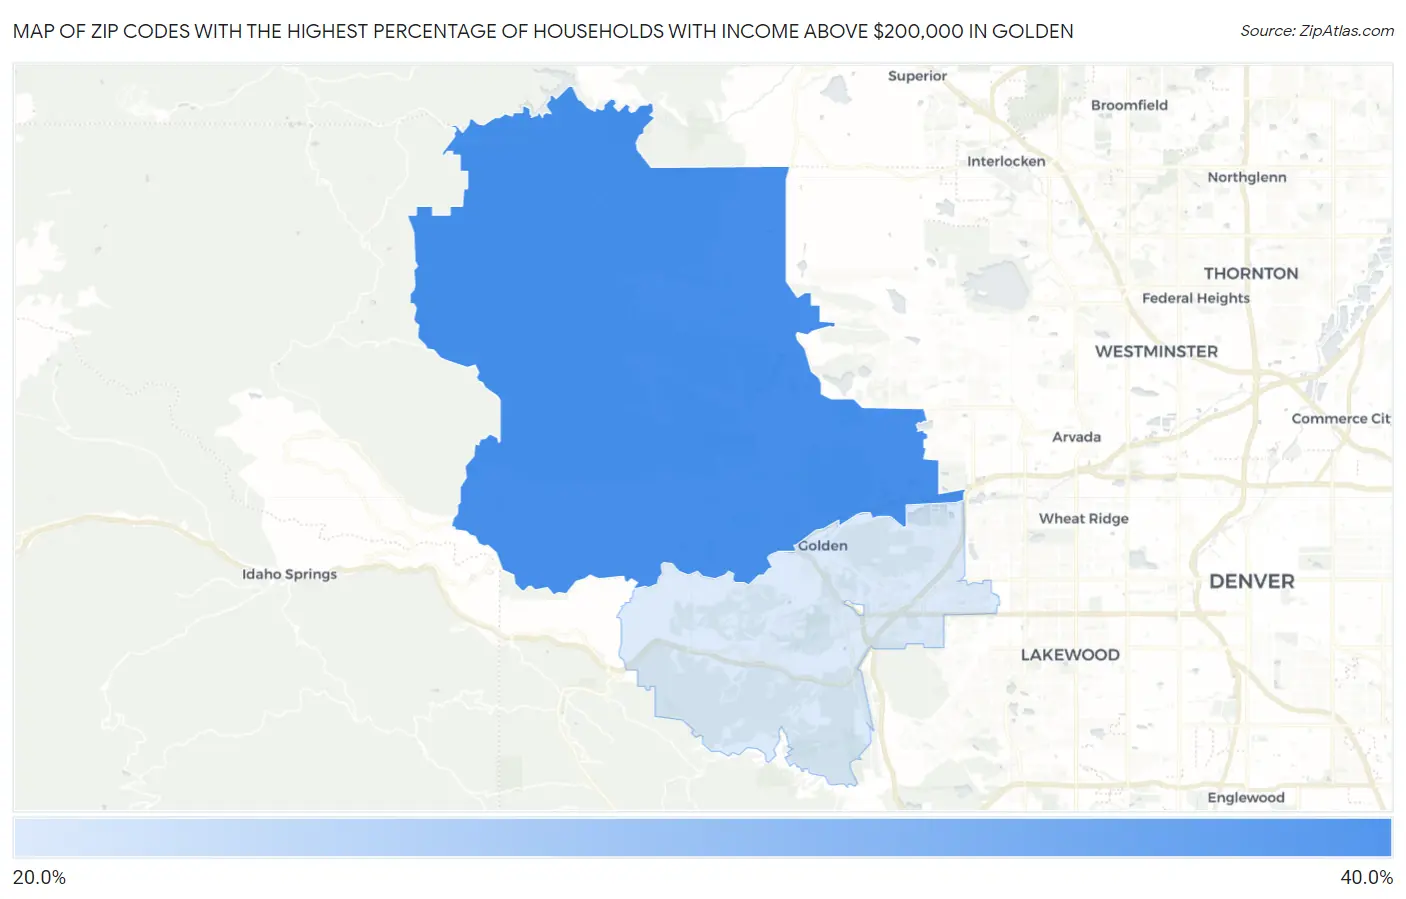
Map of Zip Codes with the Highest Percentage of Households with Income Above $200,000 in Golden
22.0%
32.2%
Zip Codes with the Highest Percentage of Households with Income Above $200,000 in Golden, CO
| Zip Code | Households with Income > $200k | vs State | vs National | |
| 1. | 80403 | 32.2% | 13.9%(+18.3)#21 | 11.4%(+20.8)#1,232 |
| 2. | 80401 | 22.0% | 13.9%(+8.10)#68 | 11.4%(+10.6)#2,768 |
1
Common Questions
What are the Top Zip Codes with the Highest Percentage of Households with Income Above $200,000 in Golden, CO?
Top Zip Codes with the Highest Percentage of Households with Income Above $200,000 in Golden, CO are:
What zip code has the Highest Percentage of Households with Income Above $200,000 in Golden, CO?
80403 has the Highest Percentage of Households with Income Above $200,000 in Golden, CO with 32.2%.
What is the Percentage of Households with Income Above $200,000 in Golden, CO?
Percentage of Households with Income Above $200,000 in Golden is 19.5%.
What is the Percentage of Households with Income Above $200,000 in Colorado?
Percentage of Households with Income Above $200,000 in Colorado is 13.9%.
What is the Percentage of Households with Income Above $200,000 in the United States?
Percentage of Households with Income Above $200,000 in the United States is 11.4%.