Zip Codes with the Highest Percentage of Population Employed in Health Care & Social Assistance in Denver, CO
RELATED REPORTS & OPTIONS
Health Care & Social Assistance
Denver
Compare Zip Codes
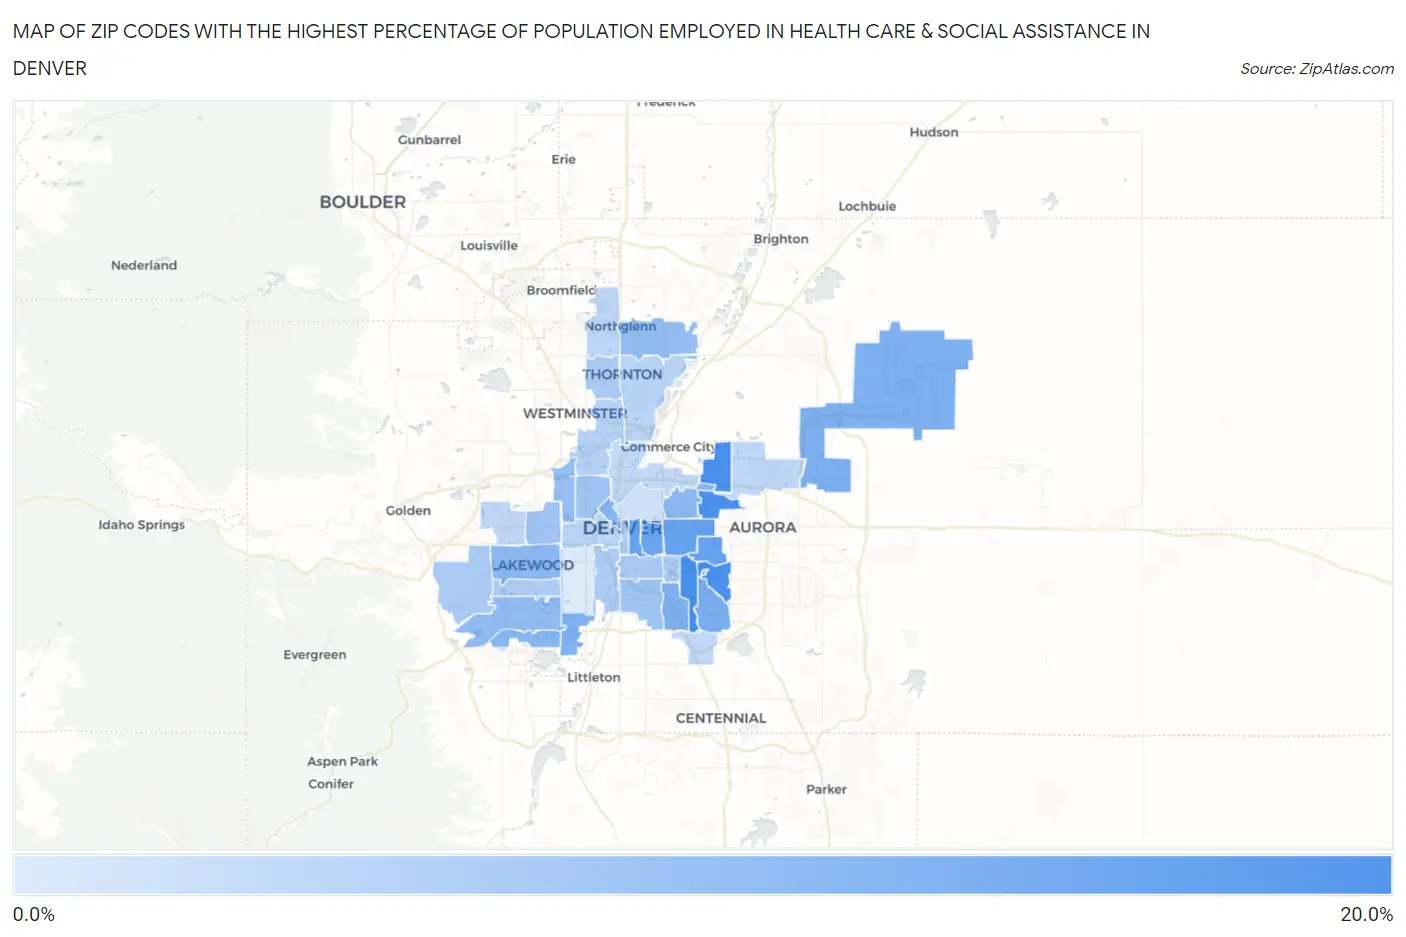
Map of Zip Codes with the Highest Percentage of Population Employed in Health Care & Social Assistance in Denver
8.1%
18.1%
Zip Codes with the Highest Percentage of Population Employed in Health Care & Social Assistance in Denver, CO
| Zip Code | % Employed | vs State | vs National | |
| 1. | 80224 | 18.1% | 12.5%(+5.63)#58 | 13.9%(+4.15)#6,065 |
| 2. | 80238 | 17.9% | 12.5%(+5.46)#61 | 13.9%(+3.98)#6,305 |
| 3. | 80247 | 17.9% | 12.5%(+5.43)#63 | 13.9%(+3.94)#6,349 |
| 4. | 80220 | 16.0% | 12.5%(+3.56)#86 | 13.9%(+2.08)#9,467 |
| 5. | 80230 | 16.0% | 12.5%(+3.56)#87 | 13.9%(+2.08)#9,470 |
| 6. | 80218 | 15.9% | 12.5%(+3.45)#89 | 13.9%(+1.97)#9,697 |
| 7. | 80206 | 15.6% | 12.5%(+3.14)#95 | 13.9%(+1.66)#10,311 |
| 8. | 80231 | 14.4% | 12.5%(+1.95)#116 | 13.9%(+0.467)#13,085 |
| 9. | 80249 | 14.3% | 12.5%(+1.85)#123 | 13.9%(+0.367)#13,325 |
| 10. | 80236 | 14.2% | 12.5%(+1.71)#125 | 13.9%(+0.230)#13,659 |
| 11. | 80222 | 14.1% | 12.5%(+1.61)#132 | 13.9%(+0.130)#13,908 |
| 12. | 80202 | 13.9% | 12.5%(+1.41)#139 | 13.9%(-0.074)#14,408 |
| 13. | 80235 | 13.7% | 12.5%(+1.24)#143 | 13.9%(-0.244)#14,805 |
| 14. | 80207 | 13.4% | 12.5%(+0.957)#150 | 13.9%(-0.527)#15,524 |
| 15. | 80226 | 13.3% | 12.5%(+0.891)#156 | 13.9%(-0.593)#15,677 |
| 16. | 80227 | 13.0% | 12.5%(+0.581)#167 | 13.9%(-0.903)#16,506 |
| 17. | 80290 | 13.0% | 12.5%(+0.566)#168 | 13.9%(-0.918)#16,541 |
| 18. | 80233 | 12.8% | 12.5%(+0.391)#172 | 13.9%(-1.09)#16,974 |
| 19. | 80212 | 12.6% | 12.5%(+0.100)#188 | 13.9%(-1.38)#17,709 |
| 20. | 80211 | 12.2% | 12.5%(-0.257)#207 | 13.9%(-1.74)#18,602 |
| 21. | 80210 | 12.2% | 12.5%(-0.300)#210 | 13.9%(-1.78)#18,685 |
| 22. | 80214 | 12.0% | 12.5%(-0.489)#216 | 13.9%(-1.97)#19,091 |
| 23. | 80209 | 11.4% | 12.5%(-1.10)#236 | 13.9%(-2.58)#20,549 |
| 24. | 80228 | 11.3% | 12.5%(-1.11)#237 | 13.9%(-2.59)#20,572 |
| 25. | 80260 | 11.2% | 12.5%(-1.22)#245 | 13.9%(-2.70)#20,835 |
| 26. | 80203 | 11.2% | 12.5%(-1.22)#246 | 13.9%(-2.71)#20,839 |
| 27. | 80223 | 11.2% | 12.5%(-1.24)#247 | 13.9%(-2.72)#20,872 |
| 28. | 80246 | 11.2% | 12.5%(-1.30)#250 | 13.9%(-2.78)#21,009 |
| 29. | 80232 | 11.1% | 12.5%(-1.35)#251 | 13.9%(-2.84)#21,145 |
| 30. | 80221 | 10.7% | 12.5%(-1.80)#275 | 13.9%(-3.29)#22,129 |
| 31. | 80229 | 10.2% | 12.5%(-2.20)#291 | 13.9%(-3.69)#22,939 |
| 32. | 80204 | 10.2% | 12.5%(-2.22)#292 | 13.9%(-3.70)#22,963 |
| 33. | 80234 | 10.1% | 12.5%(-2.31)#296 | 13.9%(-3.79)#23,150 |
| 34. | 80239 | 9.9% | 12.5%(-2.51)#306 | 13.9%(-4.00)#23,543 |
| 35. | 80237 | 9.9% | 12.5%(-2.56)#309 | 13.9%(-4.04)#23,634 |
| 36. | 80216 | 9.8% | 12.5%(-2.64)#314 | 13.9%(-4.12)#23,776 |
| 37. | 80215 | 9.8% | 12.5%(-2.65)#315 | 13.9%(-4.13)#23,800 |
| 38. | 80205 | 9.0% | 12.5%(-3.49)#343 | 13.9%(-4.98)#25,221 |
| 39. | 80219 | 8.1% | 12.5%(-4.38)#367 | 13.9%(-5.87)#26,414 |
1
Common Questions
What are the Top 10 Zip Codes with the Highest Percentage of Population Employed in Health Care & Social Assistance in Denver, CO?
Top 10 Zip Codes with the Highest Percentage of Population Employed in Health Care & Social Assistance in Denver, CO are:
What zip code has the Highest Percentage of Population Employed in Health Care & Social Assistance in Denver, CO?
80224 has the Highest Percentage of Population Employed in Health Care & Social Assistance in Denver, CO with 18.1%.
What is the Percentage of Population Employed in Health Care & Social Assistance in Denver, CO?
Percentage of Population Employed in Health Care & Social Assistance in Denver is 12.6%.
What is the Percentage of Population Employed in Health Care & Social Assistance in Colorado?
Percentage of Population Employed in Health Care & Social Assistance in Colorado is 12.5%.
What is the Percentage of Population Employed in Health Care & Social Assistance in the United States?
Percentage of Population Employed in Health Care & Social Assistance in the United States is 13.9%.