Zip Codes with the Lowest Poverty Level Among Children Under the Age of 5 in Denver, CO

RELATED REPORTS & OPTIONS

Lowest Poverty | Child 0-5
Population
Families and Households
Female Fertility
Female Fertility (Unmarried)
Race (Community Size)
Race (Percentage)
Ancestry (Community Size)
AfghanAfricanAlaska NativeAlbanianAlsatianAmericanApacheArabArapahoArgentineanArmenianAssyrian / Chaldean / SyriacAustralianAustrianBahamianBangladeshiBarbadianBasqueBelgianBhutaneseBlackfeetBolivianBrazilianBritishBritish West IndianBulgarianBurmeseCajunCambodianCanadianCape VerdeanCelticCentral AmericanCentral American IndianCherokeeCheyenneChickasawChileanChippewaChoctawColombianComancheCosta RicanCreeCreekCroatianCrowCubanCzechCzechoslovakianDanishDelawareDominicanDutchEastern EuropeanEcuadorianEgyptianEnglishEstonianEthiopianEuropeanFijianFilipinoFinnishFrenchFrench American IndianFrench CanadianGermanGerman RussianGhanaianGreekGuamanian / ChamorroGuatemalanGuyaneseHaitianHonduranHopiHungarianIcelanderIndian (Asian)IndonesianInupiatIranianIraqiIrishIroquoisIsraeliItalianJamaicanJapaneseJordanianKenyanKiowaKoreanLaotianLatvianLebaneseLiberianLithuanianLuxembourgerMacedonianMalaysianMalteseMarshalleseMenomineeMexicanMexican American IndianMongolianMoroccanNative HawaiianNavajoNew ZealanderNicaraguanNigerianNorthern EuropeanNorwegianOkinawanOsagePakistaniPalestinianPanamanianParaguayanPennsylvania GermanPeruvianPimaPolishPortuguesePotawatomiPuebloPuerto RicanRomanianRussianSalvadoranSamoanScandinavianScotch-IrishScottishSeminoleSenegaleseSerbianShoshoneSierra LeoneanSiouxSlavicSlovakSloveneSomaliSouth AfricanSouth AmericanSouth American IndianSpaniardSpanishSpanish AmericanSpanish American IndianSri LankanSubsaharan AfricanSudaneseSwedishSwissSyrianThaiTrinidadian and TobagonianTurkishU.S. Virgin IslanderUgandanUkrainianUruguayanUteVenezuelanVietnameseWelshWest IndianYaquiYugoslavian
Ancestry (Percentage)
AfghanAfricanAlaska NativeAlbanianAlsatianAmericanApacheArabArapahoArgentineanArmenianAssyrian / Chaldean / SyriacAustralianAustrianBahamianBangladeshiBarbadianBasqueBelgianBhutaneseBlackfeetBolivianBrazilianBritishBritish West IndianBulgarianBurmeseCajunCambodianCanadianCape VerdeanCelticCentral AmericanCentral American IndianCherokeeCheyenneChickasawChileanChippewaChoctawColombianComancheCosta RicanCreeCreekCroatianCrowCubanCzechCzechoslovakianDanishDelawareDominicanDutchEastern EuropeanEcuadorianEgyptianEnglishEstonianEthiopianEuropeanFijianFilipinoFinnishFrenchFrench American IndianFrench CanadianGermanGerman RussianGhanaianGreekGuamanian / ChamorroGuatemalanGuyaneseHaitianHonduranHopiHungarianIcelanderIndian (Asian)IndonesianInupiatIranianIraqiIrishIroquoisIsraeliItalianJamaicanJapaneseJordanianKenyanKiowaKoreanLaotianLatvianLebaneseLiberianLithuanianLuxembourgerMacedonianMalaysianMalteseMarshalleseMenomineeMexicanMexican American IndianMongolianMoroccanNative HawaiianNavajoNew ZealanderNicaraguanNigerianNorthern EuropeanNorwegianOkinawanOsagePakistaniPalestinianPanamanianParaguayanPennsylvania GermanPeruvianPimaPolishPortuguesePotawatomiPuebloPuerto RicanRomanianRussianSalvadoranSamoanScandinavianScotch-IrishScottishSeminoleSenegaleseSerbianShoshoneSierra LeoneanSiouxSlavicSlovakSloveneSomaliSouth AfricanSouth AmericanSouth American IndianSpaniardSpanishSpanish AmericanSpanish American IndianSri LankanSubsaharan AfricanSudaneseSwedishSwissSyrianThaiTrinidadian and TobagonianTurkishU.S. Virgin IslanderUgandanUkrainianUruguayanUteVenezuelanVietnameseWelshWest IndianYaquiYugoslavian
Immigrant Origin (Total)
AfghanistanAfricaAlbaniaArgentinaArmeniaAsiaAustraliaAustriaBangladeshBarbadosBelarusBelgiumBoliviaBosnia and HerzegovinaBrazilBulgariaBurma / MyanmarCambodiaCameroonCanadaCaribbeanCentral AmericaChileChinaColombiaCongoCosta RicaCroatiaCubaCzechoslovakiaDenmarkDominican RepublicEastern AfricaEastern AsiaEastern EuropeEcuadorEgyptEl SalvadorEnglandEritreaEthiopiaEuropeFranceGermanyGhanaGreeceGuatemalaHaitiHondurasHong KongHungaryIndiaIndonesiaIranIraqIrelandIsraelItalyJamaicaJapanJordanKazakhstanKenyaKoreaLaosLatin AmericaLatviaLebanonLiberiaLithuaniaMalaysiaMexicoMicronesiaMiddle AfricaMoldovaMoroccoNepalNetherlandsNicaraguaNigeriaNorthern AfricaNorthern EuropeNorwayOceaniaPakistanPanamaPeruPhilippinesPolandPortugalRomaniaRussiaSaudi ArabiaScotlandSenegalSerbiaSingaporeSomaliaSouth AfricaSouth AmericaSouth Central AsiaSouth Eastern AsiaSouthern EuropeSpainSudanSwedenSwitzerlandSyriaTaiwanThailandTrinidad and TobagoTurkeyUgandaUkraineUzbekistanVenezuelaVietnamWestern AfricaWestern AsiaWestern EuropeZaire
Immigrant Origin (Percentage)
AfghanistanAfricaAlbaniaArgentinaArmeniaAsiaAustraliaAustriaBangladeshBarbadosBelarusBelgiumBoliviaBosnia and HerzegovinaBrazilBulgariaBurma / MyanmarCambodiaCameroonCanadaCaribbeanCentral AmericaChileChinaColombiaCongoCosta RicaCroatiaCubaCzechoslovakiaDenmarkDominican RepublicEastern AfricaEastern AsiaEastern EuropeEcuadorEgyptEl SalvadorEnglandEritreaEthiopiaEuropeFranceGermanyGhanaGreeceGuatemalaHaitiHondurasHong KongHungaryIndiaIndonesiaIranIraqIrelandIsraelItalyJamaicaJapanJordanKazakhstanKenyaKoreaLaosLatin AmericaLatviaLebanonLiberiaLithuaniaMalaysiaMexicoMicronesiaMiddle AfricaMoldovaMoroccoNepalNetherlandsNicaraguaNigeriaNorthern AfricaNorthern EuropeNorwayOceaniaPakistanPanamaPeruPhilippinesPolandPortugalRomaniaRussiaSaudi ArabiaScotlandSenegalSerbiaSingaporeSomaliaSouth AfricaSouth AmericaSouth Central AsiaSouth Eastern AsiaSouthern EuropeSpainSudanSwedenSwitzerlandSyriaTaiwanThailandTrinidad and TobagoTurkeyUgandaUkraineUzbekistanVenezuelaVietnamWestern AfricaWestern AsiaWestern EuropeZaire
Income
Income (Families)
Income (Households)
Poverty
Poverty (Families)
Unemployment
Employment Occupations
Employment Industries
Employer Class
Commute Time
Commute Means
School Enrollment
Education by Degree Field
Occupancy
Finances
Physical Characteristics
Denver
Compare Zip Codes
Comparison Subject

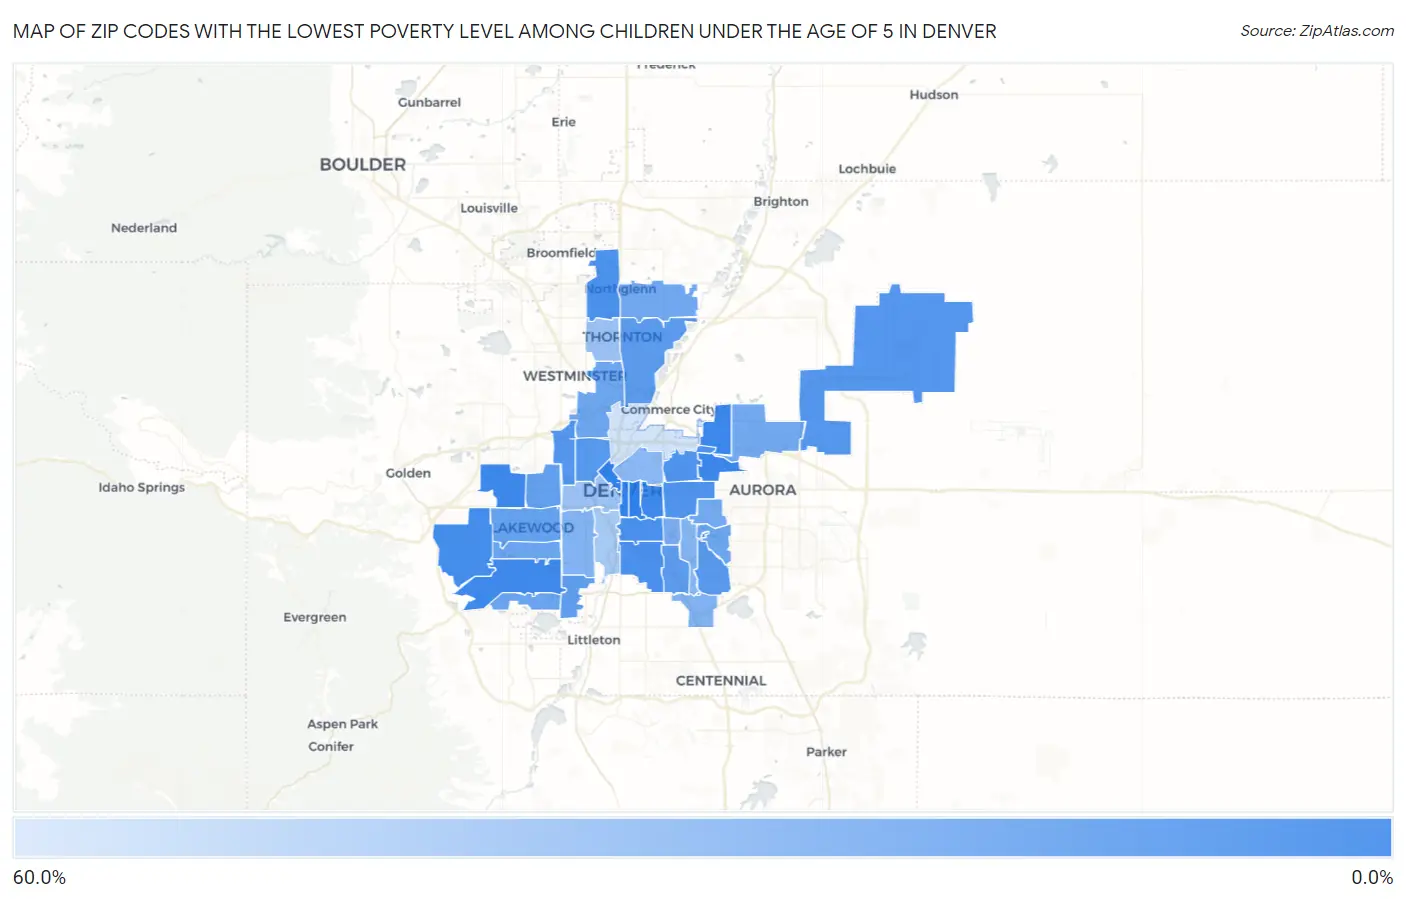
Map of Zip Codes with the Lowest Poverty Level Among Children Under the Age of 5 in Denver

60.0%
0.0%
Zip Codes with the Lowest Poverty Level Among Children Under the Age of 5 in Denver Map

Zip Codes with the Lowest Poverty Level Among Children Under the Age of 5 in Denver, CO

Zip Code Child Poverty vs State vs National
1.802380.44%11.9%(-11.4)#318.1%(-17.6)#44
2.802061.0%11.9%(-10.8)#1118.1%(-17.0)#299
3.802151.0%11.9%(-10.8)#1218.1%(-17.0)#301
4.802272.0%11.9%(-9.87)#2118.1%(-16.1)#834
5.802283.2%11.9%(-8.65)#3318.1%(-14.8)#1,664
6.802104.1%11.9%(-7.79)#4318.1%(-14.0)#2,235
7.802094.4%11.9%(-7.49)#4518.1%(-13.7)#2,478
8.802345.4%11.9%(-6.52)#5518.1%(-12.7)#3,132
9.802075.5%11.9%(-6.36)#5918.1%(-12.5)#3,252
10.802206.4%11.9%(-5.44)#7118.1%(-11.6)#3,899
11.802497.8%11.9%(-4.11)#8318.1%(-10.3)#4,777
12.802128.1%11.9%(-3.79)#8818.1%(-9.98)#4,972
13.802118.6%11.9%(-3.29)#9518.1%(-9.47)#5,320
14.802319.5%11.9%(-2.36)#10418.1%(-8.55)#5,954
15.8022910.0%11.9%(-1.83)#11418.1%(-8.02)#6,298
16.8022210.5%11.9%(-1.38)#11618.1%(-7.56)#6,554
17.8023611.6%11.9%(-0.241)#12818.1%(-6.42)#7,227
18.8021412.3%11.9%(+0.461)#13218.1%(-5.72)#7,657
19.8022613.1%11.9%(+1.26)#14318.1%(-4.93)#8,122
20.8023214.8%11.9%(+2.95)#15218.1%(-3.23)#9,112
21.8023514.9%11.9%(+3.05)#15418.1%(-3.13)#9,166
22.8024715.8%11.9%(+3.88)#15818.1%(-2.30)#9,625
23.8022115.9%11.9%(+4.05)#16018.1%(-2.14)#9,721
24.8023316.2%11.9%(+4.36)#16318.1%(-1.82)#9,878
25.8023917.0%11.9%(+5.16)#16518.1%(-1.02)#10,262
26.8023017.5%11.9%(+5.59)#16918.1%(-0.599)#10,463
27.8024620.2%11.9%(+8.31)#18618.1%(+2.13)#11,724
28.8023721.8%11.9%(+9.93)#20118.1%(+3.74)#12,408
29.8021922.2%11.9%(+10.3)#20518.1%(+4.15)#12,560
30.8022423.2%11.9%(+11.4)#21018.1%(+5.18)#13,006
31.8020524.7%11.9%(+12.8)#21318.1%(+6.61)#13,547
32.8026031.3%11.9%(+19.4)#23618.1%(+13.2)#15,674
33.8020431.6%11.9%(+19.7)#23918.1%(+13.5)#15,731
34.8022335.7%11.9%(+23.9)#24518.1%(+17.7)#16,794
35.8021652.7%11.9%(+40.8)#26618.1%(+34.6)#19,391

Common Questions

What are the Top 10 Zip Codes with the Lowest Poverty Level Among Children Under the Age of 5 in Denver, CO?
Top 10 Zip Codes with the Lowest Poverty Level Among Children Under the Age of 5 in Denver, CO are:
#1
0.0%
#2
0.0%
#3
0.0%
#4
0.44%
#5
1.0%
#6
1.0%
#7
2.0%
#8
3.2%
#9
4.1%
#10
4.4%
What zip code has the Lowest Poverty Level Among Children Under the Age of 5 in Denver, CO?
80238 has the Lowest Poverty Level Among Children Under the Age of 5 in Denver, CO with 0.44%.
What is the Poverty Level Among Children Under the Age of 5 in Denver, CO?
Poverty Level Among Children Under the Age of 5 in Denver is 14.9%.
What is the Poverty Level Among Children Under the Age of 5 in Colorado?
Poverty Level Among Children Under the Age of 5 in Colorado is 11.9%.
What is the Poverty Level Among Children Under the Age of 5 in the United States?
Poverty Level Among Children Under the Age of 5 in the United States is 18.1%.