Zip Codes with the Highest Percentage of Population Employed in Accommodation & Food Services in Denver, CO
RELATED REPORTS & OPTIONS
Accommodation & Food Services
Denver
Compare Zip Codes
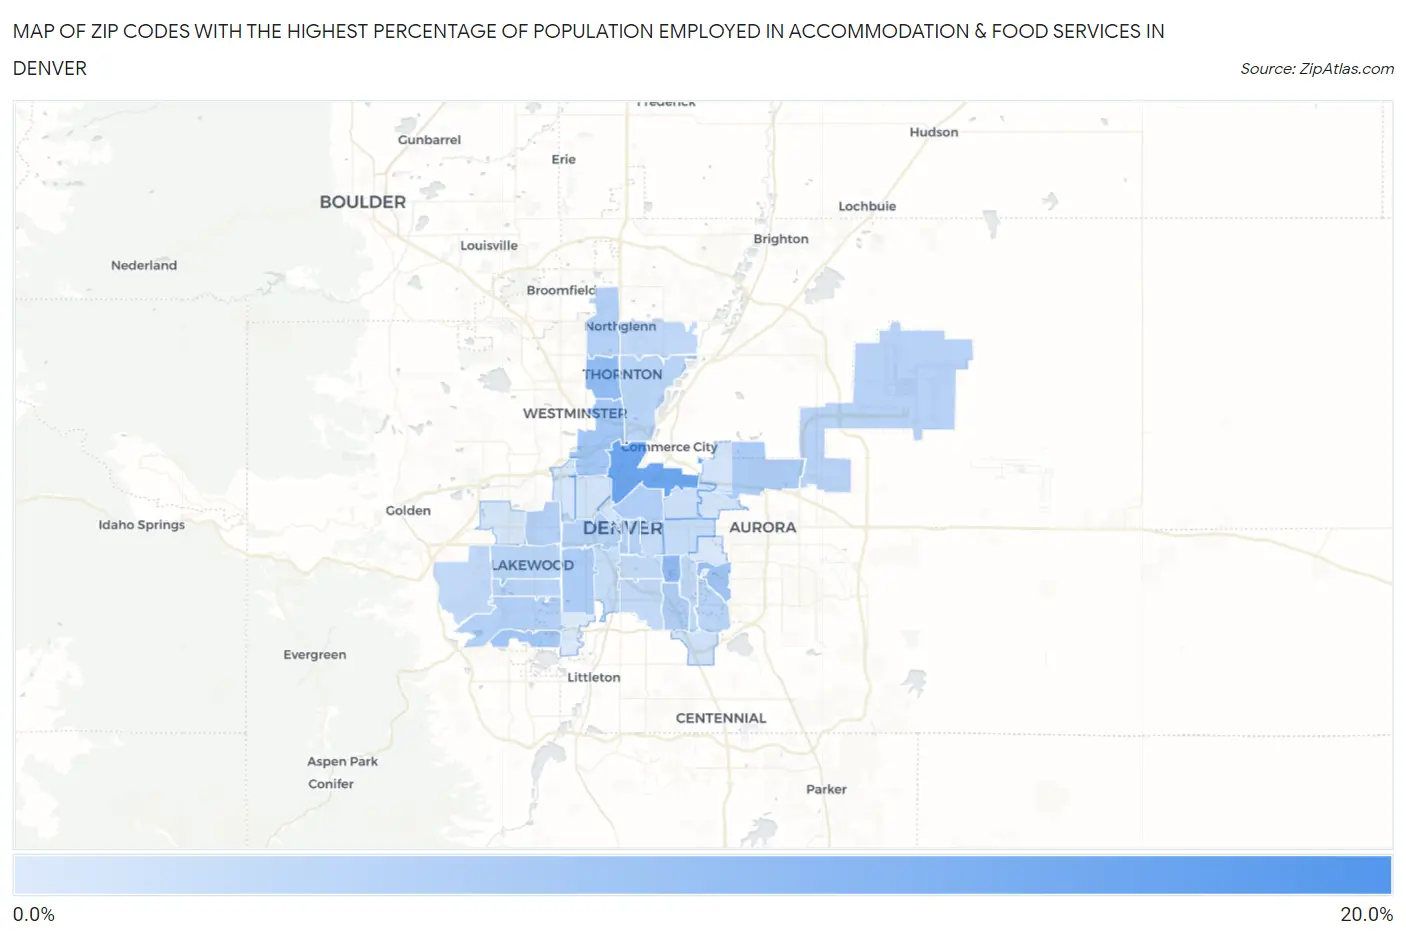
Map of Zip Codes with the Highest Percentage of Population Employed in Accommodation & Food Services in Denver
3.4%
18.6%
Zip Codes with the Highest Percentage of Population Employed in Accommodation & Food Services in Denver, CO
| Zip Code | % Employed | vs State | vs National | |
| 1. | 80290 | 18.6% | 6.9%(+11.7)#16 | 6.9%(+11.8)#995 |
| 2. | 80216 | 14.6% | 6.9%(+7.74)#33 | 6.9%(+7.76)#1,777 |
| 3. | 80246 | 10.8% | 6.9%(+3.94)#79 | 6.9%(+3.96)#3,688 |
| 4. | 80260 | 10.7% | 6.9%(+3.80)#81 | 6.9%(+3.82)#3,796 |
| 5. | 80247 | 9.2% | 6.9%(+2.31)#106 | 6.9%(+2.33)#5,641 |
| 6. | 80221 | 9.1% | 6.9%(+2.23)#109 | 6.9%(+2.25)#5,761 |
| 7. | 80235 | 9.1% | 6.9%(+2.19)#111 | 6.9%(+2.21)#5,822 |
| 8. | 80239 | 8.2% | 6.9%(+1.28)#134 | 6.9%(+1.30)#7,462 |
| 9. | 80219 | 8.1% | 6.9%(+1.21)#136 | 6.9%(+1.23)#7,614 |
| 10. | 80222 | 7.8% | 6.9%(+0.933)#145 | 6.9%(+0.953)#8,186 |
| 11. | 80205 | 7.5% | 6.9%(+0.644)#150 | 6.9%(+0.664)#8,876 |
| 12. | 80218 | 7.5% | 6.9%(+0.589)#152 | 6.9%(+0.610)#9,016 |
| 13. | 80234 | 7.5% | 6.9%(+0.559)#156 | 6.9%(+0.580)#9,079 |
| 14. | 80214 | 7.3% | 6.9%(+0.449)#160 | 6.9%(+0.469)#9,379 |
| 15. | 80227 | 7.3% | 6.9%(+0.448)#161 | 6.9%(+0.468)#9,381 |
| 16. | 80203 | 7.3% | 6.9%(+0.361)#164 | 6.9%(+0.382)#9,643 |
| 17. | 80204 | 7.2% | 6.9%(+0.275)#171 | 6.9%(+0.296)#9,866 |
| 18. | 80249 | 6.9% | 6.9%(-0.043)#181 | 6.9%(-0.023)#10,692 |
| 19. | 80232 | 6.8% | 6.9%(-0.121)#184 | 6.9%(-0.101)#10,950 |
| 20. | 80231 | 6.8% | 6.9%(-0.125)#185 | 6.9%(-0.105)#10,963 |
| 21. | 80226 | 6.7% | 6.9%(-0.171)#188 | 6.9%(-0.151)#11,112 |
| 22. | 80229 | 6.7% | 6.9%(-0.218)#189 | 6.9%(-0.198)#11,246 |
| 23. | 80224 | 6.4% | 6.9%(-0.528)#203 | 6.9%(-0.508)#12,250 |
| 24. | 80210 | 6.1% | 6.9%(-0.762)#213 | 6.9%(-0.742)#12,999 |
| 25. | 80228 | 6.1% | 6.9%(-0.774)#214 | 6.9%(-0.754)#13,038 |
| 26. | 80233 | 6.1% | 6.9%(-0.794)#217 | 6.9%(-0.774)#13,113 |
| 27. | 80209 | 5.9% | 6.9%(-1.03)#228 | 6.9%(-1.01)#13,865 |
| 28. | 80220 | 5.7% | 6.9%(-1.20)#235 | 6.9%(-1.18)#14,378 |
| 29. | 80223 | 5.6% | 6.9%(-1.31)#244 | 6.9%(-1.29)#14,748 |
| 30. | 80206 | 5.5% | 6.9%(-1.38)#251 | 6.9%(-1.36)#14,972 |
| 31. | 80207 | 4.8% | 6.9%(-2.08)#291 | 6.9%(-2.06)#17,431 |
| 32. | 80237 | 4.8% | 6.9%(-2.14)#296 | 6.9%(-2.12)#17,626 |
| 33. | 80211 | 4.5% | 6.9%(-2.43)#308 | 6.9%(-2.41)#18,632 |
| 34. | 80238 | 4.4% | 6.9%(-2.52)#312 | 6.9%(-2.50)#18,889 |
| 35. | 80212 | 4.3% | 6.9%(-2.59)#319 | 6.9%(-2.57)#19,132 |
| 36. | 80202 | 4.3% | 6.9%(-2.60)#320 | 6.9%(-2.58)#19,165 |
| 37. | 80215 | 4.0% | 6.9%(-2.92)#324 | 6.9%(-2.90)#20,212 |
| 38. | 80230 | 3.9% | 6.9%(-3.00)#329 | 6.9%(-2.98)#20,482 |
| 39. | 80236 | 3.4% | 6.9%(-3.50)#349 | 6.9%(-3.48)#22,092 |
1
Common Questions
What are the Top 10 Zip Codes with the Highest Percentage of Population Employed in Accommodation & Food Services in Denver, CO?
Top 10 Zip Codes with the Highest Percentage of Population Employed in Accommodation & Food Services in Denver, CO are:
What zip code has the Highest Percentage of Population Employed in Accommodation & Food Services in Denver, CO?
80290 has the Highest Percentage of Population Employed in Accommodation & Food Services in Denver, CO with 18.6%.
What is the Percentage of Population Employed in Accommodation & Food Services in Denver, CO?
Percentage of Population Employed in Accommodation & Food Services in Denver is 6.6%.
What is the Percentage of Population Employed in Accommodation & Food Services in Colorado?
Percentage of Population Employed in Accommodation & Food Services in Colorado is 6.9%.
What is the Percentage of Population Employed in Accommodation & Food Services in the United States?
Percentage of Population Employed in Accommodation & Food Services in the United States is 6.9%.