Zip Codes with the Highest Percentage of Population with a Degree in Physical and Health Sciences in Denver, CO
RELATED REPORTS & OPTIONS
Physical and Health Sciences
Denver
Compare Zip Codes
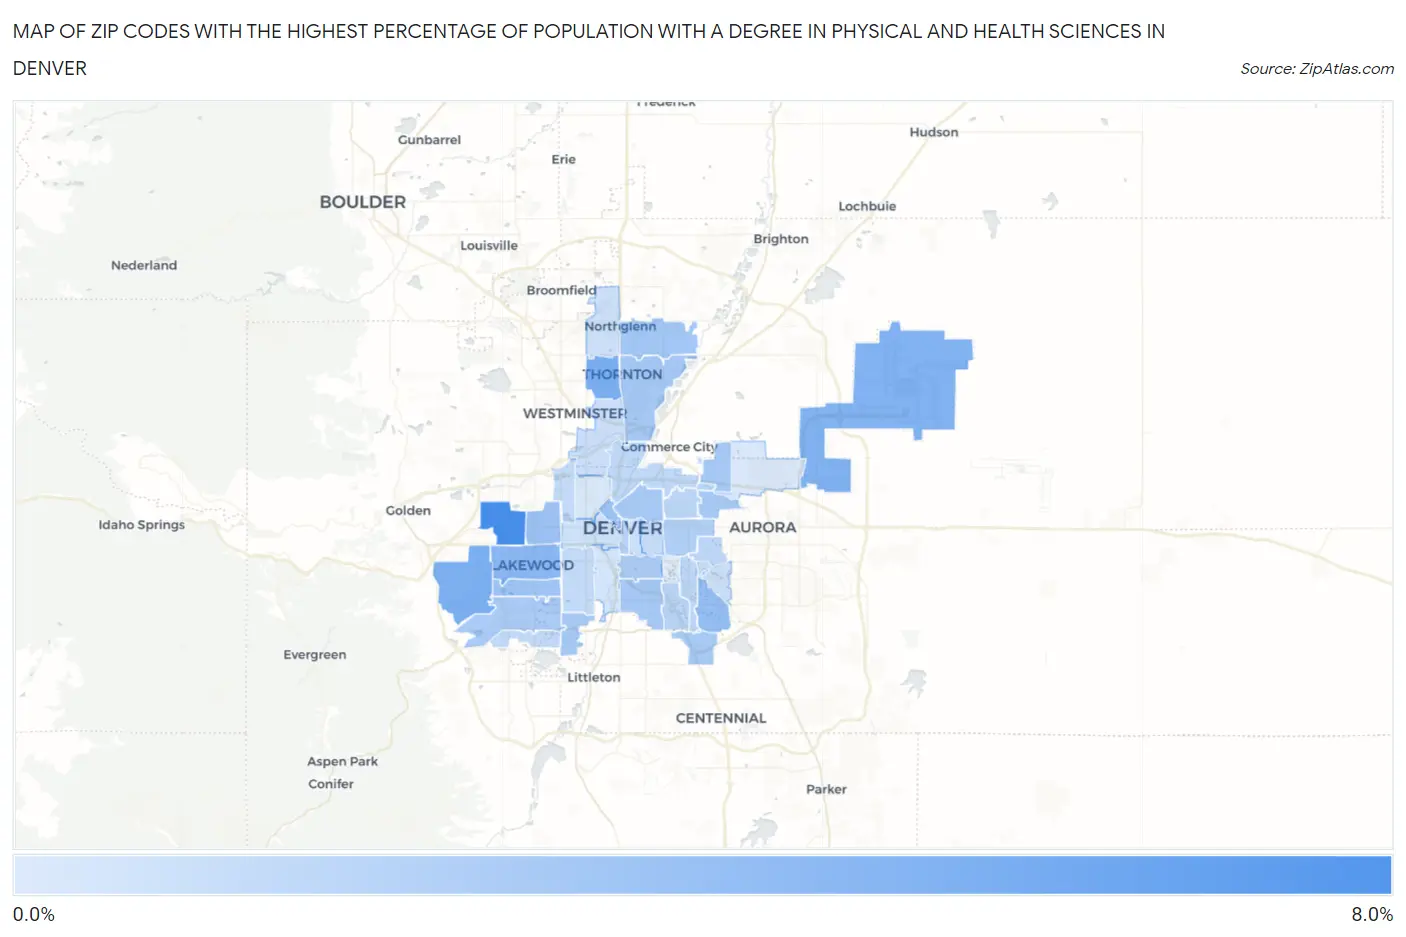
Map of Zip Codes with the Highest Percentage of Population with a Degree in Physical and Health Sciences in Denver
1.5%
6.9%
Zip Codes with the Highest Percentage of Population with a Degree in Physical and Health Sciences in Denver, CO
| Zip Code | % Graduates | vs State | vs National | |
| 1. | 80215 | 6.9% | 3.6%(+3.25)#57 | 3.1%(+3.79)#2,580 |
| 2. | 80228 | 5.0% | 3.6%(+1.32)#112 | 3.1%(+1.86)#4,639 |
| 3. | 80260 | 4.9% | 3.6%(+1.28)#115 | 3.1%(+1.82)#4,705 |
| 4. | 80249 | 4.8% | 3.6%(+1.15)#122 | 3.1%(+1.69)#4,945 |
| 5. | 80226 | 4.5% | 3.6%(+0.839)#137 | 3.1%(+1.38)#5,581 |
| 6. | 80231 | 4.0% | 3.6%(+0.400)#157 | 3.1%(+0.939)#6,632 |
| 7. | 80202 | 3.8% | 3.6%(+0.202)#172 | 3.1%(+0.742)#7,221 |
| 8. | 80214 | 3.8% | 3.6%(+0.202)#173 | 3.1%(+0.742)#7,224 |
| 9. | 80232 | 3.6% | 3.6%(-0.025)#190 | 3.1%(+0.514)#8,014 |
| 10. | 80233 | 3.5% | 3.6%(-0.113)#197 | 3.1%(+0.427)#8,332 |
| 11. | 80210 | 3.4% | 3.6%(-0.202)#202 | 3.1%(+0.338)#8,674 |
| 12. | 80229 | 3.4% | 3.6%(-0.206)#203 | 3.1%(+0.333)#8,685 |
| 13. | 80237 | 3.4% | 3.6%(-0.248)#205 | 3.1%(+0.292)#8,835 |
| 14. | 80238 | 3.4% | 3.6%(-0.258)#206 | 3.1%(+0.282)#8,868 |
| 15. | 80205 | 3.4% | 3.6%(-0.261)#207 | 3.1%(+0.279)#8,882 |
| 16. | 80236 | 3.3% | 3.6%(-0.294)#208 | 3.1%(+0.246)#9,011 |
| 17. | 80227 | 3.3% | 3.6%(-0.351)#214 | 3.1%(+0.189)#9,233 |
| 18. | 80209 | 3.2% | 3.6%(-0.463)#225 | 3.1%(+0.077)#9,663 |
| 19. | 80220 | 3.1% | 3.6%(-0.582)#233 | 3.1%(-0.043)#10,177 |
| 20. | 80203 | 2.8% | 3.6%(-0.888)#258 | 3.1%(-0.348)#11,549 |
| 21. | 80222 | 2.7% | 3.6%(-0.920)#261 | 3.1%(-0.380)#11,693 |
| 22. | 80224 | 2.7% | 3.6%(-0.973)#265 | 3.1%(-0.433)#11,937 |
| 23. | 80230 | 2.6% | 3.6%(-0.991)#269 | 3.1%(-0.451)#12,010 |
| 24. | 80207 | 2.6% | 3.6%(-0.992)#270 | 3.1%(-0.452)#12,018 |
| 25. | 80216 | 2.6% | 3.6%(-1.09)#274 | 3.1%(-0.546)#12,476 |
| 26. | 80235 | 2.4% | 3.6%(-1.19)#283 | 3.1%(-0.653)#12,981 |
| 27. | 80212 | 2.4% | 3.6%(-1.22)#285 | 3.1%(-0.682)#13,099 |
| 28. | 80219 | 2.4% | 3.6%(-1.26)#289 | 3.1%(-0.723)#13,302 |
| 29. | 80206 | 2.3% | 3.6%(-1.31)#294 | 3.1%(-0.769)#13,524 |
| 30. | 80221 | 2.1% | 3.6%(-1.52)#302 | 3.1%(-0.978)#14,537 |
| 31. | 80218 | 2.1% | 3.6%(-1.55)#306 | 3.1%(-1.01)#14,671 |
| 32. | 80234 | 2.1% | 3.6%(-1.56)#307 | 3.1%(-1.02)#14,732 |
| 33. | 80247 | 2.1% | 3.6%(-1.59)#309 | 3.1%(-1.05)#14,879 |
| 34. | 80204 | 2.0% | 3.6%(-1.68)#316 | 3.1%(-1.14)#15,298 |
| 35. | 80223 | 1.8% | 3.6%(-1.81)#321 | 3.1%(-1.27)#15,846 |
| 36. | 80211 | 1.6% | 3.6%(-1.99)#328 | 3.1%(-1.45)#16,647 |
| 37. | 80239 | 1.6% | 3.6%(-2.07)#331 | 3.1%(-1.53)#16,987 |
| 38. | 80246 | 1.5% | 3.6%(-2.15)#333 | 3.1%(-1.61)#17,360 |
1
Common Questions
What are the Top 10 Zip Codes with the Highest Percentage of Population with a Degree in Physical and Health Sciences in Denver, CO?
Top 10 Zip Codes with the Highest Percentage of Population with a Degree in Physical and Health Sciences in Denver, CO are:
What zip code has the Highest Percentage of Population with a Degree in Physical and Health Sciences in Denver, CO?
80215 has the Highest Percentage of Population with a Degree in Physical and Health Sciences in Denver, CO with 6.9%.
What is the Percentage of Population with a Degree in Physical and Health Sciences in Denver, CO?
Percentage of Population with a Degree in Physical and Health Sciences in Denver is 2.7%.
What is the Percentage of Population with a Degree in Physical and Health Sciences in Colorado?
Percentage of Population with a Degree in Physical and Health Sciences in Colorado is 3.6%.
What is the Percentage of Population with a Degree in Physical and Health Sciences in the United States?
Percentage of Population with a Degree in Physical and Health Sciences in the United States is 3.1%.