Zip Codes with the Highest Percentage of Population Employed in Food Preparation & Serving in Denver, CO
RELATED REPORTS & OPTIONS
Food Preparation & Serving
Denver
Compare Zip Codes
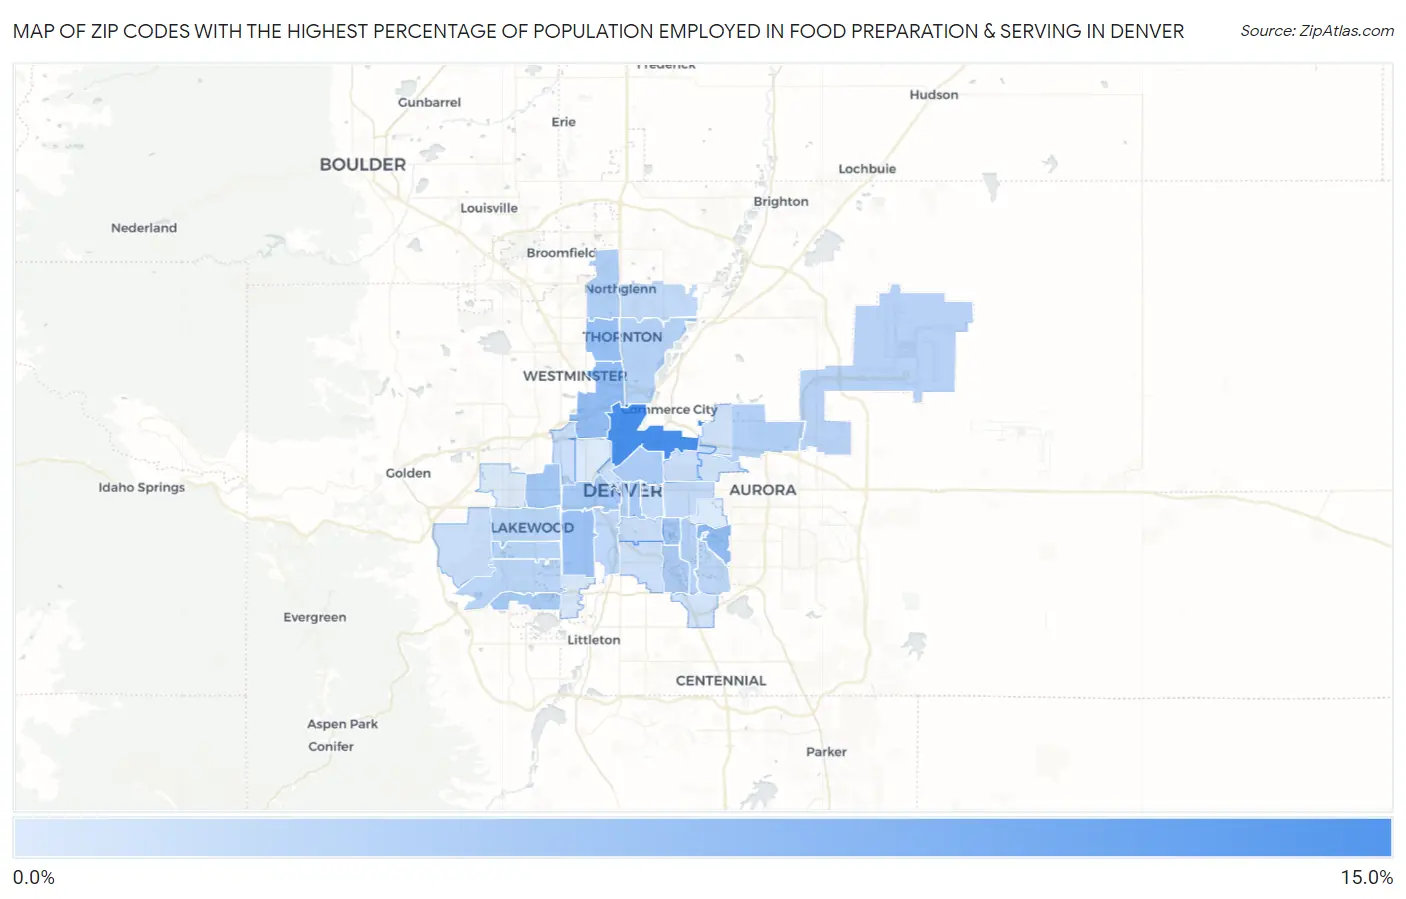
Map of Zip Codes with the Highest Percentage of Population Employed in Food Preparation & Serving in Denver
2.5%
13.9%
Zip Codes with the Highest Percentage of Population Employed in Food Preparation & Serving in Denver, CO
| Zip Code | % Employed | vs State | vs National | |
| 1. | 80216 | 13.9% | 5.2%(+8.74)#16 | 5.3%(+8.63)#1,181 |
| 2. | 80290 | 10.9% | 5.2%(+5.77)#33 | 5.3%(+5.66)#2,082 |
| 3. | 80221 | 8.1% | 5.2%(+2.92)#67 | 5.3%(+2.81)#4,572 |
| 4. | 80247 | 8.1% | 5.2%(+2.90)#70 | 5.3%(+2.80)#4,595 |
| 5. | 80260 | 7.7% | 5.2%(+2.50)#80 | 5.3%(+2.40)#5,236 |
| 6. | 80219 | 7.3% | 5.2%(+2.09)#89 | 5.3%(+1.99)#5,971 |
| 7. | 80246 | 6.8% | 5.2%(+1.63)#104 | 5.3%(+1.52)#7,043 |
| 8. | 80214 | 6.8% | 5.2%(+1.58)#107 | 5.3%(+1.47)#7,173 |
| 9. | 80204 | 6.7% | 5.2%(+1.49)#109 | 5.3%(+1.39)#7,399 |
| 10. | 80218 | 6.4% | 5.2%(+1.27)#119 | 5.3%(+1.16)#8,012 |
| 11. | 80235 | 6.4% | 5.2%(+1.22)#121 | 5.3%(+1.12)#8,142 |
| 12. | 80205 | 6.2% | 5.2%(+1.00)#126 | 5.3%(+0.896)#8,792 |
| 13. | 80222 | 6.1% | 5.2%(+0.932)#130 | 5.3%(+0.827)#8,982 |
| 14. | 80234 | 5.9% | 5.2%(+0.678)#146 | 5.3%(+0.573)#9,825 |
| 15. | 80239 | 5.5% | 5.2%(+0.332)#162 | 5.3%(+0.228)#11,027 |
| 16. | 80229 | 5.5% | 5.2%(+0.270)#168 | 5.3%(+0.165)#11,220 |
| 17. | 80224 | 5.3% | 5.2%(+0.159)#174 | 5.3%(+0.055)#11,615 |
| 18. | 80203 | 5.3% | 5.2%(+0.130)#175 | 5.3%(+0.026)#11,722 |
| 19. | 80249 | 5.3% | 5.2%(+0.109)#177 | 5.3%(+0.004)#11,803 |
| 20. | 80232 | 5.1% | 5.2%(-0.079)#184 | 5.3%(-0.184)#12,536 |
| 21. | 80226 | 5.0% | 5.2%(-0.139)#190 | 5.3%(-0.243)#12,772 |
| 22. | 80227 | 5.0% | 5.2%(-0.177)#191 | 5.3%(-0.281)#12,930 |
| 23. | 80231 | 4.9% | 5.2%(-0.299)#203 | 5.3%(-0.403)#13,434 |
| 24. | 80223 | 4.7% | 5.2%(-0.531)#219 | 5.3%(-0.635)#14,373 |
| 25. | 80220 | 4.5% | 5.2%(-0.654)#225 | 5.3%(-0.759)#14,907 |
| 26. | 80233 | 4.5% | 5.2%(-0.718)#230 | 5.3%(-0.822)#15,162 |
| 27. | 80206 | 4.4% | 5.2%(-0.816)#235 | 5.3%(-0.920)#15,568 |
| 28. | 80228 | 4.0% | 5.2%(-1.14)#257 | 5.3%(-1.24)#16,956 |
| 29. | 80212 | 3.9% | 5.2%(-1.30)#267 | 5.3%(-1.40)#17,603 |
| 30. | 80207 | 3.8% | 5.2%(-1.33)#271 | 5.3%(-1.44)#17,741 |
| 31. | 80209 | 3.8% | 5.2%(-1.38)#273 | 5.3%(-1.48)#17,934 |
| 32. | 80210 | 3.7% | 5.2%(-1.45)#276 | 5.3%(-1.56)#18,221 |
| 33. | 80202 | 3.5% | 5.2%(-1.63)#286 | 5.3%(-1.74)#19,009 |
| 34. | 80238 | 3.5% | 5.2%(-1.64)#288 | 5.3%(-1.74)#19,030 |
| 35. | 80237 | 3.3% | 5.2%(-1.87)#300 | 5.3%(-1.98)#20,035 |
| 36. | 80236 | 2.8% | 5.2%(-2.37)#335 | 5.3%(-2.47)#22,015 |
| 37. | 80230 | 2.6% | 5.2%(-2.57)#342 | 5.3%(-2.68)#22,742 |
| 38. | 80211 | 2.6% | 5.2%(-2.61)#345 | 5.3%(-2.72)#22,887 |
| 39. | 80215 | 2.5% | 5.2%(-2.65)#347 | 5.3%(-2.75)#23,043 |
1
Common Questions
What are the Top 10 Zip Codes with the Highest Percentage of Population Employed in Food Preparation & Serving in Denver, CO?
Top 10 Zip Codes with the Highest Percentage of Population Employed in Food Preparation & Serving in Denver, CO are:
What zip code has the Highest Percentage of Population Employed in Food Preparation & Serving in Denver, CO?
80216 has the Highest Percentage of Population Employed in Food Preparation & Serving in Denver, CO with 13.9%.
What is the Percentage of Population Employed in Food Preparation & Serving in Denver, CO?
Percentage of Population Employed in Food Preparation & Serving in Denver is 5.1%.
What is the Percentage of Population Employed in Food Preparation & Serving in Colorado?
Percentage of Population Employed in Food Preparation & Serving in Colorado is 5.2%.
What is the Percentage of Population Employed in Food Preparation & Serving in the United States?
Percentage of Population Employed in Food Preparation & Serving in the United States is 5.3%.