Zip Codes with the Highest Percentage of Households with Income Above $200,000 in Crested Butte, CO
RELATED REPORTS & OPTIONS
Household Income | $200k+
Crested Butte
Compare Zip Codes
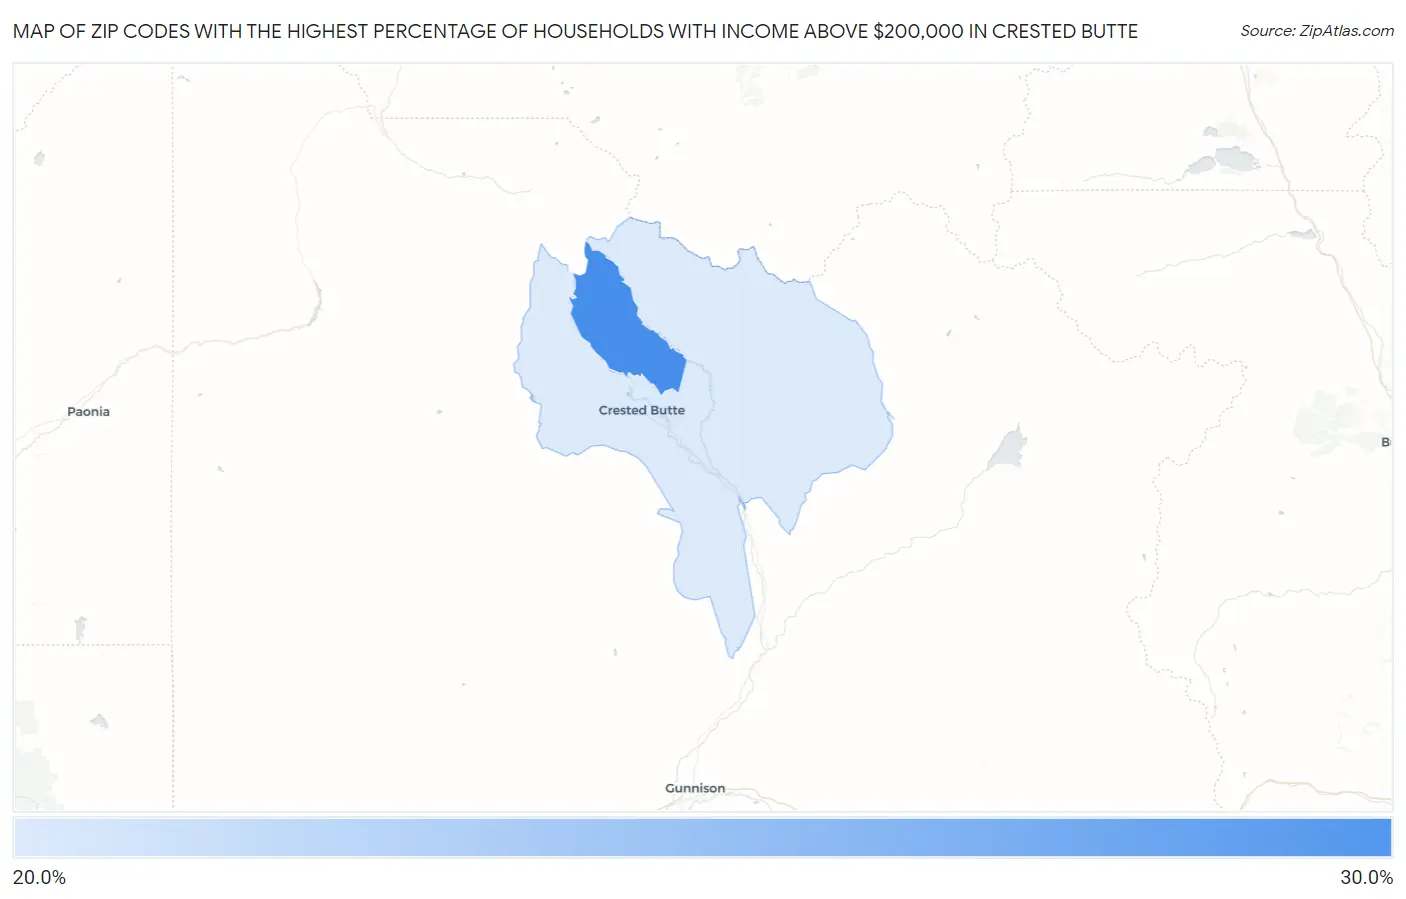
Map of Zip Codes with the Highest Percentage of Households with Income Above $200,000 in Crested Butte
20.8%
28.3%
Zip Codes with the Highest Percentage of Households with Income Above $200,000 in Crested Butte, CO
| Zip Code | Households with Income > $200k | vs State | vs National | |
| 1. | 81225 | 28.3% | 13.9%(+14.4)#34 | 11.4%(+16.9)#1,686 |
| 2. | 81224 | 20.8% | 13.9%(+6.90)#74 | 11.4%(+9.40)#3,088 |
1
Common Questions
What are the Top Zip Codes with the Highest Percentage of Households with Income Above $200,000 in Crested Butte, CO?
Top Zip Codes with the Highest Percentage of Households with Income Above $200,000 in Crested Butte, CO are:
What zip code has the Highest Percentage of Households with Income Above $200,000 in Crested Butte, CO?
81225 has the Highest Percentage of Households with Income Above $200,000 in Crested Butte, CO with 28.3%.
What is the Percentage of Households with Income Above $200,000 in Crested Butte, CO?
Percentage of Households with Income Above $200,000 in Crested Butte is 13.4%.
What is the Percentage of Households with Income Above $200,000 in Colorado?
Percentage of Households with Income Above $200,000 in Colorado is 13.9%.
What is the Percentage of Households with Income Above $200,000 in the United States?
Percentage of Households with Income Above $200,000 in the United States is 11.4%.