Zip Codes with the Highest Poverty Level Among Children Under the Age of 5 in Denver, CO

RELATED REPORTS & OPTIONS

Highest Poverty | Child 0-5
Population
Families and Households
Female Fertility
Female Fertility (Unmarried)
Race (Community Size)
Race (Percentage)
Ancestry (Community Size)
AfghanAfricanAlaska NativeAlbanianAlsatianAmericanApacheArabArapahoArgentineanArmenianAssyrian / Chaldean / SyriacAustralianAustrianBahamianBangladeshiBarbadianBasqueBelgianBhutaneseBlackfeetBolivianBrazilianBritishBritish West IndianBulgarianBurmeseCajunCambodianCanadianCape VerdeanCelticCentral AmericanCentral American IndianCherokeeCheyenneChickasawChileanChippewaChoctawColombianComancheCosta RicanCreeCreekCroatianCrowCubanCzechCzechoslovakianDanishDelawareDominicanDutchEastern EuropeanEcuadorianEgyptianEnglishEstonianEthiopianEuropeanFijianFilipinoFinnishFrenchFrench American IndianFrench CanadianGermanGerman RussianGhanaianGreekGuamanian / ChamorroGuatemalanGuyaneseHaitianHonduranHopiHungarianIcelanderIndian (Asian)IndonesianInupiatIranianIraqiIrishIroquoisIsraeliItalianJamaicanJapaneseJordanianKenyanKiowaKoreanLaotianLatvianLebaneseLiberianLithuanianLuxembourgerMacedonianMalaysianMalteseMarshalleseMenomineeMexicanMexican American IndianMongolianMoroccanNative HawaiianNavajoNew ZealanderNicaraguanNigerianNorthern EuropeanNorwegianOkinawanOsagePakistaniPalestinianPanamanianParaguayanPennsylvania GermanPeruvianPimaPolishPortuguesePotawatomiPuebloPuerto RicanRomanianRussianSalvadoranSamoanScandinavianScotch-IrishScottishSeminoleSenegaleseSerbianShoshoneSierra LeoneanSiouxSlavicSlovakSloveneSomaliSouth AfricanSouth AmericanSouth American IndianSpaniardSpanishSpanish AmericanSpanish American IndianSri LankanSubsaharan AfricanSudaneseSwedishSwissSyrianThaiTrinidadian and TobagonianTurkishU.S. Virgin IslanderUgandanUkrainianUruguayanUteVenezuelanVietnameseWelshWest IndianYaquiYugoslavian
Ancestry (Percentage)
AfghanAfricanAlaska NativeAlbanianAlsatianAmericanApacheArabArapahoArgentineanArmenianAssyrian / Chaldean / SyriacAustralianAustrianBahamianBangladeshiBarbadianBasqueBelgianBhutaneseBlackfeetBolivianBrazilianBritishBritish West IndianBulgarianBurmeseCajunCambodianCanadianCape VerdeanCelticCentral AmericanCentral American IndianCherokeeCheyenneChickasawChileanChippewaChoctawColombianComancheCosta RicanCreeCreekCroatianCrowCubanCzechCzechoslovakianDanishDelawareDominicanDutchEastern EuropeanEcuadorianEgyptianEnglishEstonianEthiopianEuropeanFijianFilipinoFinnishFrenchFrench American IndianFrench CanadianGermanGerman RussianGhanaianGreekGuamanian / ChamorroGuatemalanGuyaneseHaitianHonduranHopiHungarianIcelanderIndian (Asian)IndonesianInupiatIranianIraqiIrishIroquoisIsraeliItalianJamaicanJapaneseJordanianKenyanKiowaKoreanLaotianLatvianLebaneseLiberianLithuanianLuxembourgerMacedonianMalaysianMalteseMarshalleseMenomineeMexicanMexican American IndianMongolianMoroccanNative HawaiianNavajoNew ZealanderNicaraguanNigerianNorthern EuropeanNorwegianOkinawanOsagePakistaniPalestinianPanamanianParaguayanPennsylvania GermanPeruvianPimaPolishPortuguesePotawatomiPuebloPuerto RicanRomanianRussianSalvadoranSamoanScandinavianScotch-IrishScottishSeminoleSenegaleseSerbianShoshoneSierra LeoneanSiouxSlavicSlovakSloveneSomaliSouth AfricanSouth AmericanSouth American IndianSpaniardSpanishSpanish AmericanSpanish American IndianSri LankanSubsaharan AfricanSudaneseSwedishSwissSyrianThaiTrinidadian and TobagonianTurkishU.S. Virgin IslanderUgandanUkrainianUruguayanUteVenezuelanVietnameseWelshWest IndianYaquiYugoslavian
Immigrant Origin (Total)
AfghanistanAfricaAlbaniaArgentinaArmeniaAsiaAustraliaAustriaBangladeshBarbadosBelarusBelgiumBoliviaBosnia and HerzegovinaBrazilBulgariaBurma / MyanmarCambodiaCameroonCanadaCaribbeanCentral AmericaChileChinaColombiaCongoCosta RicaCroatiaCubaCzechoslovakiaDenmarkDominican RepublicEastern AfricaEastern AsiaEastern EuropeEcuadorEgyptEl SalvadorEnglandEritreaEthiopiaEuropeFranceGermanyGhanaGreeceGuatemalaHaitiHondurasHong KongHungaryIndiaIndonesiaIranIraqIrelandIsraelItalyJamaicaJapanJordanKazakhstanKenyaKoreaLaosLatin AmericaLatviaLebanonLiberiaLithuaniaMalaysiaMexicoMicronesiaMiddle AfricaMoldovaMoroccoNepalNetherlandsNicaraguaNigeriaNorthern AfricaNorthern EuropeNorwayOceaniaPakistanPanamaPeruPhilippinesPolandPortugalRomaniaRussiaSaudi ArabiaScotlandSenegalSerbiaSingaporeSomaliaSouth AfricaSouth AmericaSouth Central AsiaSouth Eastern AsiaSouthern EuropeSpainSudanSwedenSwitzerlandSyriaTaiwanThailandTrinidad and TobagoTurkeyUgandaUkraineUzbekistanVenezuelaVietnamWestern AfricaWestern AsiaWestern EuropeZaire
Immigrant Origin (Percentage)
AfghanistanAfricaAlbaniaArgentinaArmeniaAsiaAustraliaAustriaBangladeshBarbadosBelarusBelgiumBoliviaBosnia and HerzegovinaBrazilBulgariaBurma / MyanmarCambodiaCameroonCanadaCaribbeanCentral AmericaChileChinaColombiaCongoCosta RicaCroatiaCubaCzechoslovakiaDenmarkDominican RepublicEastern AfricaEastern AsiaEastern EuropeEcuadorEgyptEl SalvadorEnglandEritreaEthiopiaEuropeFranceGermanyGhanaGreeceGuatemalaHaitiHondurasHong KongHungaryIndiaIndonesiaIranIraqIrelandIsraelItalyJamaicaJapanJordanKazakhstanKenyaKoreaLaosLatin AmericaLatviaLebanonLiberiaLithuaniaMalaysiaMexicoMicronesiaMiddle AfricaMoldovaMoroccoNepalNetherlandsNicaraguaNigeriaNorthern AfricaNorthern EuropeNorwayOceaniaPakistanPanamaPeruPhilippinesPolandPortugalRomaniaRussiaSaudi ArabiaScotlandSenegalSerbiaSingaporeSomaliaSouth AfricaSouth AmericaSouth Central AsiaSouth Eastern AsiaSouthern EuropeSpainSudanSwedenSwitzerlandSyriaTaiwanThailandTrinidad and TobagoTurkeyUgandaUkraineUzbekistanVenezuelaVietnamWestern AfricaWestern AsiaWestern EuropeZaire
Income
Income (Families)
Income (Households)
Poverty
Poverty (Families)
Unemployment
Employment Occupations
Employment Industries
Employer Class
Commute Time
Commute Means
School Enrollment
Education by Degree Field
Occupancy
Finances
Physical Characteristics
Denver
Compare Zip Codes
Comparison Subject

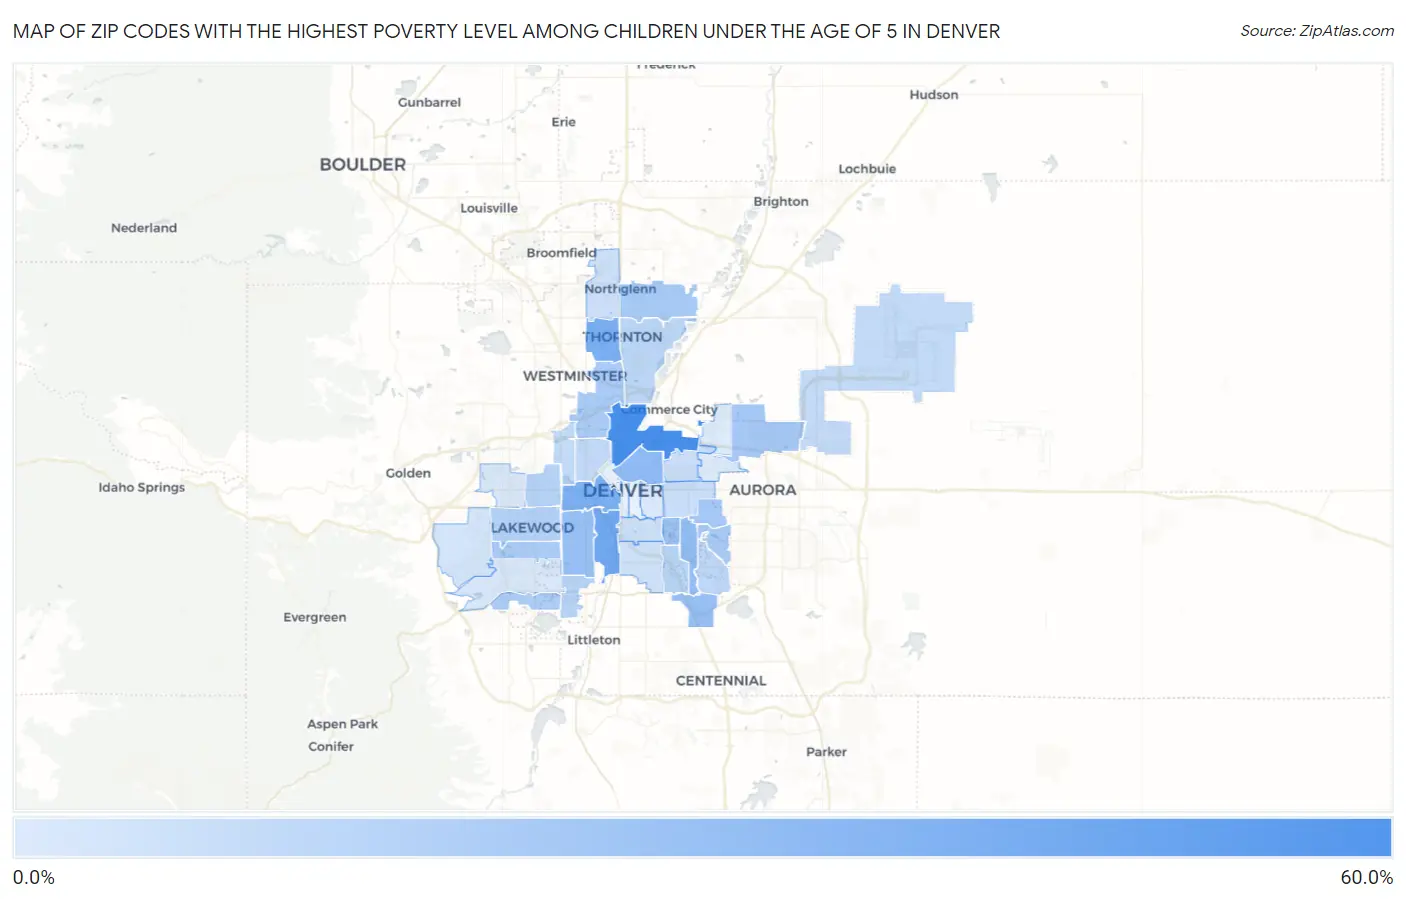
Map of Zip Codes with the Highest Poverty Level Among Children Under the Age of 5 in Denver

0.0%
60.0%
Zip Codes with the Highest Poverty Level Among Children Under the Age of 5 in Denver Map

Zip Codes with the Highest Poverty Level Among Children Under the Age of 5 in Denver, CO

Zip Code Child Poverty vs State vs National
1.8021652.7%11.9%(+40.8)#1918.1%(+34.6)#2,281
2.8022335.7%11.9%(+23.9)#4018.1%(+17.7)#4,878
3.8020431.6%11.9%(+19.7)#4618.1%(+13.5)#5,941
4.8026031.3%11.9%(+19.4)#4918.1%(+13.2)#5,998
5.8020524.7%11.9%(+12.8)#7218.1%(+6.61)#8,123
6.8022423.2%11.9%(+11.4)#7518.1%(+5.18)#8,666
7.8021922.2%11.9%(+10.3)#8018.1%(+4.15)#9,112
8.8023721.8%11.9%(+9.93)#8418.1%(+3.74)#9,264
9.8024620.2%11.9%(+8.31)#9918.1%(+2.13)#9,948
10.8023017.5%11.9%(+5.59)#11618.1%(-0.599)#11,209
11.8023917.0%11.9%(+5.16)#12018.1%(-1.02)#11,410
12.8023316.2%11.9%(+4.36)#12218.1%(-1.82)#11,794
13.8022115.9%11.9%(+4.05)#12518.1%(-2.14)#11,951
14.8024715.8%11.9%(+3.88)#12718.1%(-2.30)#12,047
15.8023514.9%11.9%(+3.05)#13118.1%(-3.13)#12,506
16.8023214.8%11.9%(+2.95)#13318.1%(-3.23)#12,560
17.8022613.1%11.9%(+1.26)#14218.1%(-4.93)#13,550
18.8021412.3%11.9%(+0.461)#15318.1%(-5.72)#14,015
19.8023611.6%11.9%(-0.241)#15718.1%(-6.42)#14,444
20.8022210.5%11.9%(-1.38)#16918.1%(-7.56)#15,118
21.8022910.0%11.9%(-1.83)#17118.1%(-8.02)#15,374
22.802319.5%11.9%(-2.36)#18118.1%(-8.55)#15,718
23.802118.6%11.9%(-3.29)#19018.1%(-9.47)#16,352
24.802128.1%11.9%(-3.79)#19718.1%(-9.98)#16,700
25.802497.8%11.9%(-4.11)#20218.1%(-10.3)#16,895
26.802206.4%11.9%(-5.44)#21418.1%(-11.6)#17,773
27.802075.5%11.9%(-6.36)#22618.1%(-12.5)#18,420
28.802345.4%11.9%(-6.52)#23018.1%(-12.7)#18,540
29.802094.4%11.9%(-7.49)#24018.1%(-13.7)#19,194
30.802104.1%11.9%(-7.79)#24218.1%(-14.0)#19,437
31.802283.2%11.9%(-8.65)#25218.1%(-14.8)#20,008
32.802272.0%11.9%(-9.87)#26418.1%(-16.1)#20,838
33.802151.0%11.9%(-10.8)#27318.1%(-17.0)#21,368
34.802061.0%11.9%(-10.8)#27418.1%(-17.0)#21,372
35.802380.44%11.9%(-11.4)#28218.1%(-17.6)#21,628

Common Questions

What are the Top 10 Zip Codes with the Highest Poverty Level Among Children Under the Age of 5 in Denver, CO?
Top 10 Zip Codes with the Highest Poverty Level Among Children Under the Age of 5 in Denver, CO are:
#1
52.7%
#2
35.7%
#3
31.6%
#4
31.3%
#5
24.7%
#6
23.2%
#7
22.2%
#8
21.8%
#9
20.2%
#10
17.5%
What zip code has the Highest Poverty Level Among Children Under the Age of 5 in Denver, CO?
80216 has the Highest Poverty Level Among Children Under the Age of 5 in Denver, CO with 52.7%.
What is the Poverty Level Among Children Under the Age of 5 in Denver, CO?
Poverty Level Among Children Under the Age of 5 in Denver is 14.9%.
What is the Poverty Level Among Children Under the Age of 5 in Colorado?
Poverty Level Among Children Under the Age of 5 in Colorado is 11.9%.
What is the Poverty Level Among Children Under the Age of 5 in the United States?
Poverty Level Among Children Under the Age of 5 in the United States is 18.1%.