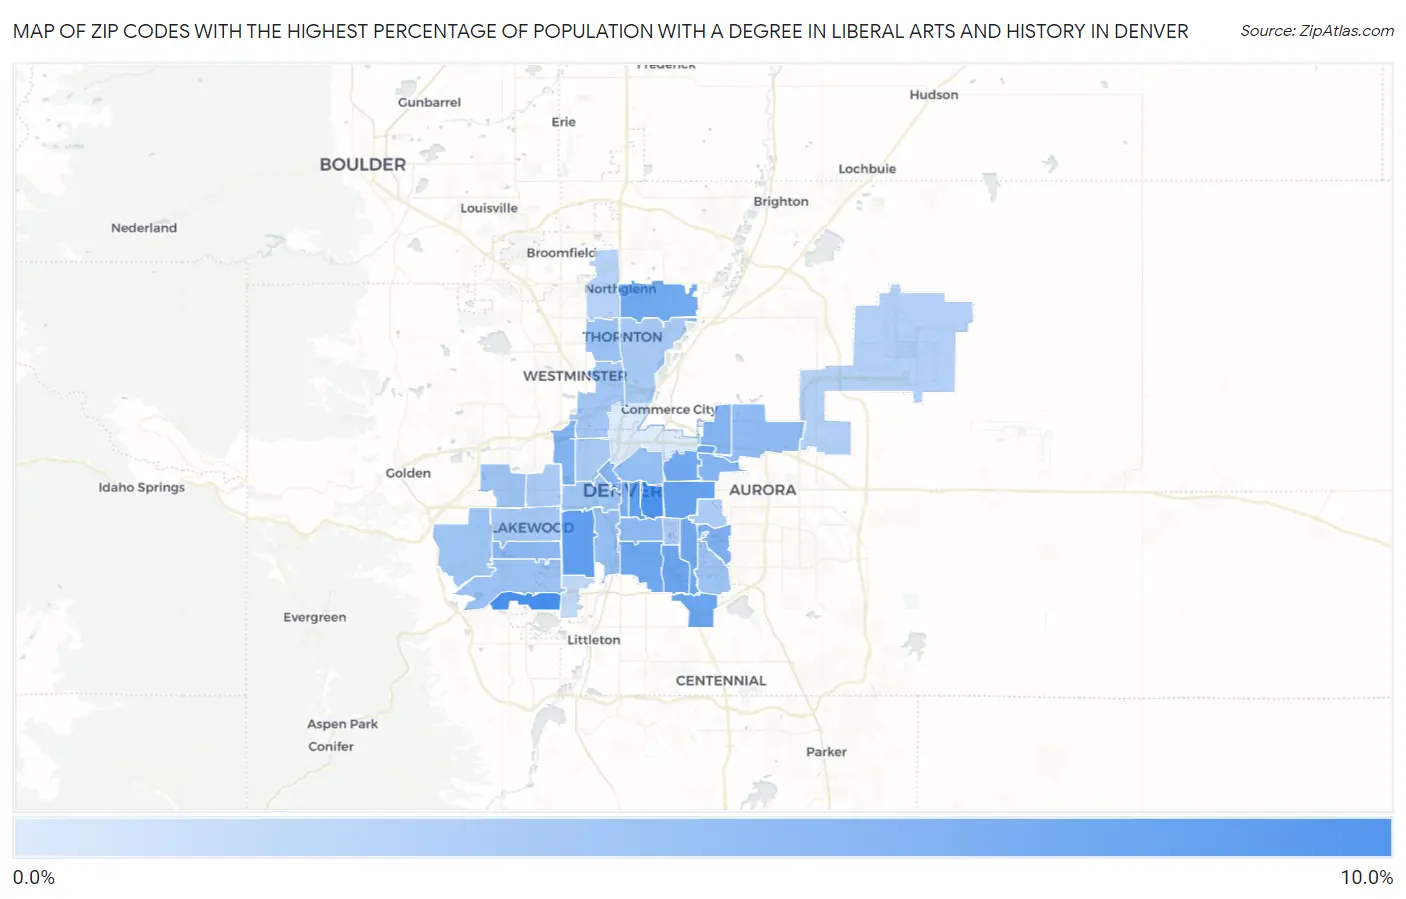
Zip Codes with the Highest Percentage of Population with a Degree in Liberal Arts and History in Denver, CO
RELATED REPORTS & OPTIONS
Liberal Arts and History
Denver
Compare Zip Codes
Map of Zip Codes with the Highest Percentage of Population with a Degree in Liberal Arts and History in Denver
1.2%
8.2%
Zip Codes with the Highest Percentage of Population with a Degree in Liberal Arts and History in Denver, CO
| Zip Code | % Graduates | vs State | vs National | |
| 1. | 80235 | 8.2% | 4.6%(+3.55)#37 | 4.9%(+3.31)#4,686 |
| 2. | 80206 | 8.0% | 4.6%(+3.41)#39 | 4.9%(+3.16)#4,853 |
| 3. | 80218 | 7.0% | 4.6%(+2.41)#62 | 4.9%(+2.17)#6,314 |
| 4. | 80219 | 6.9% | 4.6%(+2.30)#65 | 4.9%(+2.05)#6,511 |
| 5. | 80220 | 6.7% | 4.6%(+2.07)#78 | 4.9%(+1.83)#6,946 |
| 6. | 80222 | 6.4% | 4.6%(+1.75)#92 | 4.9%(+1.51)#7,602 |
| 7. | 80237 | 6.4% | 4.6%(+1.74)#93 | 4.9%(+1.50)#7,627 |
| 8. | 80210 | 6.3% | 4.6%(+1.70)#96 | 4.9%(+1.46)#7,721 |
| 9. | 80207 | 6.2% | 4.6%(+1.60)#101 | 4.9%(+1.36)#7,947 |
| 10. | 80233 | 6.0% | 4.6%(+1.41)#105 | 4.9%(+1.17)#8,397 |
| 11. | 80224 | 6.0% | 4.6%(+1.41)#106 | 4.9%(+1.17)#8,401 |
| 12. | 80203 | 5.6% | 4.6%(+1.00)#124 | 4.9%(+0.760)#9,484 |
| 13. | 80247 | 5.6% | 4.6%(+0.960)#125 | 4.9%(+0.719)#9,590 |
| 14. | 80212 | 5.3% | 4.6%(+0.692)#139 | 4.9%(+0.450)#10,370 |
| 15. | 80202 | 5.2% | 4.6%(+0.610)#141 | 4.9%(+0.369)#10,618 |
| 16. | 80238 | 5.2% | 4.6%(+0.587)#144 | 4.9%(+0.346)#10,677 |
| 17. | 80232 | 4.9% | 4.6%(+0.238)#160 | 4.9%(-0.004)#11,759 |
| 18. | 80209 | 4.7% | 4.6%(+0.110)#169 | 4.9%(-0.131)#12,186 |
| 19. | 80239 | 4.7% | 4.6%(+0.092)#171 | 4.9%(-0.149)#12,246 |
| 20. | 80205 | 4.5% | 4.6%(-0.142)#185 | 4.9%(-0.383)#13,000 |
| 21. | 80223 | 4.4% | 4.6%(-0.197)#189 | 4.9%(-0.438)#13,175 |
| 22. | 80227 | 4.2% | 4.6%(-0.443)#207 | 4.9%(-0.684)#14,054 |
| 23. | 80260 | 4.1% | 4.6%(-0.492)#212 | 4.9%(-0.733)#14,246 |
| 24. | 80204 | 4.1% | 4.6%(-0.552)#220 | 4.9%(-0.793)#14,478 |
| 25. | 80228 | 4.1% | 4.6%(-0.568)#224 | 4.9%(-0.810)#14,536 |
| 26. | 80231 | 4.1% | 4.6%(-0.571)#226 | 4.9%(-0.812)#14,546 |
| 27. | 80215 | 4.1% | 4.6%(-0.579)#227 | 4.9%(-0.820)#14,578 |
| 28. | 80221 | 3.8% | 4.6%(-0.781)#245 | 4.9%(-1.02)#15,333 |
| 29. | 80226 | 3.7% | 4.6%(-0.929)#256 | 4.9%(-1.17)#15,900 |
| 30. | 80211 | 3.7% | 4.6%(-0.970)#258 | 4.9%(-1.21)#16,032 |
| 31. | 80229 | 3.6% | 4.6%(-1.03)#264 | 4.9%(-1.27)#16,247 |
| 32. | 80246 | 3.5% | 4.6%(-1.09)#270 | 4.9%(-1.33)#16,440 |
| 33. | 80214 | 3.5% | 4.6%(-1.16)#274 | 4.9%(-1.40)#16,691 |
| 34. | 80230 | 3.4% | 4.6%(-1.22)#280 | 4.9%(-1.46)#16,945 |
| 35. | 80249 | 3.0% | 4.6%(-1.58)#296 | 4.9%(-1.82)#18,160 |
| 36. | 80234 | 2.8% | 4.6%(-1.81)#306 | 4.9%(-2.05)#18,926 |
| 37. | 80236 | 2.4% | 4.6%(-2.22)#321 | 4.9%(-2.46)#20,239 |
| 38. | 80216 | 1.2% | 4.6%(-3.44)#360 | 4.9%(-3.68)#23,050 |
1
Common Questions
What are the Top 10 Zip Codes with the Highest Percentage of Population with a Degree in Liberal Arts and History in Denver, CO?
Top 10 Zip Codes with the Highest Percentage of Population with a Degree in Liberal Arts and History in Denver, CO are:
What zip code has the Highest Percentage of Population with a Degree in Liberal Arts and History in Denver, CO?
80235 has the Highest Percentage of Population with a Degree in Liberal Arts and History in Denver, CO with 8.2%.
What is the Percentage of Population with a Degree in Liberal Arts and History in Denver, CO?
Percentage of Population with a Degree in Liberal Arts and History in Denver is 5.4%.
What is the Percentage of Population with a Degree in Liberal Arts and History in Colorado?
Percentage of Population with a Degree in Liberal Arts and History in Colorado is 4.6%.
What is the Percentage of Population with a Degree in Liberal Arts and History in the United States?
Percentage of Population with a Degree in Liberal Arts and History in the United States is 4.9%.