Zip Codes with the Highest Percentage of Households with Income Above $200,000 in Castle Rock, CO
RELATED REPORTS & OPTIONS
Household Income | $200k+
Castle Rock
Compare Zip Codes
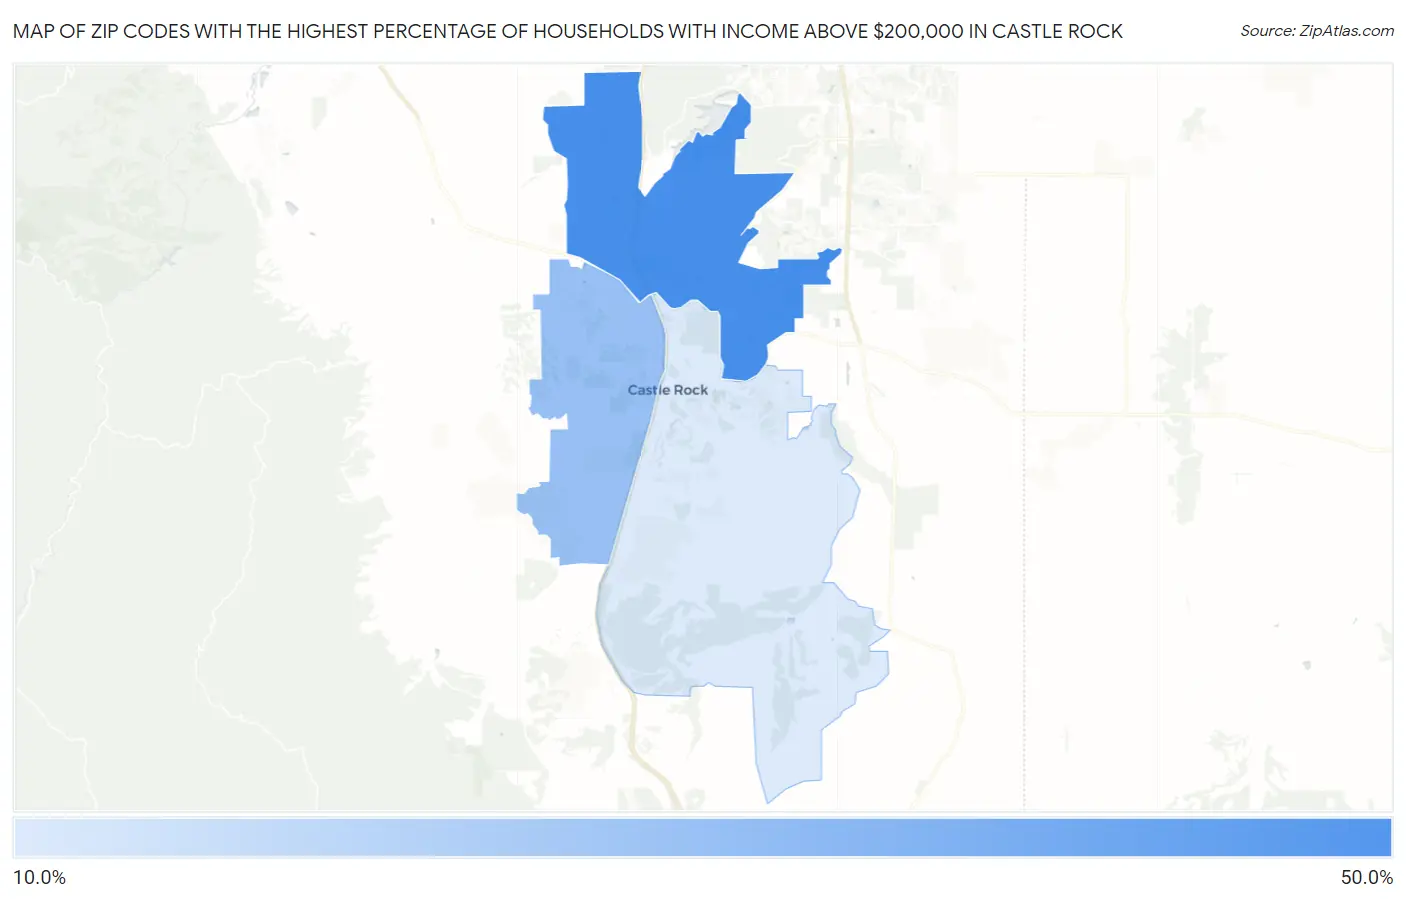
Map of Zip Codes with the Highest Percentage of Households with Income Above $200,000 in Castle Rock
19.9%
41.1%
Zip Codes with the Highest Percentage of Households with Income Above $200,000 in Castle Rock, CO
| Zip Code | Households with Income > $200k | vs State | vs National | |
| 1. | 80108 | 41.1% | 13.9%(+27.2)#3 | 11.4%(+29.7)#594 |
| 2. | 80109 | 29.2% | 13.9%(+15.3)#28 | 11.4%(+17.8)#1,553 |
| 3. | 80104 | 19.9% | 13.9%(+6.00)#81 | 11.4%(+8.50)#3,309 |
1
Common Questions
What are the Top Zip Codes with the Highest Percentage of Households with Income Above $200,000 in Castle Rock, CO?
Top Zip Codes with the Highest Percentage of Households with Income Above $200,000 in Castle Rock, CO are:
What zip code has the Highest Percentage of Households with Income Above $200,000 in Castle Rock, CO?
80108 has the Highest Percentage of Households with Income Above $200,000 in Castle Rock, CO with 41.1%.
What is the Percentage of Households with Income Above $200,000 in Castle Rock, CO?
Percentage of Households with Income Above $200,000 in Castle Rock is 24.6%.
What is the Percentage of Households with Income Above $200,000 in Colorado?
Percentage of Households with Income Above $200,000 in Colorado is 13.9%.
What is the Percentage of Households with Income Above $200,000 in the United States?
Percentage of Households with Income Above $200,000 in the United States is 11.4%.