Zip Codes with the Highest Percentage of Population Employed in Architecture & Engineering in Denver, CO
RELATED REPORTS & OPTIONS
Architecture & Engineering
Denver
Compare Zip Codes
Map of Zip Codes with the Highest Percentage of Population Employed in Architecture & Engineering in Denver
0.92%
8.0%
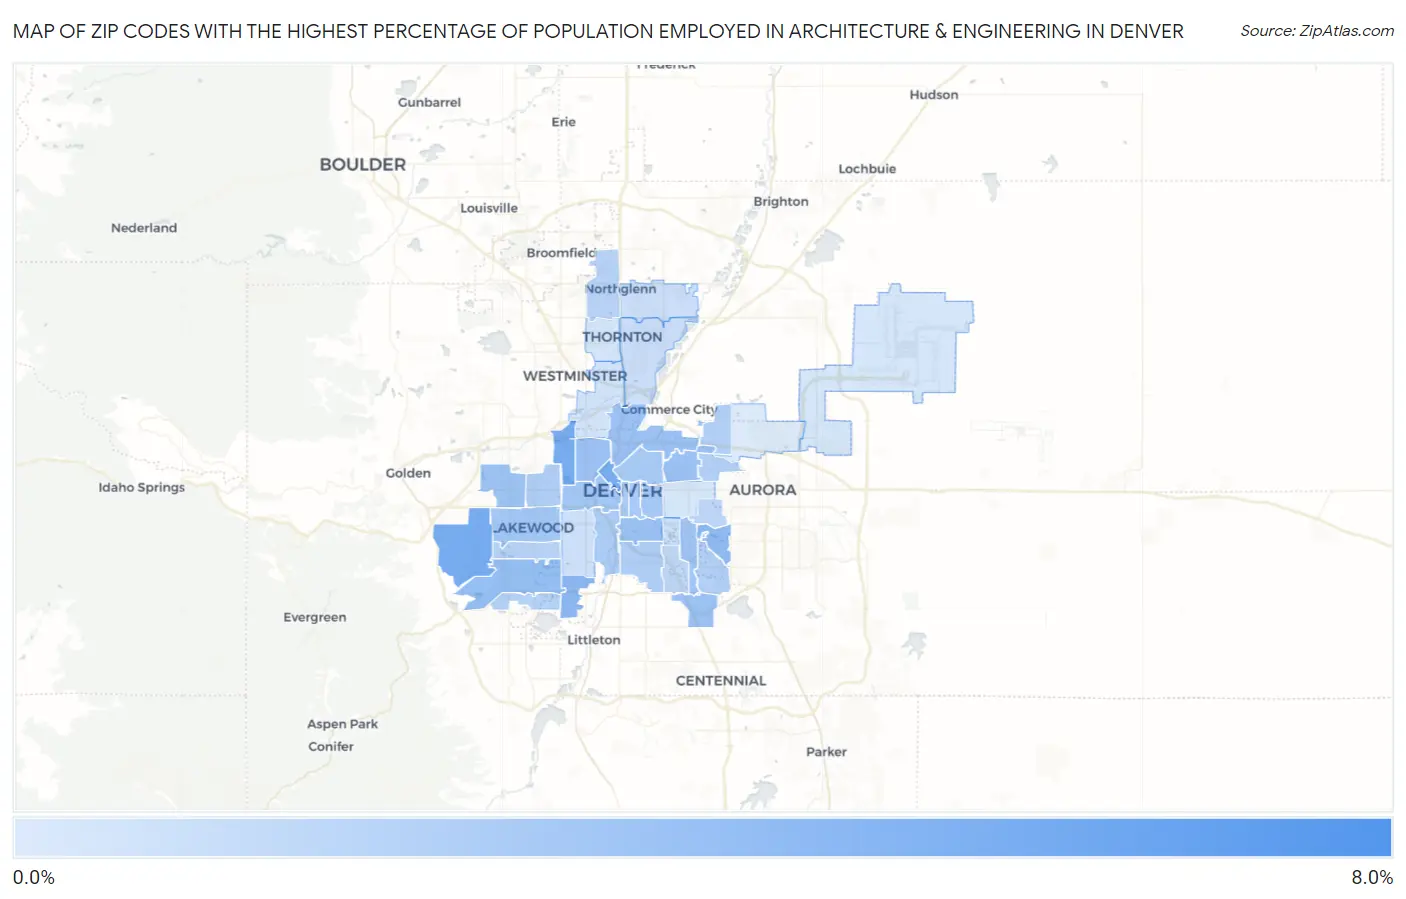
Zip Codes with the Highest Percentage of Population Employed in Architecture & Engineering in Denver, CO
| Zip Code | % Employed | vs State | vs National | |
| 1. | 80290 | 8.0% | 2.9%(+5.07)#9 | 2.1%(+5.84)#576 |
| 2. | 80202 | 5.6% | 2.9%(+2.72)#23 | 2.1%(+3.49)#1,254 |
| 3. | 80228 | 5.6% | 2.9%(+2.71)#24 | 2.1%(+3.48)#1,263 |
| 4. | 80212 | 5.6% | 2.9%(+2.70)#25 | 2.1%(+3.47)#1,270 |
| 5. | 80236 | 4.6% | 2.9%(+1.69)#49 | 2.1%(+2.47)#2,004 |
| 6. | 80247 | 4.5% | 2.9%(+1.57)#53 | 2.1%(+2.35)#2,127 |
| 7. | 80227 | 4.3% | 2.9%(+1.35)#62 | 2.1%(+2.12)#2,403 |
| 8. | 80211 | 4.0% | 2.9%(+1.11)#69 | 2.1%(+1.88)#2,725 |
| 9. | 80237 | 4.0% | 2.9%(+1.06)#70 | 2.1%(+1.83)#2,796 |
| 10. | 80207 | 3.9% | 2.9%(+0.978)#78 | 2.1%(+1.75)#2,937 |
| 11. | 80216 | 3.9% | 2.9%(+0.961)#79 | 2.1%(+1.73)#2,963 |
| 12. | 80209 | 3.9% | 2.9%(+0.938)#82 | 2.1%(+1.71)#2,996 |
| 13. | 80215 | 3.8% | 2.9%(+0.888)#83 | 2.1%(+1.66)#3,072 |
| 14. | 80224 | 3.7% | 2.9%(+0.761)#89 | 2.1%(+1.53)#3,337 |
| 15. | 80204 | 3.6% | 2.9%(+0.672)#90 | 2.1%(+1.44)#3,529 |
| 16. | 80226 | 3.5% | 2.9%(+0.610)#95 | 2.1%(+1.38)#3,658 |
| 17. | 80206 | 3.5% | 2.9%(+0.554)#97 | 2.1%(+1.33)#3,801 |
| 18. | 80203 | 3.4% | 2.9%(+0.487)#100 | 2.1%(+1.26)#3,948 |
| 19. | 80205 | 3.4% | 2.9%(+0.451)#102 | 2.1%(+1.22)#4,018 |
| 20. | 80218 | 3.3% | 2.9%(+0.357)#105 | 2.1%(+1.13)#4,258 |
| 21. | 80223 | 3.2% | 2.9%(+0.253)#110 | 2.1%(+1.02)#4,533 |
| 22. | 80210 | 3.1% | 2.9%(+0.143)#115 | 2.1%(+0.916)#4,836 |
| 23. | 80214 | 3.0% | 2.9%(+0.103)#118 | 2.1%(+0.875)#4,974 |
| 24. | 80231 | 2.8% | 2.9%(-0.147)#142 | 2.1%(+0.625)#5,885 |
| 25. | 80238 | 2.8% | 2.9%(-0.148)#143 | 2.1%(+0.625)#5,887 |
| 26. | 80235 | 2.7% | 2.9%(-0.195)#146 | 2.1%(+0.577)#6,060 |
| 27. | 80234 | 2.6% | 2.9%(-0.318)#157 | 2.1%(+0.454)#6,567 |
| 28. | 80232 | 2.6% | 2.9%(-0.336)#159 | 2.1%(+0.437)#6,642 |
| 29. | 80230 | 2.4% | 2.9%(-0.569)#172 | 2.1%(+0.203)#7,708 |
| 30. | 80222 | 2.3% | 2.9%(-0.592)#175 | 2.1%(+0.180)#7,803 |
| 31. | 80233 | 1.8% | 2.9%(-1.15)#209 | 2.1%(-0.374)#10,975 |
| 32. | 80229 | 1.8% | 2.9%(-1.15)#210 | 2.1%(-0.377)#10,993 |
| 33. | 80246 | 1.8% | 2.9%(-1.15)#211 | 2.1%(-0.382)#11,029 |
| 34. | 80219 | 1.7% | 2.9%(-1.25)#215 | 2.1%(-0.474)#11,660 |
| 35. | 80221 | 1.4% | 2.9%(-1.49)#234 | 2.1%(-0.719)#13,355 |
| 36. | 80260 | 1.3% | 2.9%(-1.65)#251 | 2.1%(-0.873)#14,478 |
| 37. | 80249 | 1.3% | 2.9%(-1.66)#254 | 2.1%(-0.889)#14,598 |
| 38. | 80220 | 1.2% | 2.9%(-1.67)#257 | 2.1%(-0.902)#14,699 |
| 39. | 80239 | 0.92% | 2.9%(-2.01)#290 | 2.1%(-1.23)#17,244 |
1
Common Questions
What are the Top 10 Zip Codes with the Highest Percentage of Population Employed in Architecture & Engineering in Denver, CO?
Top 10 Zip Codes with the Highest Percentage of Population Employed in Architecture & Engineering in Denver, CO are:
What zip code has the Highest Percentage of Population Employed in Architecture & Engineering in Denver, CO?
80290 has the Highest Percentage of Population Employed in Architecture & Engineering in Denver, CO with 8.0%.
What is the Percentage of Population Employed in Architecture & Engineering in Denver, CO?
Percentage of Population Employed in Architecture & Engineering in Denver is 3.1%.
What is the Percentage of Population Employed in Architecture & Engineering in Colorado?
Percentage of Population Employed in Architecture & Engineering in Colorado is 2.9%.
What is the Percentage of Population Employed in Architecture & Engineering in the United States?
Percentage of Population Employed in Architecture & Engineering in the United States is 2.1%.