Zip Codes with the Highest Percentage of Households with Income Above $200,000 in Parker, CO
RELATED REPORTS & OPTIONS
Household Income | $200k+
Parker
Compare Zip Codes
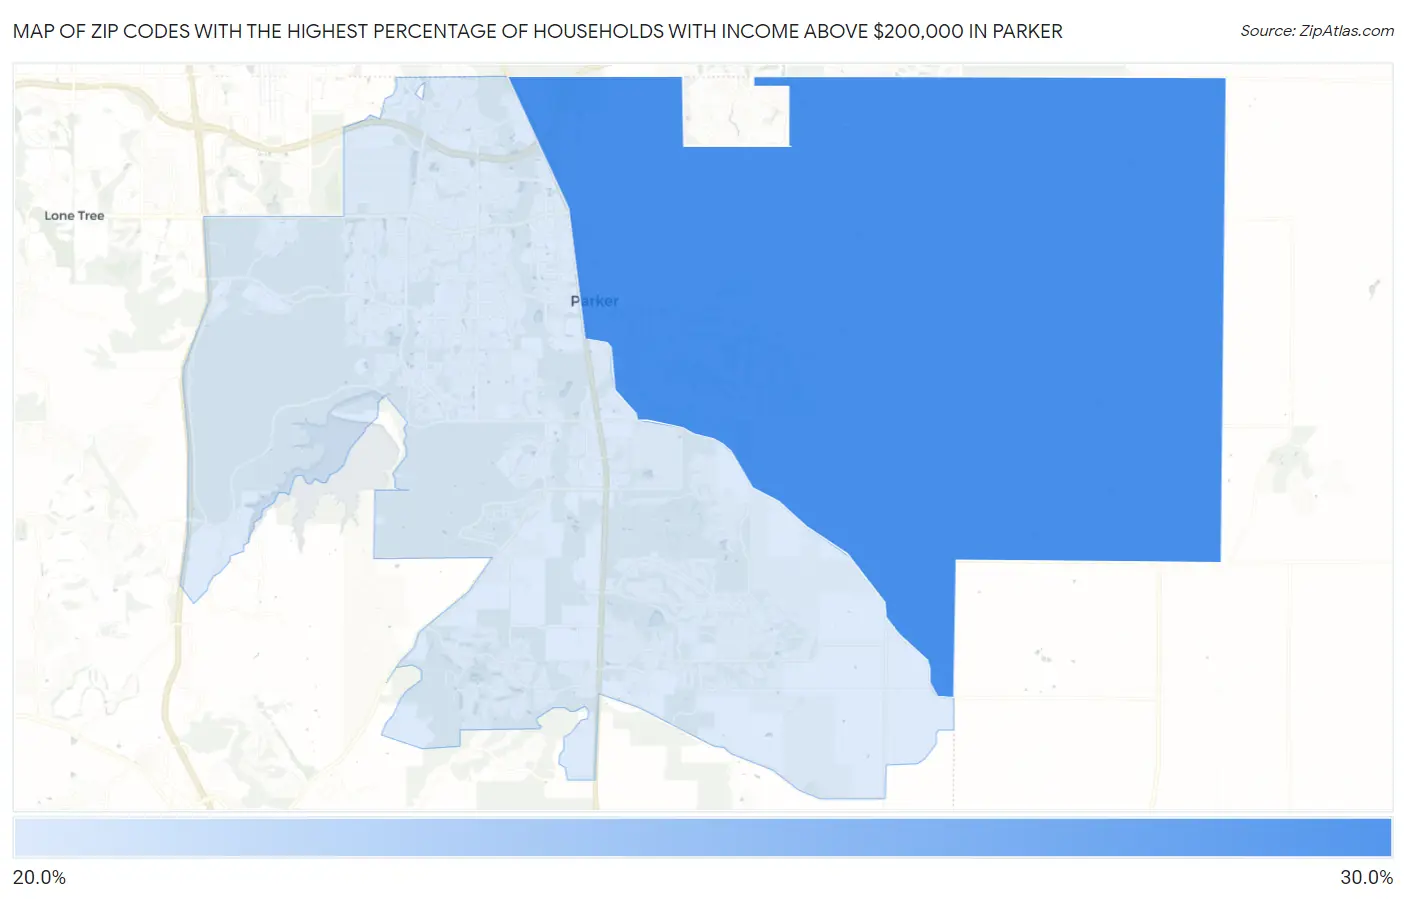
Map of Zip Codes with the Highest Percentage of Households with Income Above $200,000 in Parker
25.7%
27.4%
Zip Codes with the Highest Percentage of Households with Income Above $200,000 in Parker, CO
| Zip Code | Households with Income > $200k | vs State | vs National | |
| 1. | 80138 | 27.4% | 13.9%(+13.5)#39 | 11.4%(+16.0)#1,806 |
| 2. | 80134 | 25.7% | 13.9%(+11.8)#47 | 11.4%(+14.3)#2,059 |
1
Common Questions
What are the Top Zip Codes with the Highest Percentage of Households with Income Above $200,000 in Parker, CO?
Top Zip Codes with the Highest Percentage of Households with Income Above $200,000 in Parker, CO are:
What zip code has the Highest Percentage of Households with Income Above $200,000 in Parker, CO?
80138 has the Highest Percentage of Households with Income Above $200,000 in Parker, CO with 27.4%.
What is the Percentage of Households with Income Above $200,000 in Parker, CO?
Percentage of Households with Income Above $200,000 in Parker is 21.2%.
What is the Percentage of Households with Income Above $200,000 in Colorado?
Percentage of Households with Income Above $200,000 in Colorado is 13.9%.
What is the Percentage of Households with Income Above $200,000 in the United States?
Percentage of Households with Income Above $200,000 in the United States is 11.4%.