Zip Codes with the Highest Percentage of Population Employed in Computer & Mathematics in Denver, CO
RELATED REPORTS & OPTIONS
Computer & Mathematics
Denver
Compare Zip Codes
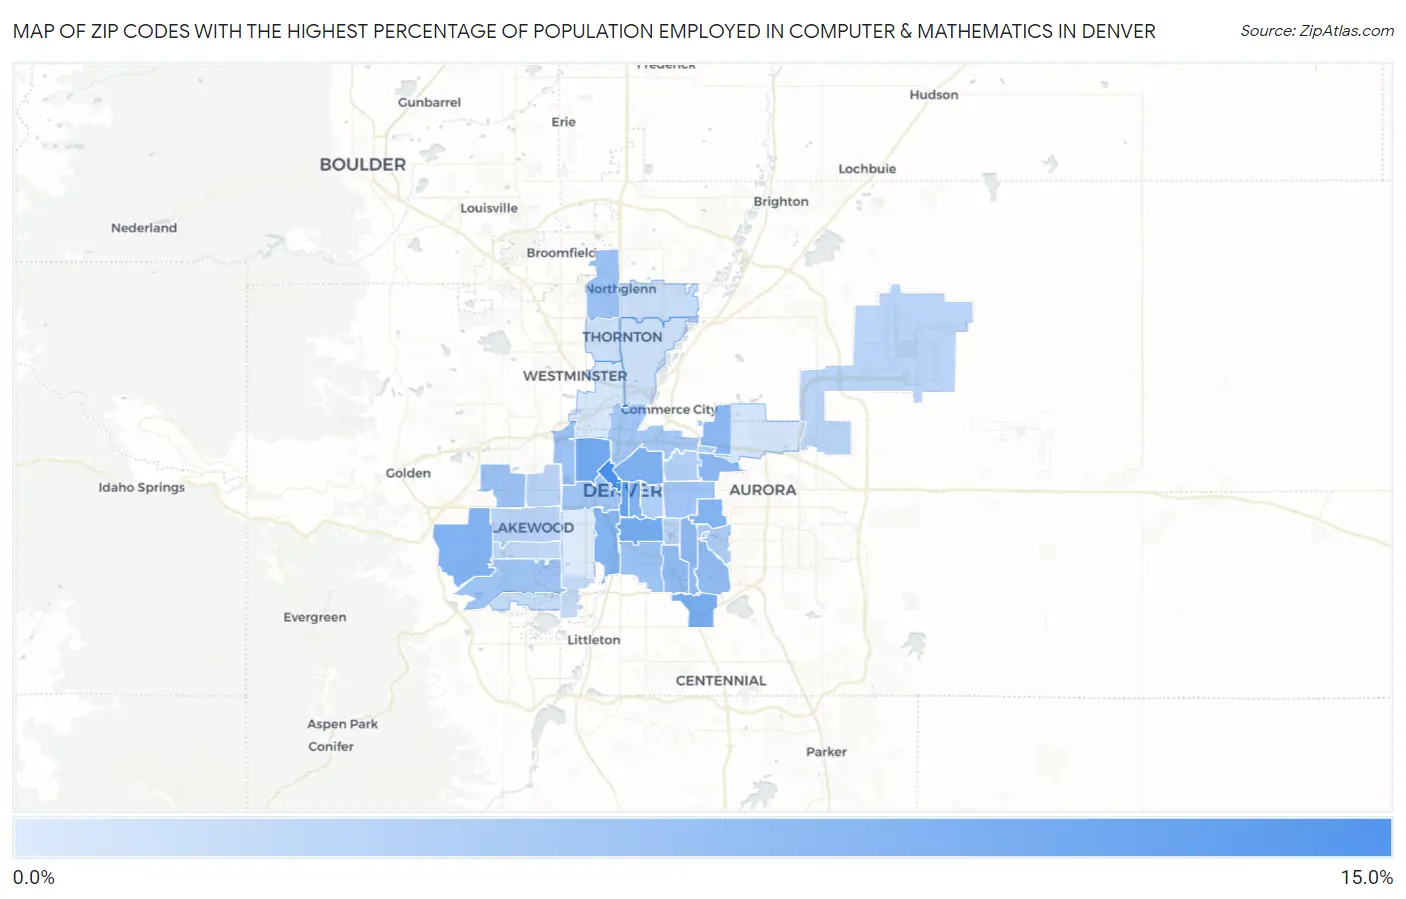
Map of Zip Codes with the Highest Percentage of Population Employed in Computer & Mathematics in Denver
1.5%
10.3%
Zip Codes with the Highest Percentage of Population Employed in Computer & Mathematics in Denver, CO
| Zip Code | % Employed | vs State | vs National | |
| 1. | 80202 | 10.3% | 4.8%(+5.51)#17 | 3.5%(+6.74)#666 |
| 2. | 80203 | 8.4% | 4.8%(+3.62)#41 | 3.5%(+4.85)#1,088 |
| 3. | 80211 | 7.6% | 4.8%(+2.88)#51 | 3.5%(+4.12)#1,337 |
| 4. | 80209 | 7.4% | 4.8%(+2.68)#53 | 3.5%(+3.91)#1,413 |
| 5. | 80237 | 7.3% | 4.8%(+2.56)#55 | 3.5%(+3.80)#1,454 |
| 6. | 80205 | 7.0% | 4.8%(+2.29)#58 | 3.5%(+3.52)#1,599 |
| 7. | 80228 | 6.9% | 4.8%(+2.12)#60 | 3.5%(+3.35)#1,690 |
| 8. | 80218 | 6.8% | 4.8%(+2.02)#65 | 3.5%(+3.25)#1,748 |
| 9. | 80223 | 6.7% | 4.8%(+1.98)#68 | 3.5%(+3.21)#1,768 |
| 10. | 80230 | 6.7% | 4.8%(+1.96)#70 | 3.5%(+3.19)#1,783 |
| 11. | 80224 | 6.2% | 4.8%(+1.43)#82 | 3.5%(+2.67)#2,151 |
| 12. | 80238 | 6.1% | 4.8%(+1.34)#84 | 3.5%(+2.58)#2,227 |
| 13. | 80222 | 5.9% | 4.8%(+1.11)#86 | 3.5%(+2.34)#2,443 |
| 14. | 80231 | 5.8% | 4.8%(+1.07)#88 | 3.5%(+2.30)#2,480 |
| 15. | 80215 | 5.4% | 4.8%(+0.647)#97 | 3.5%(+1.88)#2,895 |
| 16. | 80210 | 5.3% | 4.8%(+0.555)#100 | 3.5%(+1.79)#2,990 |
| 17. | 80212 | 5.3% | 4.8%(+0.543)#101 | 3.5%(+1.77)#3,008 |
| 18. | 80234 | 5.3% | 4.8%(+0.505)#103 | 3.5%(+1.74)#3,063 |
| 19. | 80227 | 5.0% | 4.8%(+0.259)#112 | 3.5%(+1.49)#3,339 |
| 20. | 80220 | 5.0% | 4.8%(+0.200)#117 | 3.5%(+1.43)#3,412 |
| 21. | 80204 | 5.0% | 4.8%(+0.199)#118 | 3.5%(+1.43)#3,415 |
| 22. | 80216 | 4.8% | 4.8%(+0.077)#124 | 3.5%(+1.31)#3,597 |
| 23. | 80247 | 4.2% | 4.8%(-0.546)#141 | 3.5%(+0.685)#4,595 |
| 24. | 80206 | 4.0% | 4.8%(-0.771)#152 | 3.5%(+0.460)#5,081 |
| 25. | 80207 | 3.9% | 4.8%(-0.865)#154 | 3.5%(+0.366)#5,270 |
| 26. | 80226 | 3.6% | 4.8%(-1.16)#167 | 3.5%(+0.071)#5,965 |
| 27. | 80246 | 3.6% | 4.8%(-1.16)#168 | 3.5%(+0.071)#5,966 |
| 28. | 80214 | 3.6% | 4.8%(-1.19)#169 | 3.5%(+0.046)#6,011 |
| 29. | 80249 | 3.5% | 4.8%(-1.30)#176 | 3.5%(-0.071)#6,329 |
| 30. | 80232 | 3.1% | 4.8%(-1.65)#194 | 3.5%(-0.423)#7,403 |
| 31. | 80236 | 2.9% | 4.8%(-1.83)#199 | 3.5%(-0.597)#8,009 |
| 32. | 80235 | 2.8% | 4.8%(-1.91)#204 | 3.5%(-0.677)#8,286 |
| 33. | 80233 | 2.6% | 4.8%(-2.11)#211 | 3.5%(-0.881)#9,045 |
| 34. | 80260 | 2.5% | 4.8%(-2.26)#217 | 3.5%(-1.03)#9,654 |
| 35. | 80229 | 2.4% | 4.8%(-2.32)#220 | 3.5%(-1.08)#9,873 |
| 36. | 80239 | 2.1% | 4.8%(-2.70)#239 | 3.5%(-1.47)#11,528 |
| 37. | 80221 | 1.9% | 4.8%(-2.89)#252 | 3.5%(-1.66)#12,445 |
| 38. | 80219 | 1.5% | 4.8%(-3.23)#273 | 3.5%(-2.00)#14,197 |
1
Common Questions
What are the Top 10 Zip Codes with the Highest Percentage of Population Employed in Computer & Mathematics in Denver, CO?
Top 10 Zip Codes with the Highest Percentage of Population Employed in Computer & Mathematics in Denver, CO are:
What zip code has the Highest Percentage of Population Employed in Computer & Mathematics in Denver, CO?
80202 has the Highest Percentage of Population Employed in Computer & Mathematics in Denver, CO with 10.3%.
What is the Percentage of Population Employed in Computer & Mathematics in Denver, CO?
Percentage of Population Employed in Computer & Mathematics in Denver is 5.3%.
What is the Percentage of Population Employed in Computer & Mathematics in Colorado?
Percentage of Population Employed in Computer & Mathematics in Colorado is 4.8%.
What is the Percentage of Population Employed in Computer & Mathematics in the United States?
Percentage of Population Employed in Computer & Mathematics in the United States is 3.5%.