Zip Codes with the Highest Percentage of Population Employed in Transportation & Warehousing in Denver, CO
RELATED REPORTS & OPTIONS
Transportation & Warehousing
Denver
Compare Zip Codes
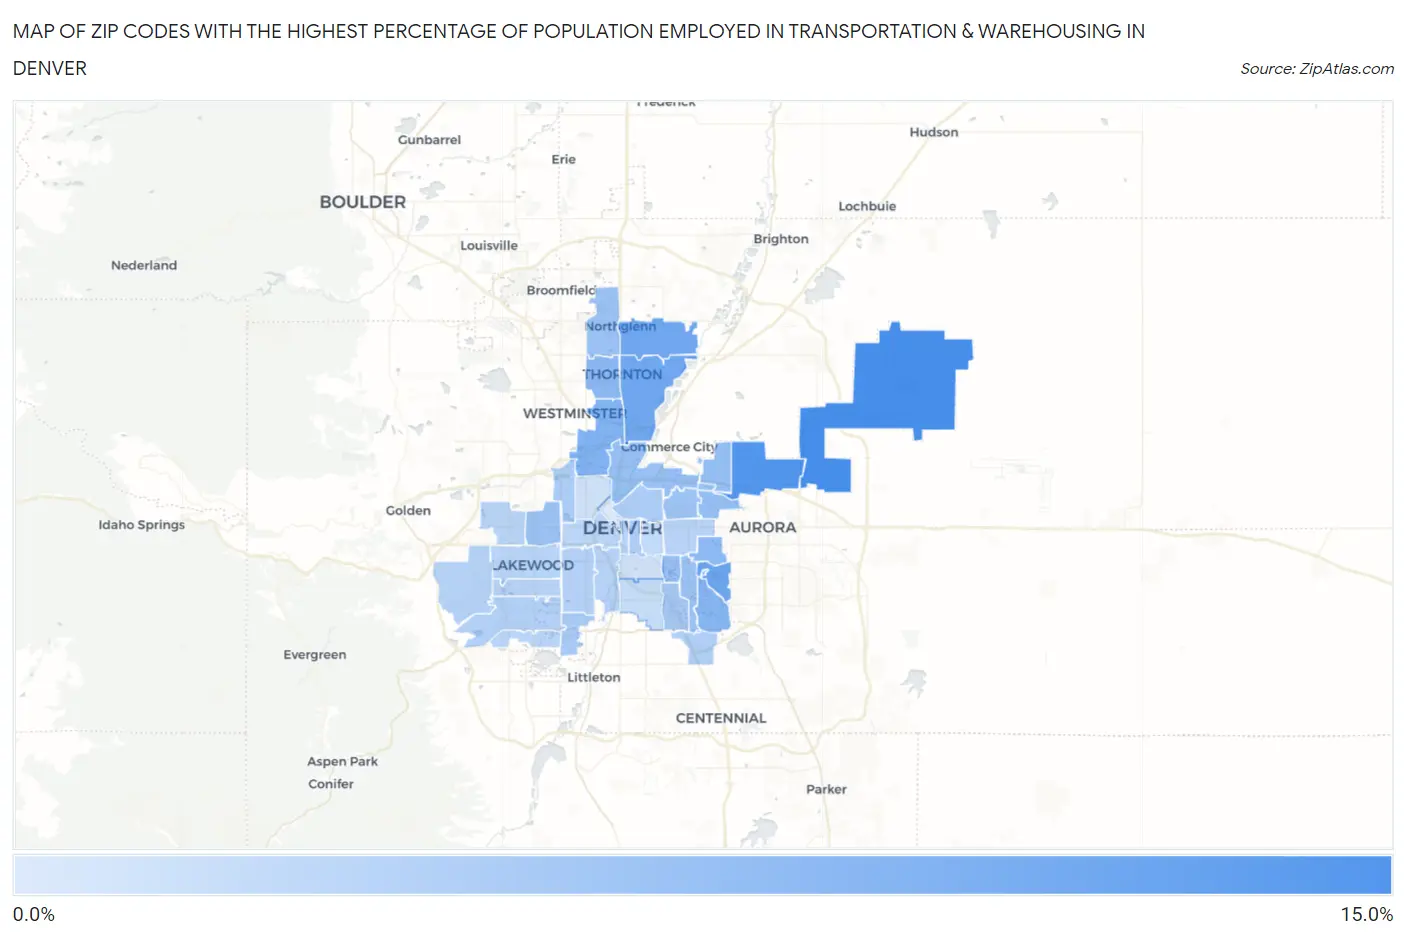
Map of Zip Codes with the Highest Percentage of Population Employed in Transportation & Warehousing in Denver
0.52%
11.0%
Zip Codes with the Highest Percentage of Population Employed in Transportation & Warehousing in Denver, CO
| Zip Code | % Employed | vs State | vs National | |
| 1. | 80249 | 11.0% | 4.2%(+6.84)#28 | 4.9%(+6.10)#2,303 |
| 2. | 80239 | 10.2% | 4.2%(+5.96)#35 | 4.9%(+5.21)#2,784 |
| 3. | 80247 | 8.2% | 4.2%(+4.04)#54 | 4.9%(+3.30)#4,584 |
| 4. | 80229 | 8.1% | 4.2%(+3.90)#58 | 4.9%(+3.15)#4,761 |
| 5. | 80233 | 8.1% | 4.2%(+3.87)#59 | 4.9%(+3.13)#4,801 |
| 6. | 80221 | 6.8% | 4.2%(+2.59)#81 | 4.9%(+1.85)#6,989 |
| 7. | 80231 | 6.3% | 4.2%(+2.14)#89 | 4.9%(+1.40)#7,941 |
| 8. | 80260 | 6.1% | 4.2%(+1.92)#99 | 4.9%(+1.18)#8,464 |
| 9. | 80230 | 5.9% | 4.2%(+1.69)#102 | 4.9%(+0.950)#9,034 |
| 10. | 80238 | 5.5% | 4.2%(+1.26)#119 | 4.9%(+0.512)#10,375 |
| 11. | 80246 | 5.3% | 4.2%(+1.07)#130 | 4.9%(+0.323)#11,004 |
| 12. | 80216 | 5.2% | 4.2%(+0.963)#136 | 4.9%(+0.219)#11,375 |
| 13. | 80214 | 5.1% | 4.2%(+0.920)#142 | 4.9%(+0.176)#11,533 |
| 14. | 80234 | 5.1% | 4.2%(+0.909)#143 | 4.9%(+0.166)#11,573 |
| 15. | 80224 | 5.0% | 4.2%(+0.824)#150 | 4.9%(+0.081)#11,862 |
| 16. | 80207 | 4.8% | 4.2%(+0.598)#160 | 4.9%(-0.145)#12,638 |
| 17. | 80222 | 4.3% | 4.2%(+0.112)#184 | 4.9%(-0.631)#14,535 |
| 18. | 80236 | 4.0% | 4.2%(-0.222)#199 | 4.9%(-0.965)#15,990 |
| 19. | 80205 | 3.9% | 4.2%(-0.339)#207 | 4.9%(-1.08)#16,520 |
| 20. | 80212 | 3.8% | 4.2%(-0.363)#210 | 4.9%(-1.11)#16,616 |
| 21. | 80218 | 3.7% | 4.2%(-0.494)#216 | 4.9%(-1.24)#17,186 |
| 22. | 80237 | 3.5% | 4.2%(-0.660)#232 | 4.9%(-1.40)#17,887 |
| 23. | 80227 | 3.4% | 4.2%(-0.837)#245 | 4.9%(-1.58)#18,638 |
| 24. | 80219 | 3.3% | 4.2%(-0.952)#259 | 4.9%(-1.70)#19,133 |
| 25. | 80228 | 3.2% | 4.2%(-1.01)#263 | 4.9%(-1.75)#19,388 |
| 26. | 80223 | 3.1% | 4.2%(-1.08)#269 | 4.9%(-1.83)#19,703 |
| 27. | 80232 | 3.0% | 4.2%(-1.19)#275 | 4.9%(-1.93)#20,173 |
| 28. | 80220 | 3.0% | 4.2%(-1.24)#279 | 4.9%(-1.99)#20,408 |
| 29. | 80203 | 3.0% | 4.2%(-1.25)#280 | 4.9%(-1.99)#20,438 |
| 30. | 80215 | 2.8% | 4.2%(-1.37)#291 | 4.9%(-2.12)#21,009 |
| 31. | 80235 | 2.8% | 4.2%(-1.38)#292 | 4.9%(-2.12)#21,018 |
| 32. | 80226 | 2.8% | 4.2%(-1.40)#294 | 4.9%(-2.14)#21,096 |
| 33. | 80204 | 2.7% | 4.2%(-1.53)#302 | 4.9%(-2.28)#21,674 |
| 34. | 80206 | 2.1% | 4.2%(-2.05)#346 | 4.9%(-2.80)#23,763 |
| 35. | 80210 | 2.0% | 4.2%(-2.19)#358 | 4.9%(-2.93)#24,231 |
| 36. | 80211 | 1.4% | 4.2%(-2.77)#392 | 4.9%(-3.52)#26,022 |
| 37. | 80209 | 1.3% | 4.2%(-2.88)#397 | 4.9%(-3.62)#26,315 |
| 38. | 80202 | 0.52% | 4.2%(-3.69)#413 | 4.9%(-4.43)#27,802 |
1
Common Questions
What are the Top 10 Zip Codes with the Highest Percentage of Population Employed in Transportation & Warehousing in Denver, CO?
Top 10 Zip Codes with the Highest Percentage of Population Employed in Transportation & Warehousing in Denver, CO are:
What zip code has the Highest Percentage of Population Employed in Transportation & Warehousing in Denver, CO?
80249 has the Highest Percentage of Population Employed in Transportation & Warehousing in Denver, CO with 11.0%.
What is the Percentage of Population Employed in Transportation & Warehousing in Denver, CO?
Percentage of Population Employed in Transportation & Warehousing in Denver is 4.2%.
What is the Percentage of Population Employed in Transportation & Warehousing in Colorado?
Percentage of Population Employed in Transportation & Warehousing in Colorado is 4.2%.
What is the Percentage of Population Employed in Transportation & Warehousing in the United States?
Percentage of Population Employed in Transportation & Warehousing in the United States is 4.9%.