Yup'ik vs Cape Verdean No Vehicles in Household
COMPARE
Yup'ik
Cape Verdean
No Vehicles in Household
No Vehicles in Household Comparison
Yup'ik
Cape Verdeans
45.9%
NO VEHICLES IN HOUSEHOLD
0.0/ 100
METRIC RATING
347th/ 347
METRIC RANK
15.6%
NO VEHICLES IN HOUSEHOLD
0.0/ 100
METRIC RATING
310th/ 347
METRIC RANK
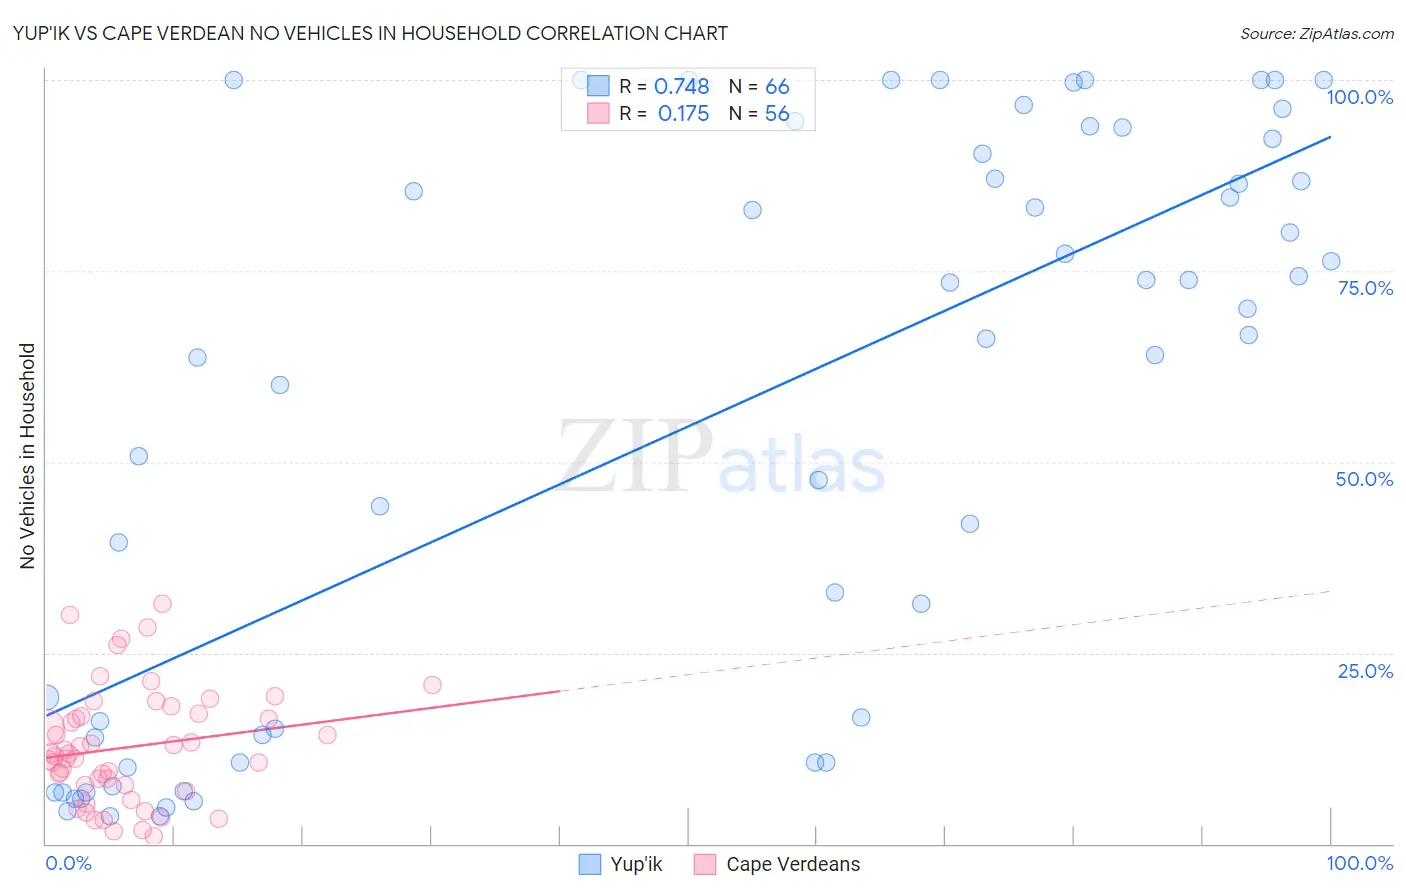
Yup'ik vs Cape Verdean No Vehicles in Household Correlation Chart
The statistical analysis conducted on geographies consisting of 39,930,704 people shows a strong positive correlation between the proportion of Yup'ik and percentage of households with no vehicle available in the United States with a correlation coefficient (R) of 0.748 and weighted average of 45.9%. Similarly, the statistical analysis conducted on geographies consisting of 107,427,210 people shows a poor positive correlation between the proportion of Cape Verdeans and percentage of households with no vehicle available in the United States with a correlation coefficient (R) of 0.175 and weighted average of 15.6%, a difference of 194.7%.
No Vehicles in Household Correlation Summary
| Measurement | Yup'ik | Cape Verdean |
| Minimum | 3.5% | 1.0% |
| Maximum | 100.0% | 31.5% |
| Range | 96.5% | 30.4% |
| Mean | 55.6% | 12.6% |
| Median | 66.4% | 11.6% |
| Interquartile 25% (IQ1) | 14.0% | 7.6% |
| Interquartile 75% (IQ3) | 90.4% | 16.9% |
| Interquartile Range (IQR) | 76.4% | 9.2% |
| Standard Deviation (Sample) | 37.0% | 7.4% |
| Standard Deviation (Population) | 36.7% | 7.3% |
Similar Demographics by No Vehicles in Household
Demographics Similar to Yup'ik by No Vehicles in Household
In terms of no vehicles in household, the demographic groups most similar to Yup'ik are Immigrants from Grenada (37.5%, a difference of 22.5%), Immigrants from St. Vincent and the Grenadines (35.4%, a difference of 29.6%), Immigrants from Dominican Republic (31.4%, a difference of 46.0%), Inupiat (29.9%, a difference of 53.6%), and British West Indian (29.7%, a difference of 54.3%).
| Demographics | Rating | Rank | No Vehicles in Household |
| Immigrants | Trinidad and Tobago | 0.0 /100 | #333 | Tragic 24.6% |
| Immigrants | Bangladesh | 0.0 /100 | #334 | Tragic 25.8% |
| Barbadians | 0.0 /100 | #335 | Tragic 26.1% |
| Vietnamese | 0.0 /100 | #336 | Tragic 26.2% |
| Immigrants | Uzbekistan | 0.0 /100 | #337 | Tragic 26.7% |
| Guyanese | 0.0 /100 | #338 | Tragic 29.3% |
| Dominicans | 0.0 /100 | #339 | Tragic 29.4% |
| Immigrants | Barbados | 0.0 /100 | #340 | Tragic 29.5% |
| Immigrants | Guyana | 0.0 /100 | #341 | Tragic 29.5% |
| British West Indians | 0.0 /100 | #342 | Tragic 29.7% |
| Inupiat | 0.0 /100 | #343 | Tragic 29.9% |
| Immigrants | Dominican Republic | 0.0 /100 | #344 | Tragic 31.4% |
| Immigrants | St. Vincent and the Grenadines | 0.0 /100 | #345 | Tragic 35.4% |
| Immigrants | Grenada | 0.0 /100 | #346 | Tragic 37.5% |
| Yup'ik | 0.0 /100 | #347 | Tragic 45.9% |
Demographics Similar to Cape Verdeans by No Vehicles in Household
In terms of no vehicles in household, the demographic groups most similar to Cape Verdeans are Immigrants from Israel (15.6%, a difference of 0.010%), Alaskan Athabascan (15.6%, a difference of 0.16%), Tohono O'odham (15.6%, a difference of 0.31%), Albanian (15.6%, a difference of 0.48%), and Puerto Rican (15.5%, a difference of 0.56%).
| Demographics | Rating | Rank | No Vehicles in Household |
| Immigrants | Western Africa | 0.0 /100 | #303 | Tragic 15.0% |
| Immigrants | Russia | 0.0 /100 | #304 | Tragic 15.1% |
| Immigrants | China | 0.0 /100 | #305 | Tragic 15.2% |
| Immigrants | Belize | 0.0 /100 | #306 | Tragic 15.4% |
| Immigrants | Haiti | 0.0 /100 | #307 | Tragic 15.4% |
| U.S. Virgin Islanders | 0.0 /100 | #308 | Tragic 15.4% |
| Puerto Ricans | 0.0 /100 | #309 | Tragic 15.5% |
| Cape Verdeans | 0.0 /100 | #310 | Tragic 15.6% |
| Immigrants | Israel | 0.0 /100 | #311 | Tragic 15.6% |
| Alaskan Athabascans | 0.0 /100 | #312 | Tragic 15.6% |
| Tohono O'odham | 0.0 /100 | #313 | Tragic 15.6% |
| Albanians | 0.0 /100 | #314 | Tragic 15.6% |
| Cypriots | 0.0 /100 | #315 | Tragic 15.7% |
| Ghanaians | 0.0 /100 | #316 | Tragic 16.4% |
| Immigrants | Ghana | 0.0 /100 | #317 | Tragic 16.6% |