Yup'ik vs Immigrants from Czechoslovakia No Vehicles in Household
COMPARE
Yup'ik
Immigrants from Czechoslovakia
No Vehicles in Household
No Vehicles in Household Comparison
Yup'ik
Immigrants from Czechoslovakia
45.9%
NO VEHICLES IN HOUSEHOLD
0.0/ 100
METRIC RATING
347th/ 347
METRIC RANK
11.8%
NO VEHICLES IN HOUSEHOLD
2.0/ 100
METRIC RATING
247th/ 347
METRIC RANK
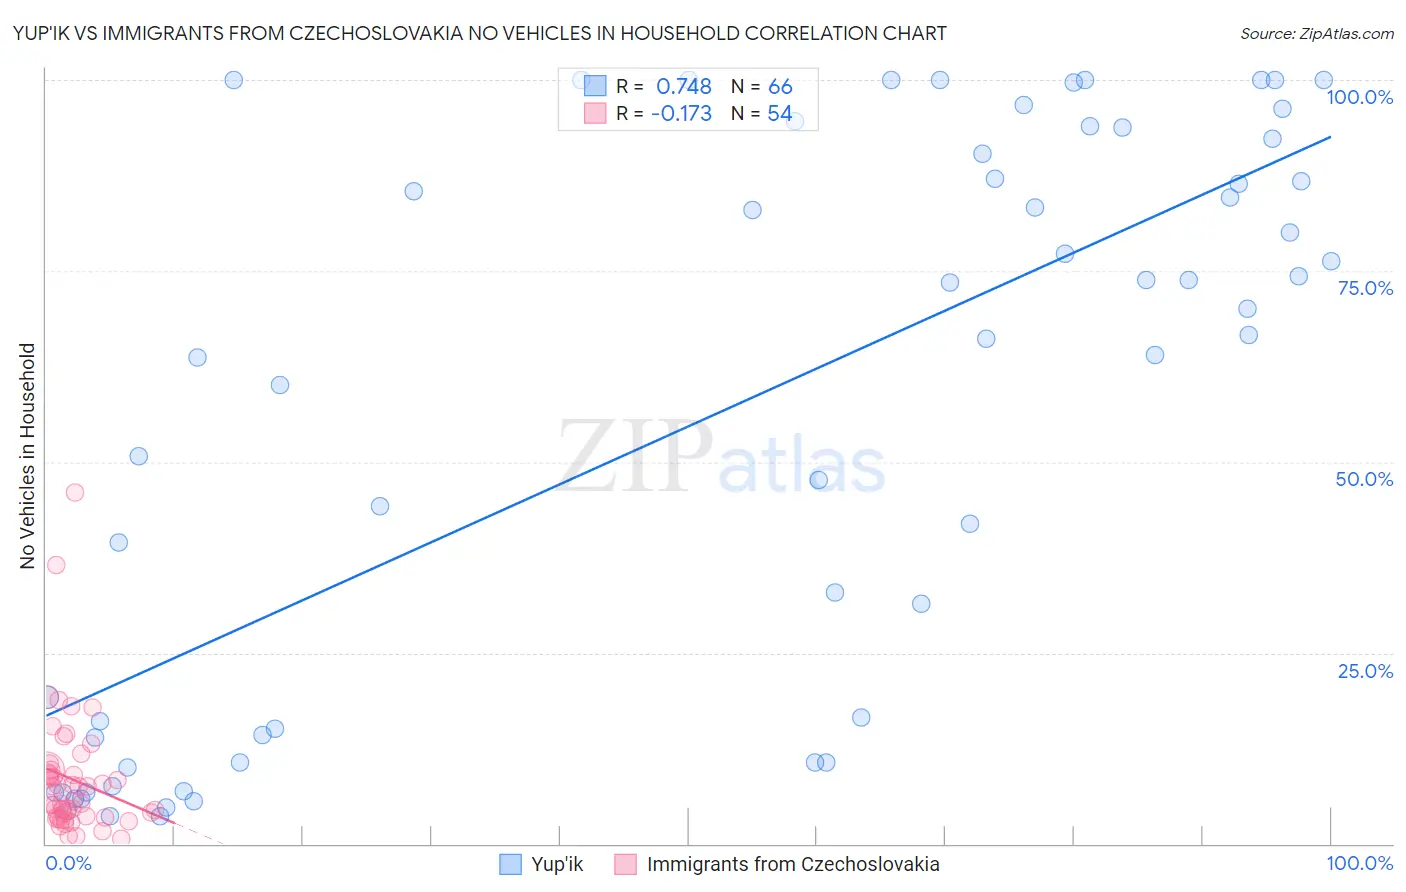
Yup'ik vs Immigrants from Czechoslovakia No Vehicles in Household Correlation Chart
The statistical analysis conducted on geographies consisting of 39,930,704 people shows a strong positive correlation between the proportion of Yup'ik and percentage of households with no vehicle available in the United States with a correlation coefficient (R) of 0.748 and weighted average of 45.9%. Similarly, the statistical analysis conducted on geographies consisting of 195,341,249 people shows a poor negative correlation between the proportion of Immigrants from Czechoslovakia and percentage of households with no vehicle available in the United States with a correlation coefficient (R) of -0.173 and weighted average of 11.8%, a difference of 289.4%.
No Vehicles in Household Correlation Summary
| Measurement | Yup'ik | Immigrants from Czechoslovakia |
| Minimum | 3.5% | 0.65% |
| Maximum | 100.0% | 46.0% |
| Range | 96.5% | 45.4% |
| Mean | 55.6% | 8.4% |
| Median | 66.4% | 5.4% |
| Interquartile 25% (IQ1) | 14.0% | 3.6% |
| Interquartile 75% (IQ3) | 90.4% | 9.7% |
| Interquartile Range (IQR) | 76.4% | 6.1% |
| Standard Deviation (Sample) | 37.0% | 8.1% |
| Standard Deviation (Population) | 36.7% | 8.0% |
Similar Demographics by No Vehicles in Household
Demographics Similar to Yup'ik by No Vehicles in Household
In terms of no vehicles in household, the demographic groups most similar to Yup'ik are Immigrants from Grenada (37.5%, a difference of 22.5%), Immigrants from St. Vincent and the Grenadines (35.4%, a difference of 29.6%), Immigrants from Dominican Republic (31.4%, a difference of 46.0%), Inupiat (29.9%, a difference of 53.6%), and British West Indian (29.7%, a difference of 54.3%).
| Demographics | Rating | Rank | No Vehicles in Household |
| Immigrants | Trinidad and Tobago | 0.0 /100 | #333 | Tragic 24.6% |
| Immigrants | Bangladesh | 0.0 /100 | #334 | Tragic 25.8% |
| Barbadians | 0.0 /100 | #335 | Tragic 26.1% |
| Vietnamese | 0.0 /100 | #336 | Tragic 26.2% |
| Immigrants | Uzbekistan | 0.0 /100 | #337 | Tragic 26.7% |
| Guyanese | 0.0 /100 | #338 | Tragic 29.3% |
| Dominicans | 0.0 /100 | #339 | Tragic 29.4% |
| Immigrants | Barbados | 0.0 /100 | #340 | Tragic 29.5% |
| Immigrants | Guyana | 0.0 /100 | #341 | Tragic 29.5% |
| British West Indians | 0.0 /100 | #342 | Tragic 29.7% |
| Inupiat | 0.0 /100 | #343 | Tragic 29.9% |
| Immigrants | Dominican Republic | 0.0 /100 | #344 | Tragic 31.4% |
| Immigrants | St. Vincent and the Grenadines | 0.0 /100 | #345 | Tragic 35.4% |
| Immigrants | Grenada | 0.0 /100 | #346 | Tragic 37.5% |
| Yup'ik | 0.0 /100 | #347 | Tragic 45.9% |
Demographics Similar to Immigrants from Czechoslovakia by No Vehicles in Household
In terms of no vehicles in household, the demographic groups most similar to Immigrants from Czechoslovakia are Immigrants from Belgium (11.8%, a difference of 0.010%), Immigrants from Nigeria (11.8%, a difference of 0.040%), Menominee (11.8%, a difference of 0.050%), Immigrants from Honduras (11.8%, a difference of 0.22%), and Paiute (11.8%, a difference of 0.26%).
| Demographics | Rating | Rank | No Vehicles in Household |
| Immigrants | Immigrants | 2.7 /100 | #240 | Tragic 11.7% |
| Eastern Europeans | 2.7 /100 | #241 | Tragic 11.7% |
| Turks | 2.6 /100 | #242 | Tragic 11.7% |
| Cheyenne | 2.4 /100 | #243 | Tragic 11.7% |
| Immigrants | Portugal | 2.2 /100 | #244 | Tragic 11.7% |
| Immigrants | Honduras | 2.1 /100 | #245 | Tragic 11.8% |
| Menominee | 2.0 /100 | #246 | Tragic 11.8% |
| Immigrants | Czechoslovakia | 2.0 /100 | #247 | Tragic 11.8% |
| Immigrants | Belgium | 1.9 /100 | #248 | Tragic 11.8% |
| Immigrants | Nigeria | 1.9 /100 | #249 | Tragic 11.8% |
| Paiute | 1.8 /100 | #250 | Tragic 11.8% |
| Blacks/African Americans | 1.6 /100 | #251 | Tragic 11.9% |
| Immigrants | Serbia | 1.5 /100 | #252 | Tragic 11.9% |
| Egyptians | 1.4 /100 | #253 | Tragic 11.9% |
| Immigrants | Uruguay | 1.3 /100 | #254 | Tragic 11.9% |