Immigrants from Dominica vs Cape Verdean No Vehicles in Household
COMPARE
Immigrants from Dominica
Cape Verdean
No Vehicles in Household
No Vehicles in Household Comparison
Immigrants from Dominica
Cape Verdeans
22.2%
NO VEHICLES IN HOUSEHOLD
0.0/ 100
METRIC RATING
328th/ 347
METRIC RANK
15.6%
NO VEHICLES IN HOUSEHOLD
0.0/ 100
METRIC RATING
310th/ 347
METRIC RANK
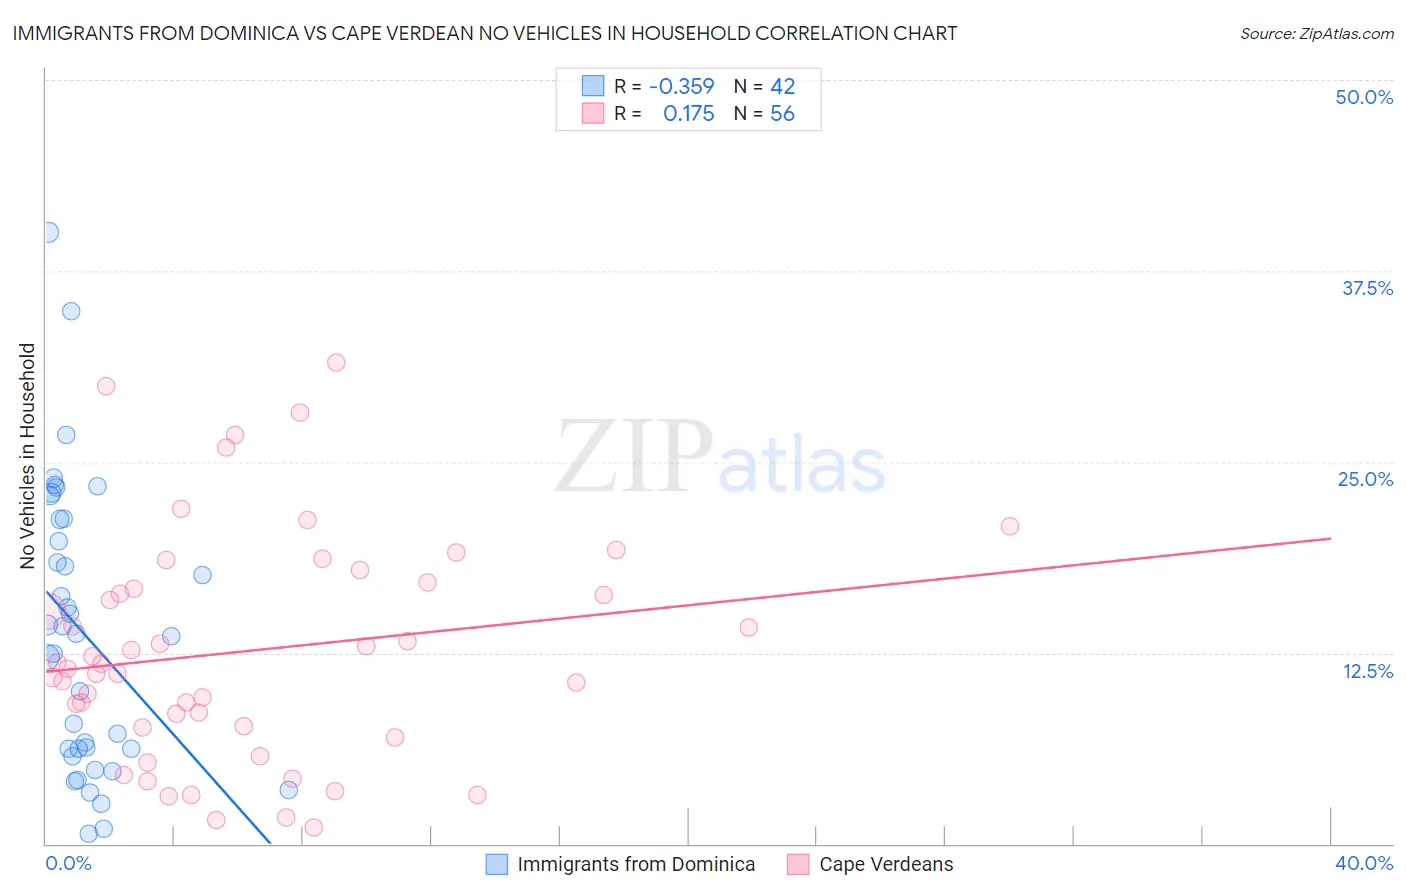
Immigrants from Dominica vs Cape Verdean No Vehicles in Household Correlation Chart
The statistical analysis conducted on geographies consisting of 83,752,468 people shows a mild negative correlation between the proportion of Immigrants from Dominica and percentage of households with no vehicle available in the United States with a correlation coefficient (R) of -0.359 and weighted average of 22.2%. Similarly, the statistical analysis conducted on geographies consisting of 107,427,210 people shows a poor positive correlation between the proportion of Cape Verdeans and percentage of households with no vehicle available in the United States with a correlation coefficient (R) of 0.175 and weighted average of 15.6%, a difference of 42.8%.
No Vehicles in Household Correlation Summary
| Measurement | Immigrants from Dominica | Cape Verdean |
| Minimum | 0.64% | 1.0% |
| Maximum | 40.0% | 31.5% |
| Range | 39.4% | 30.4% |
| Mean | 13.7% | 12.6% |
| Median | 13.7% | 11.6% |
| Interquartile 25% (IQ1) | 6.2% | 7.6% |
| Interquartile 75% (IQ3) | 21.2% | 16.9% |
| Interquartile Range (IQR) | 15.1% | 9.2% |
| Standard Deviation (Sample) | 9.3% | 7.4% |
| Standard Deviation (Population) | 9.2% | 7.3% |
Demographics Similar to Immigrants from Dominica and Cape Verdeans by No Vehicles in Household
In terms of no vehicles in household, the demographic groups most similar to Immigrants from Dominica are Ecuadorian (22.8%, a difference of 2.3%), Immigrants from Senegal (21.1%, a difference of 5.1%), Immigrants from West Indies (20.5%, a difference of 8.3%), Senegalese (19.8%, a difference of 12.6%), and Immigrants from Caribbean (19.6%, a difference of 13.4%). Similarly, the demographic groups most similar to Cape Verdeans are Immigrants from Israel (15.6%, a difference of 0.010%), Alaskan Athabascan (15.6%, a difference of 0.16%), Tohono O'odham (15.6%, a difference of 0.31%), Albanian (15.6%, a difference of 0.48%), and Puerto Rican (15.5%, a difference of 0.56%).
| Demographics | Rating | Rank | No Vehicles in Household |
| Puerto Ricans | 0.0 /100 | #309 | Tragic 15.5% |
| Cape Verdeans | 0.0 /100 | #310 | Tragic 15.6% |
| Immigrants | Israel | 0.0 /100 | #311 | Tragic 15.6% |
| Alaskan Athabascans | 0.0 /100 | #312 | Tragic 15.6% |
| Tohono O'odham | 0.0 /100 | #313 | Tragic 15.6% |
| Albanians | 0.0 /100 | #314 | Tragic 15.6% |
| Cypriots | 0.0 /100 | #315 | Tragic 15.7% |
| Ghanaians | 0.0 /100 | #316 | Tragic 16.4% |
| Immigrants | Ghana | 0.0 /100 | #317 | Tragic 16.6% |
| Immigrants | Belarus | 0.0 /100 | #318 | Tragic 16.7% |
| Alaska Natives | 0.0 /100 | #319 | Tragic 17.4% |
| Soviet Union | 0.0 /100 | #320 | Tragic 17.4% |
| Jamaicans | 0.0 /100 | #321 | Tragic 17.9% |
| Immigrants | Cabo Verde | 0.0 /100 | #322 | Tragic 18.4% |
| Immigrants | Yemen | 0.0 /100 | #323 | Tragic 19.5% |
| Immigrants | Caribbean | 0.0 /100 | #324 | Tragic 19.6% |
| Senegalese | 0.0 /100 | #325 | Tragic 19.8% |
| Immigrants | West Indies | 0.0 /100 | #326 | Tragic 20.5% |
| Immigrants | Senegal | 0.0 /100 | #327 | Tragic 21.1% |
| Immigrants | Dominica | 0.0 /100 | #328 | Tragic 22.2% |
| Ecuadorians | 0.0 /100 | #329 | Tragic 22.8% |