Palestinian vs Cape Verdean No Vehicles in Household
COMPARE
Palestinian
Cape Verdean
No Vehicles in Household
No Vehicles in Household Comparison
Palestinians
Cape Verdeans
8.3%
NO VEHICLES IN HOUSEHOLD
99.7/ 100
METRIC RATING
66th/ 347
METRIC RANK
15.6%
NO VEHICLES IN HOUSEHOLD
0.0/ 100
METRIC RATING
310th/ 347
METRIC RANK
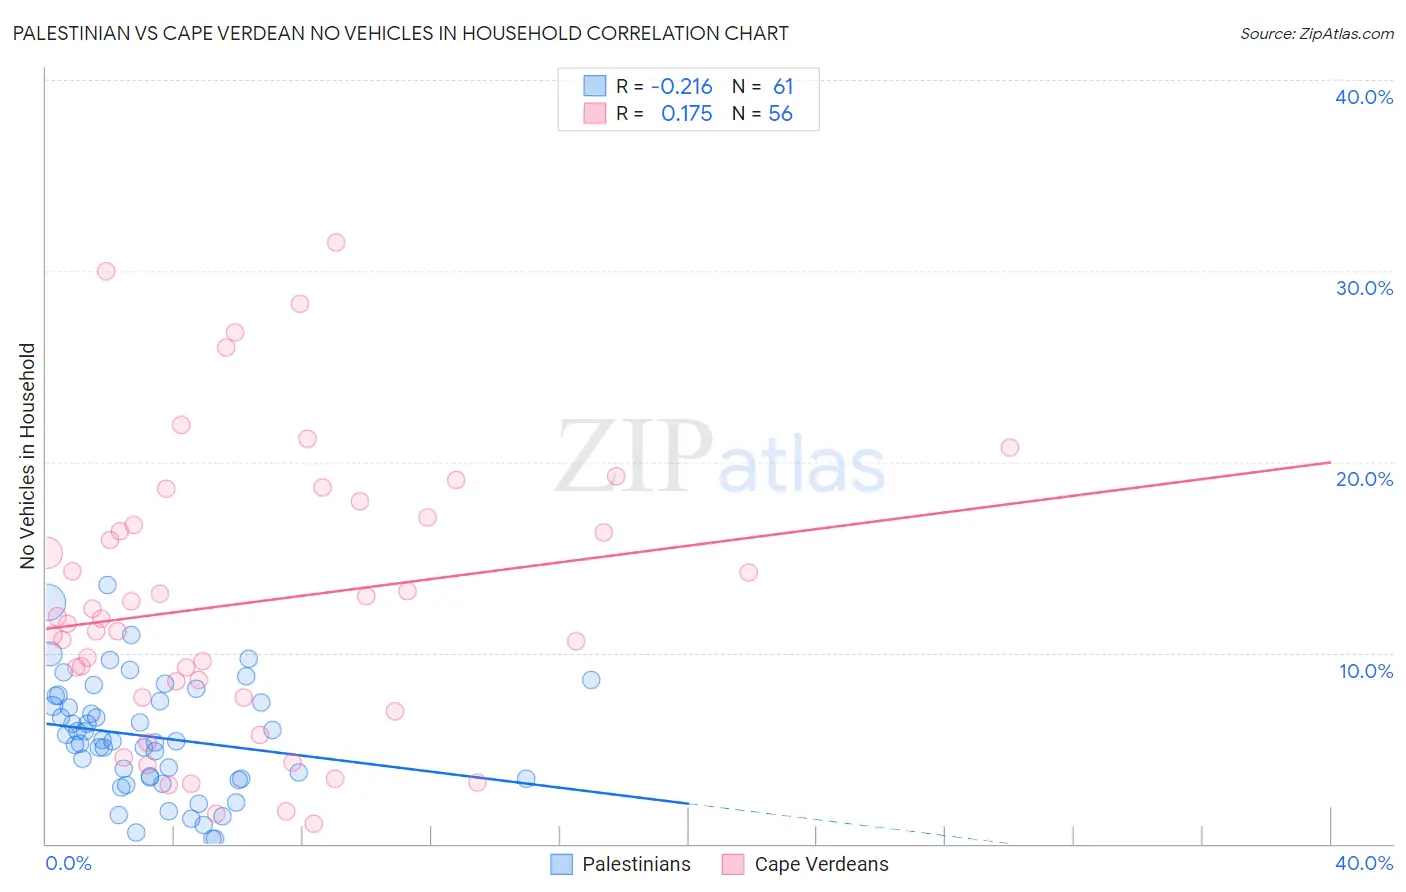
Palestinian vs Cape Verdean No Vehicles in Household Correlation Chart
The statistical analysis conducted on geographies consisting of 216,223,800 people shows a weak negative correlation between the proportion of Palestinians and percentage of households with no vehicle available in the United States with a correlation coefficient (R) of -0.216 and weighted average of 8.3%. Similarly, the statistical analysis conducted on geographies consisting of 107,427,210 people shows a poor positive correlation between the proportion of Cape Verdeans and percentage of households with no vehicle available in the United States with a correlation coefficient (R) of 0.175 and weighted average of 15.6%, a difference of 86.9%.
No Vehicles in Household Correlation Summary
| Measurement | Palestinian | Cape Verdean |
| Minimum | 0.29% | 1.0% |
| Maximum | 13.6% | 31.5% |
| Range | 13.3% | 30.4% |
| Mean | 5.6% | 12.6% |
| Median | 5.4% | 11.6% |
| Interquartile 25% (IQ1) | 3.4% | 7.6% |
| Interquartile 75% (IQ3) | 7.6% | 16.9% |
| Interquartile Range (IQR) | 4.2% | 9.2% |
| Standard Deviation (Sample) | 3.0% | 7.4% |
| Standard Deviation (Population) | 3.0% | 7.3% |
Similar Demographics by No Vehicles in Household
Demographics Similar to Palestinians by No Vehicles in Household
In terms of no vehicles in household, the demographic groups most similar to Palestinians are Immigrants from Scotland (8.3%, a difference of 0.010%), Canadian (8.3%, a difference of 0.11%), Immigrants from Iran (8.4%, a difference of 0.41%), Spaniard (8.4%, a difference of 0.46%), and Croatian (8.3%, a difference of 0.86%).
| Demographics | Rating | Rank | No Vehicles in Household |
| Immigrants | India | 99.8 /100 | #59 | Exceptional 8.2% |
| Immigrants | Laos | 99.8 /100 | #60 | Exceptional 8.2% |
| Thais | 99.8 /100 | #61 | Exceptional 8.2% |
| Chinese | 99.8 /100 | #62 | Exceptional 8.2% |
| Slovaks | 99.8 /100 | #63 | Exceptional 8.3% |
| Croatians | 99.8 /100 | #64 | Exceptional 8.3% |
| Canadians | 99.7 /100 | #65 | Exceptional 8.3% |
| Palestinians | 99.7 /100 | #66 | Exceptional 8.3% |
| Immigrants | Scotland | 99.7 /100 | #67 | Exceptional 8.3% |
| Immigrants | Iran | 99.7 /100 | #68 | Exceptional 8.4% |
| Spaniards | 99.7 /100 | #69 | Exceptional 8.4% |
| Cajuns | 99.6 /100 | #70 | Exceptional 8.4% |
| Immigrants | Lebanon | 99.6 /100 | #71 | Exceptional 8.4% |
| Lithuanians | 99.6 /100 | #72 | Exceptional 8.4% |
| Poles | 99.6 /100 | #73 | Exceptional 8.4% |
Demographics Similar to Cape Verdeans by No Vehicles in Household
In terms of no vehicles in household, the demographic groups most similar to Cape Verdeans are Immigrants from Israel (15.6%, a difference of 0.010%), Alaskan Athabascan (15.6%, a difference of 0.16%), Tohono O'odham (15.6%, a difference of 0.31%), Albanian (15.6%, a difference of 0.48%), and Puerto Rican (15.5%, a difference of 0.56%).
| Demographics | Rating | Rank | No Vehicles in Household |
| Immigrants | Western Africa | 0.0 /100 | #303 | Tragic 15.0% |
| Immigrants | Russia | 0.0 /100 | #304 | Tragic 15.1% |
| Immigrants | China | 0.0 /100 | #305 | Tragic 15.2% |
| Immigrants | Belize | 0.0 /100 | #306 | Tragic 15.4% |
| Immigrants | Haiti | 0.0 /100 | #307 | Tragic 15.4% |
| U.S. Virgin Islanders | 0.0 /100 | #308 | Tragic 15.4% |
| Puerto Ricans | 0.0 /100 | #309 | Tragic 15.5% |
| Cape Verdeans | 0.0 /100 | #310 | Tragic 15.6% |
| Immigrants | Israel | 0.0 /100 | #311 | Tragic 15.6% |
| Alaskan Athabascans | 0.0 /100 | #312 | Tragic 15.6% |
| Tohono O'odham | 0.0 /100 | #313 | Tragic 15.6% |
| Albanians | 0.0 /100 | #314 | Tragic 15.6% |
| Cypriots | 0.0 /100 | #315 | Tragic 15.7% |
| Ghanaians | 0.0 /100 | #316 | Tragic 16.4% |
| Immigrants | Ghana | 0.0 /100 | #317 | Tragic 16.6% |