Vietnamese vs Immigrants from Bahamas 1 or more Vehicles in Household
COMPARE
Vietnamese
Immigrants from Bahamas
1 or more Vehicles in Household
1 or more Vehicles in Household Comparison
Vietnamese
Immigrants from Bahamas
73.8%
1 OR MORE VEHICLES IN HOUSEHOLD
0.0/ 100
METRIC RATING
336th/ 347
METRIC RANK
90.2%
1 OR MORE VEHICLES IN HOUSEHOLD
81.5/ 100
METRIC RATING
143rd/ 347
METRIC RANK
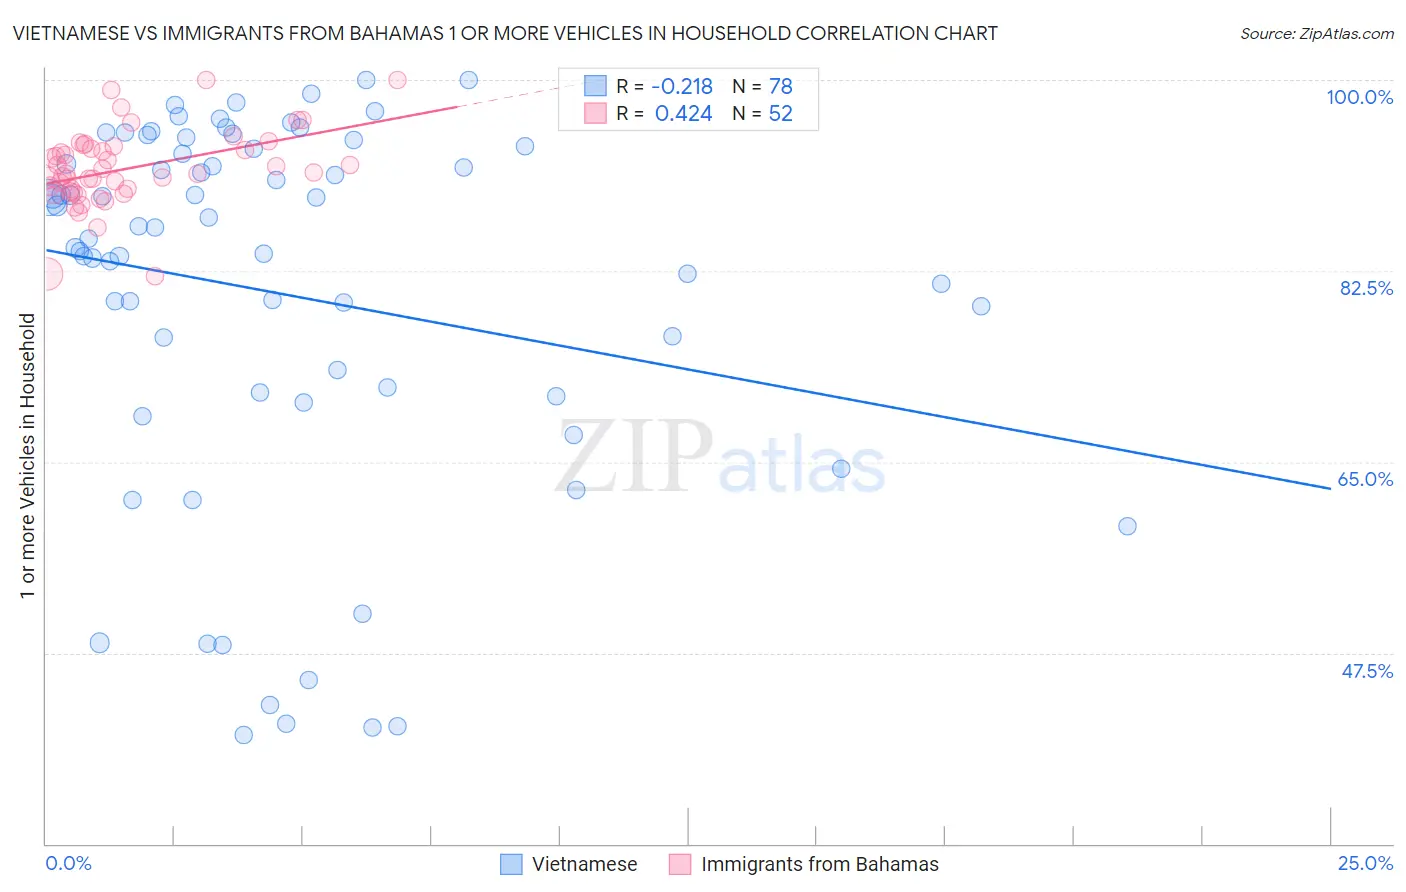
Vietnamese vs Immigrants from Bahamas 1 or more Vehicles in Household Correlation Chart
The statistical analysis conducted on geographies consisting of 170,683,703 people shows a weak negative correlation between the proportion of Vietnamese and percentage of households with 1 or more vehicles available in the United States with a correlation coefficient (R) of -0.218 and weighted average of 73.8%. Similarly, the statistical analysis conducted on geographies consisting of 104,615,512 people shows a moderate positive correlation between the proportion of Immigrants from Bahamas and percentage of households with 1 or more vehicles available in the United States with a correlation coefficient (R) of 0.424 and weighted average of 90.2%, a difference of 22.2%.
1 or more Vehicles in Household Correlation Summary
| Measurement | Vietnamese | Immigrants from Bahamas |
| Minimum | 39.9% | 82.0% |
| Maximum | 100.0% | 100.0% |
| Range | 60.1% | 18.0% |
| Mean | 80.4% | 91.9% |
| Median | 86.0% | 91.5% |
| Interquartile 25% (IQ1) | 71.3% | 89.9% |
| Interquartile 75% (IQ3) | 93.7% | 93.8% |
| Interquartile Range (IQR) | 22.4% | 3.9% |
| Standard Deviation (Sample) | 17.1% | 3.6% |
| Standard Deviation (Population) | 17.0% | 3.5% |
Similar Demographics by 1 or more Vehicles in Household
Demographics Similar to Vietnamese by 1 or more Vehicles in Household
In terms of 1 or more vehicles in household, the demographic groups most similar to Vietnamese are Barbadian (74.0%, a difference of 0.21%), Immigrants from Uzbekistan (73.4%, a difference of 0.62%), Immigrants from Bangladesh (74.3%, a difference of 0.65%), Inupiat (71.5%, a difference of 3.2%), and Immigrants from Ecuador (76.2%, a difference of 3.3%).
| Demographics | Rating | Rank | 1 or more Vehicles in Household |
| Immigrants | Dominica | 0.0 /100 | #329 | Tragic 77.8% |
| Immigrants | Trinidad and Tobago | 0.0 /100 | #330 | Tragic 76.8% |
| West Indians | 0.0 /100 | #331 | Tragic 76.4% |
| Trinidadians and Tobagonians | 0.0 /100 | #332 | Tragic 76.3% |
| Immigrants | Ecuador | 0.0 /100 | #333 | Tragic 76.2% |
| Immigrants | Bangladesh | 0.0 /100 | #334 | Tragic 74.3% |
| Barbadians | 0.0 /100 | #335 | Tragic 74.0% |
| Vietnamese | 0.0 /100 | #336 | Tragic 73.8% |
| Immigrants | Uzbekistan | 0.0 /100 | #337 | Tragic 73.4% |
| Inupiat | 0.0 /100 | #338 | Tragic 71.5% |
| Guyanese | 0.0 /100 | #339 | Tragic 70.8% |
| Dominicans | 0.0 /100 | #340 | Tragic 70.7% |
| Immigrants | Barbados | 0.0 /100 | #341 | Tragic 70.6% |
| Immigrants | Guyana | 0.0 /100 | #342 | Tragic 70.6% |
| British West Indians | 0.0 /100 | #343 | Tragic 70.4% |
Demographics Similar to Immigrants from Bahamas by 1 or more Vehicles in Household
In terms of 1 or more vehicles in household, the demographic groups most similar to Immigrants from Bahamas are Immigrants from Zimbabwe (90.2%, a difference of 0.0%), Sioux (90.2%, a difference of 0.010%), Bahamian (90.2%, a difference of 0.030%), Immigrants from Moldova (90.2%, a difference of 0.040%), and Immigrants from Lithuania (90.2%, a difference of 0.040%).
| Demographics | Rating | Rank | 1 or more Vehicles in Household |
| Hungarians | 86.5 /100 | #136 | Excellent 90.3% |
| Latvians | 86.3 /100 | #137 | Excellent 90.3% |
| Syrians | 86.3 /100 | #138 | Excellent 90.3% |
| Estonians | 85.6 /100 | #139 | Excellent 90.3% |
| Sudanese | 85.2 /100 | #140 | Excellent 90.3% |
| Immigrants | Moldova | 83.1 /100 | #141 | Excellent 90.2% |
| Immigrants | Lithuania | 83.0 /100 | #142 | Excellent 90.2% |
| Immigrants | Bahamas | 81.5 /100 | #143 | Excellent 90.2% |
| Immigrants | Zimbabwe | 81.5 /100 | #144 | Excellent 90.2% |
| Sioux | 81.3 /100 | #145 | Excellent 90.2% |
| Bahamians | 80.5 /100 | #146 | Excellent 90.2% |
| Chileans | 79.8 /100 | #147 | Good 90.2% |
| Immigrants | Eastern Africa | 78.2 /100 | #148 | Good 90.1% |
| Immigrants | Nicaragua | 76.7 /100 | #149 | Good 90.1% |
| Immigrants | Micronesia | 75.9 /100 | #150 | Good 90.1% |