Vietnamese vs Czechoslovakian Master's Degree
COMPARE
Vietnamese
Czechoslovakian
Master's Degree
Master's Degree Comparison
Vietnamese
Czechoslovakians
15.8%
MASTER'S DEGREE
85.5/ 100
METRIC RATING
140th/ 347
METRIC RANK
14.5%
MASTER'S DEGREE
29.9/ 100
METRIC RATING
196th/ 347
METRIC RANK
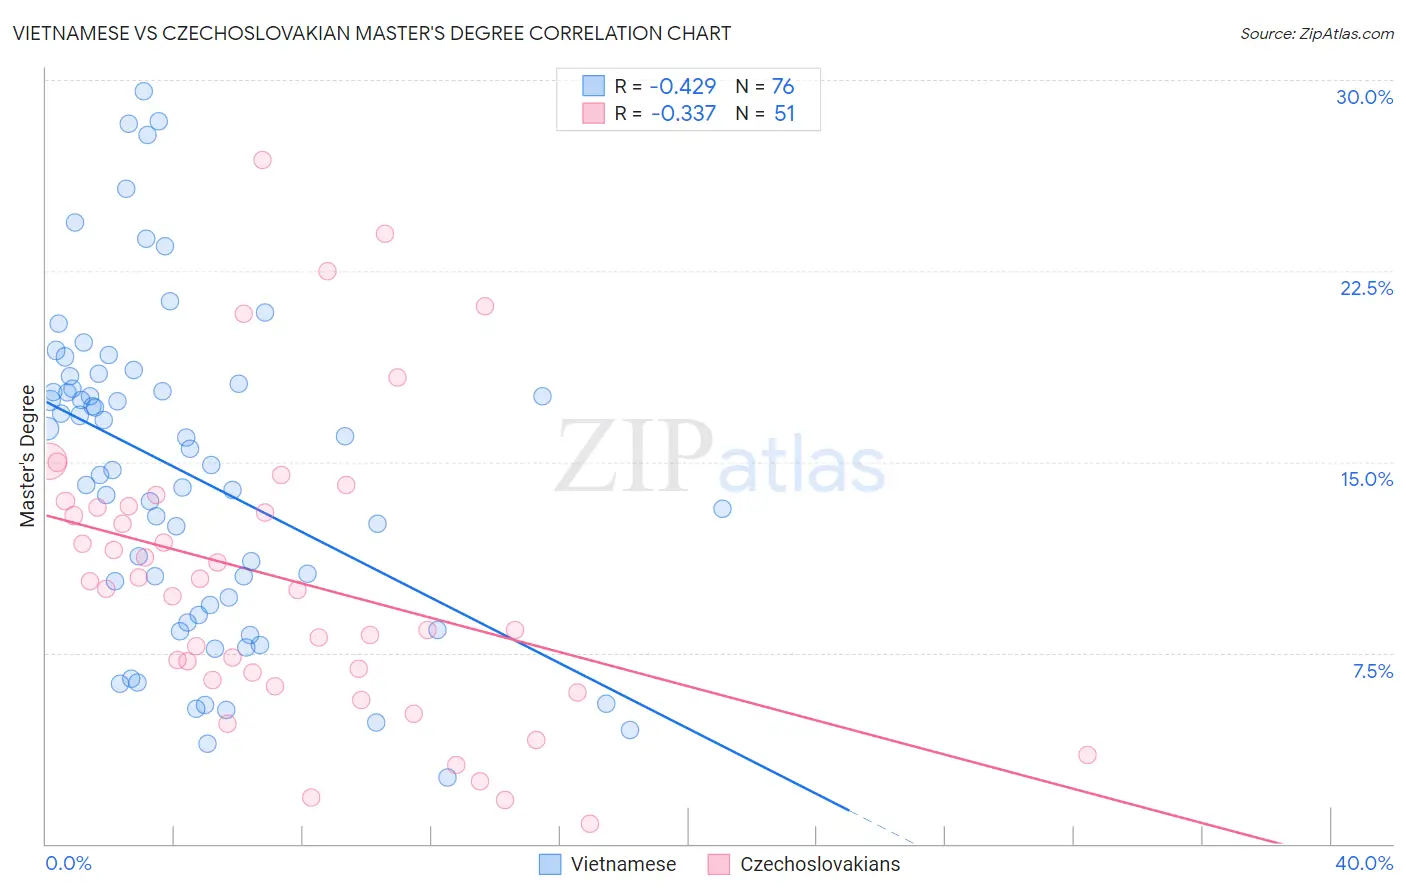
Vietnamese vs Czechoslovakian Master's Degree Correlation Chart
The statistical analysis conducted on geographies consisting of 170,730,532 people shows a moderate negative correlation between the proportion of Vietnamese and percentage of population with at least master's degree education in the United States with a correlation coefficient (R) of -0.429 and weighted average of 15.8%. Similarly, the statistical analysis conducted on geographies consisting of 368,562,573 people shows a mild negative correlation between the proportion of Czechoslovakians and percentage of population with at least master's degree education in the United States with a correlation coefficient (R) of -0.337 and weighted average of 14.5%, a difference of 8.6%.
Master's Degree Correlation Summary
| Measurement | Vietnamese | Czechoslovakian |
| Minimum | 2.6% | 0.78% |
| Maximum | 29.5% | 26.9% |
| Range | 26.9% | 26.1% |
| Mean | 14.5% | 10.4% |
| Median | 14.8% | 10.0% |
| Interquartile 25% (IQ1) | 9.2% | 6.4% |
| Interquartile 75% (IQ3) | 18.0% | 13.3% |
| Interquartile Range (IQR) | 8.8% | 6.8% |
| Standard Deviation (Sample) | 6.4% | 5.8% |
| Standard Deviation (Population) | 6.3% | 5.7% |
Similar Demographics by Master's Degree
Demographics Similar to Vietnamese by Master's Degree
In terms of master's degree, the demographic groups most similar to Vietnamese are Immigrants from Germany (15.8%, a difference of 0.090%), Polish (15.7%, a difference of 0.12%), Pakistani (15.8%, a difference of 0.14%), European (15.8%, a difference of 0.22%), and Assyrian/Chaldean/Syriac (15.8%, a difference of 0.33%).
| Demographics | Rating | Rank | Master's Degree |
| Immigrants | Sudan | 90.2 /100 | #133 | Exceptional 16.0% |
| Venezuelans | 88.4 /100 | #134 | Excellent 15.9% |
| South American Indians | 88.4 /100 | #135 | Excellent 15.9% |
| Assyrians/Chaldeans/Syriacs | 86.8 /100 | #136 | Excellent 15.8% |
| Europeans | 86.4 /100 | #137 | Excellent 15.8% |
| Pakistanis | 86.1 /100 | #138 | Excellent 15.8% |
| Immigrants | Germany | 85.9 /100 | #139 | Excellent 15.8% |
| Vietnamese | 85.5 /100 | #140 | Excellent 15.8% |
| Poles | 85.0 /100 | #141 | Excellent 15.7% |
| Immigrants | Africa | 84.0 /100 | #142 | Excellent 15.7% |
| Immigrants | Venezuela | 83.6 /100 | #143 | Excellent 15.7% |
| Canadians | 83.3 /100 | #144 | Excellent 15.7% |
| South Americans | 81.3 /100 | #145 | Excellent 15.6% |
| Immigrants | Afghanistan | 79.4 /100 | #146 | Good 15.6% |
| Hungarians | 79.1 /100 | #147 | Good 15.6% |
Demographics Similar to Czechoslovakians by Master's Degree
In terms of master's degree, the demographic groups most similar to Czechoslovakians are Danish (14.5%, a difference of 0.22%), Belgian (14.5%, a difference of 0.31%), Chinese (14.6%, a difference of 0.39%), West Indian (14.5%, a difference of 0.41%), and Immigrants from Nigeria (14.6%, a difference of 0.43%).
| Demographics | Rating | Rank | Master's Degree |
| Immigrants | Immigrants | 36.0 /100 | #189 | Fair 14.6% |
| Spaniards | 35.8 /100 | #190 | Fair 14.6% |
| Welsh | 34.2 /100 | #191 | Fair 14.6% |
| Immigrants | Middle Africa | 33.6 /100 | #192 | Fair 14.6% |
| Immigrants | Nigeria | 32.7 /100 | #193 | Fair 14.6% |
| Chinese | 32.5 /100 | #194 | Fair 14.6% |
| Danes | 31.3 /100 | #195 | Fair 14.5% |
| Czechoslovakians | 29.9 /100 | #196 | Fair 14.5% |
| Belgians | 28.0 /100 | #197 | Fair 14.5% |
| West Indians | 27.4 /100 | #198 | Fair 14.5% |
| Immigrants | Armenia | 27.2 /100 | #199 | Fair 14.5% |
| Panamanians | 25.1 /100 | #200 | Fair 14.4% |
| Scotch-Irish | 25.0 /100 | #201 | Fair 14.4% |
| Immigrants | Western Africa | 24.9 /100 | #202 | Fair 14.4% |
| Yugoslavians | 24.3 /100 | #203 | Fair 14.4% |