Venezuelan vs Immigrants from Haiti No Vehicles in Household
COMPARE
Venezuelan
Immigrants from Haiti
No Vehicles in Household
No Vehicles in Household Comparison
Venezuelans
Immigrants from Haiti
8.1%
NO VEHICLES IN HOUSEHOLD
99.8/ 100
METRIC RATING
57th/ 347
METRIC RANK
15.4%
NO VEHICLES IN HOUSEHOLD
0.0/ 100
METRIC RATING
307th/ 347
METRIC RANK
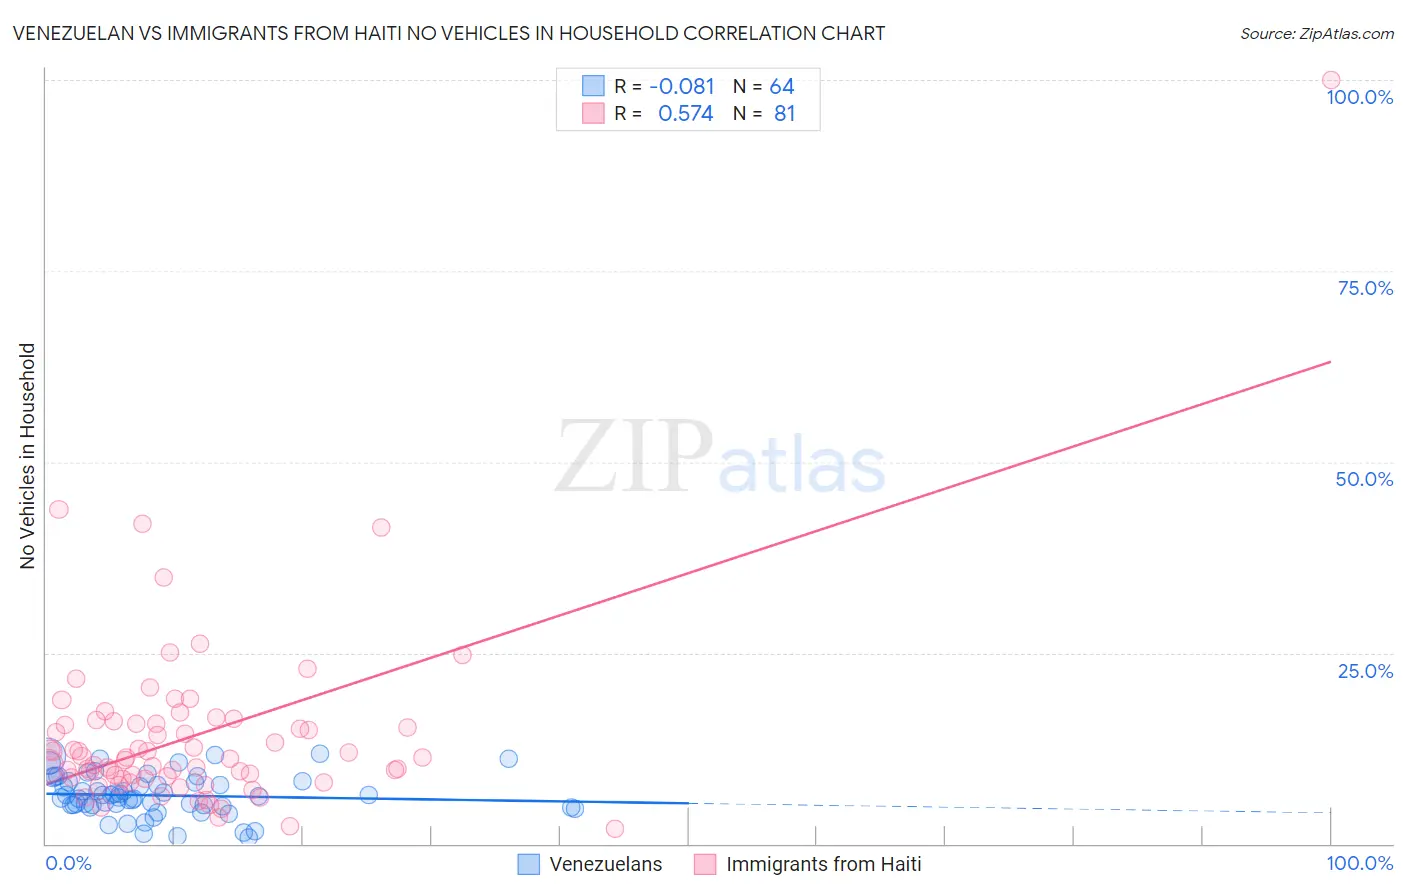
Venezuelan vs Immigrants from Haiti No Vehicles in Household Correlation Chart
The statistical analysis conducted on geographies consisting of 305,806,487 people shows a slight negative correlation between the proportion of Venezuelans and percentage of households with no vehicle available in the United States with a correlation coefficient (R) of -0.081 and weighted average of 8.1%. Similarly, the statistical analysis conducted on geographies consisting of 224,981,556 people shows a substantial positive correlation between the proportion of Immigrants from Haiti and percentage of households with no vehicle available in the United States with a correlation coefficient (R) of 0.574 and weighted average of 15.4%, a difference of 89.2%.
No Vehicles in Household Correlation Summary
| Measurement | Venezuelan | Immigrants from Haiti |
| Minimum | 0.90% | 2.0% |
| Maximum | 11.7% | 100.0% |
| Range | 10.8% | 98.0% |
| Mean | 6.3% | 14.3% |
| Median | 6.1% | 11.3% |
| Interquartile 25% (IQ1) | 5.0% | 8.6% |
| Interquartile 75% (IQ3) | 8.1% | 15.8% |
| Interquartile Range (IQR) | 3.1% | 7.2% |
| Standard Deviation (Sample) | 2.7% | 12.6% |
| Standard Deviation (Population) | 2.7% | 12.5% |
Similar Demographics by No Vehicles in Household
Demographics Similar to Venezuelans by No Vehicles in Household
In terms of no vehicles in household, the demographic groups most similar to Venezuelans are Immigrants from Mexico (8.1%, a difference of 0.11%), Immigrants from Afghanistan (8.1%, a difference of 0.28%), Immigrants from India (8.2%, a difference of 0.46%), Immigrants from Laos (8.2%, a difference of 0.53%), and Celtic (8.1%, a difference of 0.68%).
| Demographics | Rating | Rank | No Vehicles in Household |
| Belgians | 99.9 /100 | #50 | Exceptional 8.0% |
| Koreans | 99.9 /100 | #51 | Exceptional 8.0% |
| Hawaiians | 99.9 /100 | #52 | Exceptional 8.0% |
| Slovenes | 99.9 /100 | #53 | Exceptional 8.0% |
| Immigrants | Venezuela | 99.9 /100 | #54 | Exceptional 8.1% |
| Celtics | 99.9 /100 | #55 | Exceptional 8.1% |
| Immigrants | Afghanistan | 99.9 /100 | #56 | Exceptional 8.1% |
| Venezuelans | 99.8 /100 | #57 | Exceptional 8.1% |
| Immigrants | Mexico | 99.8 /100 | #58 | Exceptional 8.1% |
| Immigrants | India | 99.8 /100 | #59 | Exceptional 8.2% |
| Immigrants | Laos | 99.8 /100 | #60 | Exceptional 8.2% |
| Thais | 99.8 /100 | #61 | Exceptional 8.2% |
| Chinese | 99.8 /100 | #62 | Exceptional 8.2% |
| Slovaks | 99.8 /100 | #63 | Exceptional 8.3% |
| Croatians | 99.8 /100 | #64 | Exceptional 8.3% |
Demographics Similar to Immigrants from Haiti by No Vehicles in Household
In terms of no vehicles in household, the demographic groups most similar to Immigrants from Haiti are U.S. Virgin Islander (15.4%, a difference of 0.030%), Immigrants from Belize (15.4%, a difference of 0.13%), Puerto Rican (15.5%, a difference of 0.69%), Cape Verdean (15.6%, a difference of 1.3%), and Immigrants from Israel (15.6%, a difference of 1.3%).
| Demographics | Rating | Rank | No Vehicles in Household |
| Yuman | 0.0 /100 | #300 | Tragic 14.9% |
| Immigrants | Ukraine | 0.0 /100 | #301 | Tragic 14.9% |
| Haitians | 0.0 /100 | #302 | Tragic 14.9% |
| Immigrants | Western Africa | 0.0 /100 | #303 | Tragic 15.0% |
| Immigrants | Russia | 0.0 /100 | #304 | Tragic 15.1% |
| Immigrants | China | 0.0 /100 | #305 | Tragic 15.2% |
| Immigrants | Belize | 0.0 /100 | #306 | Tragic 15.4% |
| Immigrants | Haiti | 0.0 /100 | #307 | Tragic 15.4% |
| U.S. Virgin Islanders | 0.0 /100 | #308 | Tragic 15.4% |
| Puerto Ricans | 0.0 /100 | #309 | Tragic 15.5% |
| Cape Verdeans | 0.0 /100 | #310 | Tragic 15.6% |
| Immigrants | Israel | 0.0 /100 | #311 | Tragic 15.6% |
| Alaskan Athabascans | 0.0 /100 | #312 | Tragic 15.6% |
| Tohono O'odham | 0.0 /100 | #313 | Tragic 15.6% |
| Albanians | 0.0 /100 | #314 | Tragic 15.6% |