Venezuelan vs Immigrants from Nigeria No Vehicles in Household
COMPARE
Venezuelan
Immigrants from Nigeria
No Vehicles in Household
No Vehicles in Household Comparison
Venezuelans
Immigrants from Nigeria
8.1%
NO VEHICLES IN HOUSEHOLD
99.8/ 100
METRIC RATING
57th/ 347
METRIC RANK
11.8%
NO VEHICLES IN HOUSEHOLD
1.9/ 100
METRIC RATING
249th/ 347
METRIC RANK
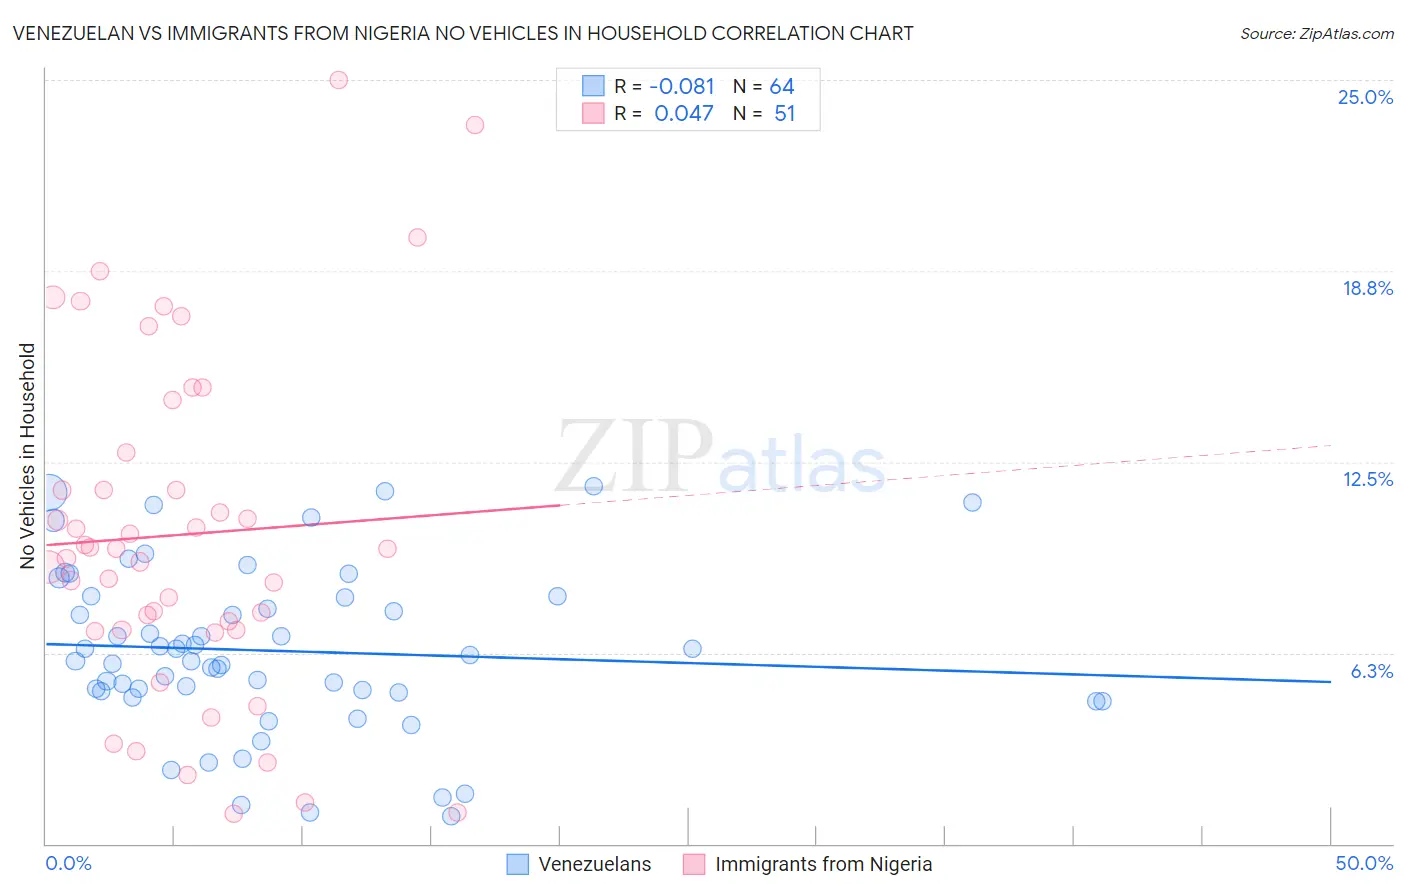
Venezuelan vs Immigrants from Nigeria No Vehicles in Household Correlation Chart
The statistical analysis conducted on geographies consisting of 305,806,487 people shows a slight negative correlation between the proportion of Venezuelans and percentage of households with no vehicle available in the United States with a correlation coefficient (R) of -0.081 and weighted average of 8.1%. Similarly, the statistical analysis conducted on geographies consisting of 283,041,250 people shows no correlation between the proportion of Immigrants from Nigeria and percentage of households with no vehicle available in the United States with a correlation coefficient (R) of 0.047 and weighted average of 11.8%, a difference of 45.1%.
No Vehicles in Household Correlation Summary
| Measurement | Venezuelan | Immigrants from Nigeria |
| Minimum | 0.90% | 0.97% |
| Maximum | 11.7% | 25.0% |
| Range | 10.8% | 24.0% |
| Mean | 6.3% | 10.1% |
| Median | 6.1% | 9.6% |
| Interquartile 25% (IQ1) | 5.0% | 7.0% |
| Interquartile 75% (IQ3) | 8.1% | 12.8% |
| Interquartile Range (IQR) | 3.1% | 5.8% |
| Standard Deviation (Sample) | 2.7% | 5.6% |
| Standard Deviation (Population) | 2.7% | 5.5% |
Similar Demographics by No Vehicles in Household
Demographics Similar to Venezuelans by No Vehicles in Household
In terms of no vehicles in household, the demographic groups most similar to Venezuelans are Immigrants from Mexico (8.1%, a difference of 0.11%), Immigrants from Afghanistan (8.1%, a difference of 0.28%), Immigrants from India (8.2%, a difference of 0.46%), Immigrants from Laos (8.2%, a difference of 0.53%), and Celtic (8.1%, a difference of 0.68%).
| Demographics | Rating | Rank | No Vehicles in Household |
| Belgians | 99.9 /100 | #50 | Exceptional 8.0% |
| Koreans | 99.9 /100 | #51 | Exceptional 8.0% |
| Hawaiians | 99.9 /100 | #52 | Exceptional 8.0% |
| Slovenes | 99.9 /100 | #53 | Exceptional 8.0% |
| Immigrants | Venezuela | 99.9 /100 | #54 | Exceptional 8.1% |
| Celtics | 99.9 /100 | #55 | Exceptional 8.1% |
| Immigrants | Afghanistan | 99.9 /100 | #56 | Exceptional 8.1% |
| Venezuelans | 99.8 /100 | #57 | Exceptional 8.1% |
| Immigrants | Mexico | 99.8 /100 | #58 | Exceptional 8.1% |
| Immigrants | India | 99.8 /100 | #59 | Exceptional 8.2% |
| Immigrants | Laos | 99.8 /100 | #60 | Exceptional 8.2% |
| Thais | 99.8 /100 | #61 | Exceptional 8.2% |
| Chinese | 99.8 /100 | #62 | Exceptional 8.2% |
| Slovaks | 99.8 /100 | #63 | Exceptional 8.3% |
| Croatians | 99.8 /100 | #64 | Exceptional 8.3% |
Demographics Similar to Immigrants from Nigeria by No Vehicles in Household
In terms of no vehicles in household, the demographic groups most similar to Immigrants from Nigeria are Immigrants from Belgium (11.8%, a difference of 0.030%), Immigrants from Czechoslovakia (11.8%, a difference of 0.040%), Menominee (11.8%, a difference of 0.10%), Paiute (11.8%, a difference of 0.22%), and Immigrants from Honduras (11.8%, a difference of 0.26%).
| Demographics | Rating | Rank | No Vehicles in Household |
| Turks | 2.6 /100 | #242 | Tragic 11.7% |
| Cheyenne | 2.4 /100 | #243 | Tragic 11.7% |
| Immigrants | Portugal | 2.2 /100 | #244 | Tragic 11.7% |
| Immigrants | Honduras | 2.1 /100 | #245 | Tragic 11.8% |
| Menominee | 2.0 /100 | #246 | Tragic 11.8% |
| Immigrants | Czechoslovakia | 2.0 /100 | #247 | Tragic 11.8% |
| Immigrants | Belgium | 1.9 /100 | #248 | Tragic 11.8% |
| Immigrants | Nigeria | 1.9 /100 | #249 | Tragic 11.8% |
| Paiute | 1.8 /100 | #250 | Tragic 11.8% |
| Blacks/African Americans | 1.6 /100 | #251 | Tragic 11.9% |
| Immigrants | Serbia | 1.5 /100 | #252 | Tragic 11.9% |
| Egyptians | 1.4 /100 | #253 | Tragic 11.9% |
| Immigrants | Uruguay | 1.3 /100 | #254 | Tragic 11.9% |
| Hondurans | 1.2 /100 | #255 | Tragic 12.0% |
| Liberians | 1.2 /100 | #256 | Tragic 12.0% |