Venezuelan vs Shoshone 2 or more Vehicles in Household
COMPARE
Venezuelan
Shoshone
2 or more Vehicles in Household
2 or more Vehicles in Household Comparison
Venezuelans
Shoshone
56.1%
2 OR MORE VEHICLES IN HOUSEHOLD
80.7/ 100
METRIC RATING
146th/ 347
METRIC RANK
57.9%
2 OR MORE VEHICLES IN HOUSEHOLD
99.0/ 100
METRIC RATING
92nd/ 347
METRIC RANK
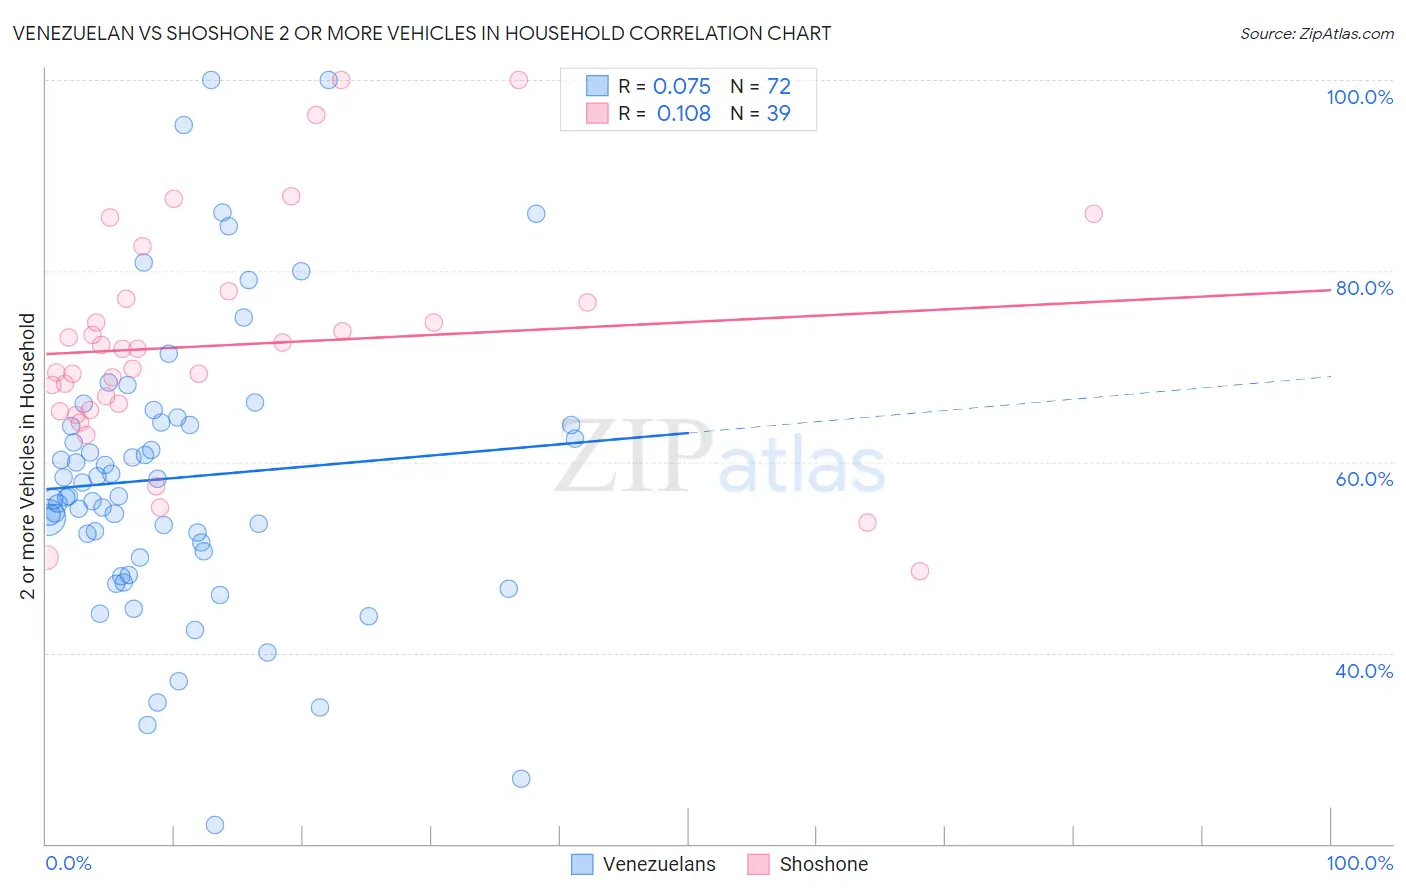
Venezuelan vs Shoshone 2 or more Vehicles in Household Correlation Chart
The statistical analysis conducted on geographies consisting of 306,169,265 people shows a slight positive correlation between the proportion of Venezuelans and percentage of households with 2 or more vehicles available in the United States with a correlation coefficient (R) of 0.075 and weighted average of 56.1%. Similarly, the statistical analysis conducted on geographies consisting of 66,615,877 people shows a poor positive correlation between the proportion of Shoshone and percentage of households with 2 or more vehicles available in the United States with a correlation coefficient (R) of 0.108 and weighted average of 57.9%, a difference of 3.1%.
2 or more Vehicles in Household Correlation Summary
| Measurement | Venezuelan | Shoshone |
| Minimum | 22.0% | 48.5% |
| Maximum | 100.0% | 100.0% |
| Range | 78.0% | 51.5% |
| Mean | 58.3% | 72.3% |
| Median | 56.4% | 71.8% |
| Interquartile 25% (IQ1) | 50.4% | 65.4% |
| Interquartile 75% (IQ3) | 64.0% | 77.1% |
| Interquartile Range (IQR) | 13.7% | 11.7% |
| Standard Deviation (Sample) | 15.2% | 12.1% |
| Standard Deviation (Population) | 15.1% | 11.9% |
Similar Demographics by 2 or more Vehicles in Household
Demographics Similar to Venezuelans by 2 or more Vehicles in Household
In terms of 2 or more vehicles in household, the demographic groups most similar to Venezuelans are Serbian (56.1%, a difference of 0.020%), Syrian (56.2%, a difference of 0.030%), Immigrants from Moldova (56.1%, a difference of 0.030%), Chilean (56.1%, a difference of 0.030%), and Immigrants from Syria (56.2%, a difference of 0.050%).
| Demographics | Rating | Rank | 2 or more Vehicles in Household |
| Armenians | 84.3 /100 | #139 | Excellent 56.3% |
| Latvians | 83.6 /100 | #140 | Excellent 56.2% |
| Immigrants | Cambodia | 83.6 /100 | #141 | Excellent 56.2% |
| South Africans | 83.1 /100 | #142 | Excellent 56.2% |
| Seminole | 81.7 /100 | #143 | Excellent 56.2% |
| Immigrants | Syria | 81.4 /100 | #144 | Excellent 56.2% |
| Syrians | 81.2 /100 | #145 | Excellent 56.2% |
| Venezuelans | 80.7 /100 | #146 | Excellent 56.1% |
| Serbians | 80.3 /100 | #147 | Excellent 56.1% |
| Immigrants | Moldova | 80.2 /100 | #148 | Excellent 56.1% |
| Chileans | 80.2 /100 | #149 | Excellent 56.1% |
| Nicaraguans | 79.9 /100 | #150 | Good 56.1% |
| Immigrants | Northern Europe | 78.7 /100 | #151 | Good 56.1% |
| Immigrants | Pakistan | 78.1 /100 | #152 | Good 56.1% |
| Lumbee | 71.9 /100 | #153 | Good 55.9% |
Demographics Similar to Shoshone by 2 or more Vehicles in Household
In terms of 2 or more vehicles in household, the demographic groups most similar to Shoshone are Ottawa (57.9%, a difference of 0.0%), Pakistani (57.9%, a difference of 0.020%), Immigrants from Germany (57.9%, a difference of 0.050%), Hispanic or Latino (57.9%, a difference of 0.050%), and Filipino (57.8%, a difference of 0.060%).
| Demographics | Rating | Rank | 2 or more Vehicles in Household |
| Slovaks | 99.2 /100 | #85 | Exceptional 58.0% |
| Potawatomi | 99.1 /100 | #86 | Exceptional 58.0% |
| Thais | 99.1 /100 | #87 | Exceptional 57.9% |
| Immigrants | Iran | 99.1 /100 | #88 | Exceptional 57.9% |
| Immigrants | Germany | 99.0 /100 | #89 | Exceptional 57.9% |
| Hispanics or Latinos | 99.0 /100 | #90 | Exceptional 57.9% |
| Pakistanis | 99.0 /100 | #91 | Exceptional 57.9% |
| Shoshone | 99.0 /100 | #92 | Exceptional 57.9% |
| Ottawa | 99.0 /100 | #93 | Exceptional 57.9% |
| Filipinos | 98.9 /100 | #94 | Exceptional 57.8% |
| Hmong | 98.9 /100 | #95 | Exceptional 57.8% |
| Burmese | 98.8 /100 | #96 | Exceptional 57.8% |
| Slavs | 98.8 /100 | #97 | Exceptional 57.8% |
| Palestinians | 98.6 /100 | #98 | Exceptional 57.7% |
| Cajuns | 98.5 /100 | #99 | Exceptional 57.7% |