Venezuelan vs Shoshone Unemployment Among Ages 65 to 74 years
COMPARE
Venezuelan
Shoshone
Unemployment Among Ages 65 to 74 years
Unemployment Among Ages 65 to 74 years Comparison
Venezuelans
Shoshone
5.9%
UNEMPLOYMENT AMONG AGES 65 TO 74 YEARS
0.0/ 100
METRIC RATING
311th/ 347
METRIC RANK
6.2%
UNEMPLOYMENT AMONG AGES 65 TO 74 YEARS
0.0/ 100
METRIC RATING
327th/ 347
METRIC RANK
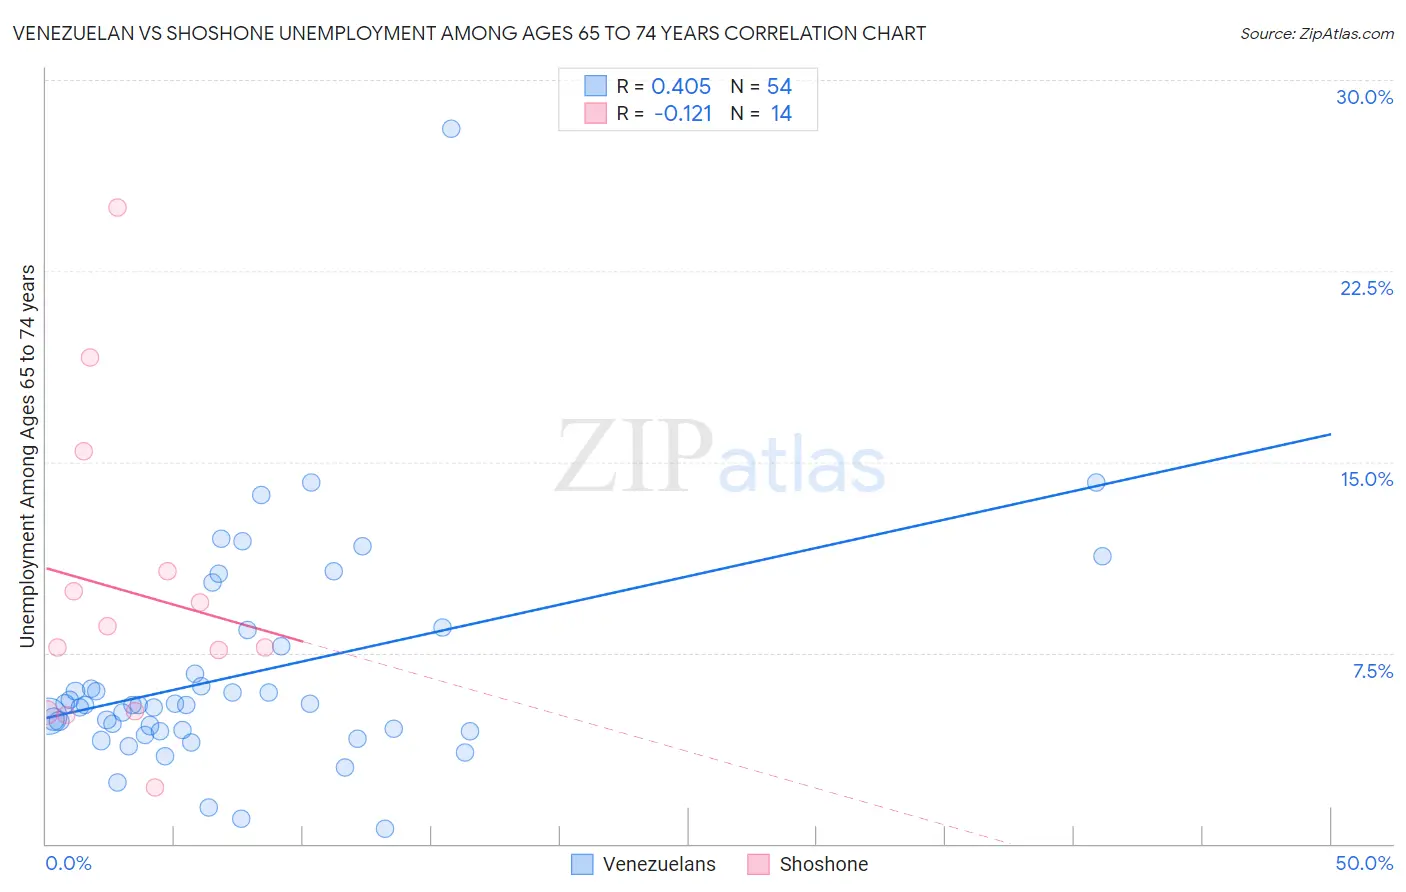
Venezuelan vs Shoshone Unemployment Among Ages 65 to 74 years Correlation Chart
The statistical analysis conducted on geographies consisting of 277,612,730 people shows a moderate positive correlation between the proportion of Venezuelans and unemployment rate among population between the ages 65 and 74 in the United States with a correlation coefficient (R) of 0.405 and weighted average of 5.9%. Similarly, the statistical analysis conducted on geographies consisting of 63,179,225 people shows a poor negative correlation between the proportion of Shoshone and unemployment rate among population between the ages 65 and 74 in the United States with a correlation coefficient (R) of -0.121 and weighted average of 6.2%, a difference of 6.1%.
Unemployment Among Ages 65 to 74 years Correlation Summary
| Measurement | Venezuelan | Shoshone |
| Minimum | 0.60% | 2.2% |
| Maximum | 28.1% | 25.0% |
| Range | 27.5% | 22.8% |
| Mean | 6.6% | 9.9% |
| Median | 5.5% | 8.1% |
| Interquartile 25% (IQ1) | 4.4% | 5.2% |
| Interquartile 75% (IQ3) | 7.7% | 10.7% |
| Interquartile Range (IQR) | 3.3% | 5.5% |
| Standard Deviation (Sample) | 4.4% | 6.1% |
| Standard Deviation (Population) | 4.3% | 5.9% |
Demographics Similar to Venezuelans and Shoshone by Unemployment Among Ages 65 to 74 years
In terms of unemployment among ages 65 to 74 years, the demographic groups most similar to Venezuelans are Hispanic or Latino (5.9%, a difference of 0.020%), Immigrants from Bangladesh (5.9%, a difference of 0.040%), Immigrants from Ecuador (5.8%, a difference of 0.18%), Vietnamese (5.9%, a difference of 0.21%), and Immigrants from Venezuela (5.9%, a difference of 0.39%). Similarly, the demographic groups most similar to Shoshone are Immigrants from the Azores (6.2%, a difference of 0.17%), Yuman (6.2%, a difference of 0.52%), Native/Alaskan (6.0%, a difference of 2.8%), Immigrants from Portugal (6.0%, a difference of 3.1%), and Tohono O'odham (6.0%, a difference of 3.2%).
| Demographics | Rating | Rank | Unemployment Among Ages 65 to 74 years |
| Immigrants | Ecuador | 0.0 /100 | #309 | Tragic 5.8% |
| Immigrants | Bangladesh | 0.0 /100 | #310 | Tragic 5.9% |
| Venezuelans | 0.0 /100 | #311 | Tragic 5.9% |
| Hispanics or Latinos | 0.0 /100 | #312 | Tragic 5.9% |
| Vietnamese | 0.0 /100 | #313 | Tragic 5.9% |
| Immigrants | Venezuela | 0.0 /100 | #314 | Tragic 5.9% |
| Immigrants | Guatemala | 0.0 /100 | #315 | Tragic 5.9% |
| Immigrants | El Salvador | 0.0 /100 | #316 | Tragic 5.9% |
| Immigrants | Central America | 0.0 /100 | #317 | Tragic 5.9% |
| Zimbabweans | 0.0 /100 | #318 | Tragic 5.9% |
| Aleuts | 0.0 /100 | #319 | Tragic 5.9% |
| Immigrants | Bahamas | 0.0 /100 | #320 | Tragic 5.9% |
| Immigrants | Dominica | 0.0 /100 | #321 | Tragic 6.0% |
| Immigrants | Mexico | 0.0 /100 | #322 | Tragic 6.0% |
| Delaware | 0.0 /100 | #323 | Tragic 6.0% |
| Tohono O'odham | 0.0 /100 | #324 | Tragic 6.0% |
| Immigrants | Portugal | 0.0 /100 | #325 | Tragic 6.0% |
| Natives/Alaskans | 0.0 /100 | #326 | Tragic 6.0% |
| Shoshone | 0.0 /100 | #327 | Tragic 6.2% |
| Immigrants | Azores | 0.0 /100 | #328 | Tragic 6.2% |
| Yuman | 0.0 /100 | #329 | Tragic 6.2% |