Guyanese vs Immigrants from Portugal 1 or more Vehicles in Household
COMPARE
Guyanese
Immigrants from Portugal
1 or more Vehicles in Household
1 or more Vehicles in Household Comparison
Guyanese
Immigrants from Portugal
70.8%
1 OR MORE VEHICLES IN HOUSEHOLD
0.0/ 100
METRIC RATING
339th/ 347
METRIC RANK
88.3%
1 OR MORE VEHICLES IN HOUSEHOLD
2.0/ 100
METRIC RATING
244th/ 347
METRIC RANK
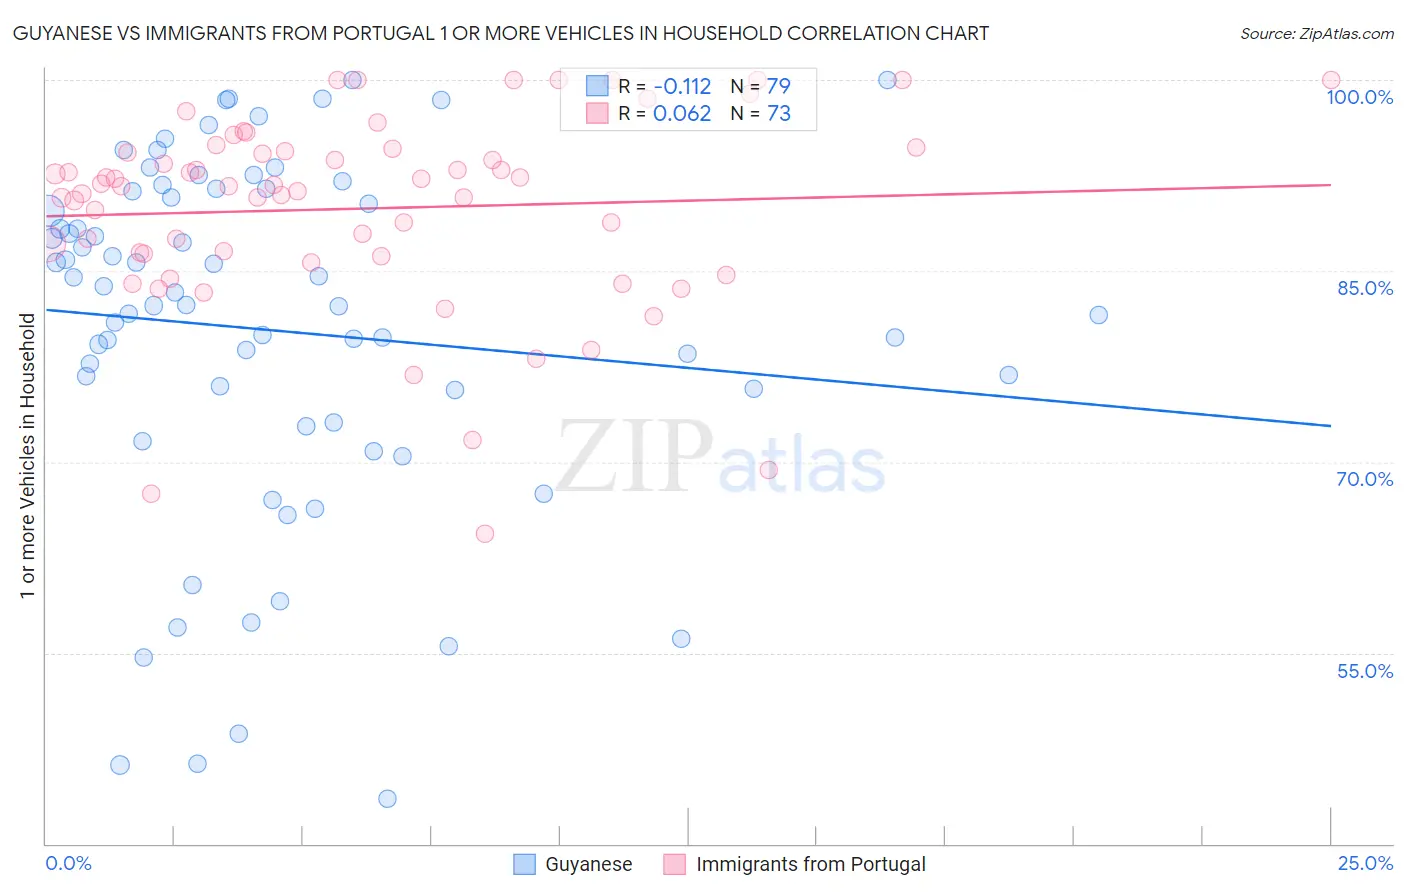
Guyanese vs Immigrants from Portugal 1 or more Vehicles in Household Correlation Chart
The statistical analysis conducted on geographies consisting of 176,723,010 people shows a poor negative correlation between the proportion of Guyanese and percentage of households with 1 or more vehicles available in the United States with a correlation coefficient (R) of -0.112 and weighted average of 70.8%. Similarly, the statistical analysis conducted on geographies consisting of 174,753,622 people shows a slight positive correlation between the proportion of Immigrants from Portugal and percentage of households with 1 or more vehicles available in the United States with a correlation coefficient (R) of 0.062 and weighted average of 88.3%, a difference of 24.8%.
1 or more Vehicles in Household Correlation Summary
| Measurement | Guyanese | Immigrants from Portugal |
| Minimum | 43.6% | 64.3% |
| Maximum | 100.0% | 100.0% |
| Range | 56.4% | 35.7% |
| Mean | 80.3% | 89.9% |
| Median | 82.3% | 91.7% |
| Interquartile 25% (IQ1) | 73.1% | 86.3% |
| Interquartile 75% (IQ3) | 91.3% | 94.5% |
| Interquartile Range (IQR) | 18.2% | 8.3% |
| Standard Deviation (Sample) | 13.9% | 7.7% |
| Standard Deviation (Population) | 13.8% | 7.6% |
Similar Demographics by 1 or more Vehicles in Household
Demographics Similar to Guyanese by 1 or more Vehicles in Household
In terms of 1 or more vehicles in household, the demographic groups most similar to Guyanese are Dominican (70.7%, a difference of 0.19%), Immigrants from Barbados (70.6%, a difference of 0.32%), Immigrants from Guyana (70.6%, a difference of 0.34%), British West Indian (70.4%, a difference of 0.64%), and Inupiat (71.5%, a difference of 1.0%).
| Demographics | Rating | Rank | 1 or more Vehicles in Household |
| Trinidadians and Tobagonians | 0.0 /100 | #332 | Tragic 76.3% |
| Immigrants | Ecuador | 0.0 /100 | #333 | Tragic 76.2% |
| Immigrants | Bangladesh | 0.0 /100 | #334 | Tragic 74.3% |
| Barbadians | 0.0 /100 | #335 | Tragic 74.0% |
| Vietnamese | 0.0 /100 | #336 | Tragic 73.8% |
| Immigrants | Uzbekistan | 0.0 /100 | #337 | Tragic 73.4% |
| Inupiat | 0.0 /100 | #338 | Tragic 71.5% |
| Guyanese | 0.0 /100 | #339 | Tragic 70.8% |
| Dominicans | 0.0 /100 | #340 | Tragic 70.7% |
| Immigrants | Barbados | 0.0 /100 | #341 | Tragic 70.6% |
| Immigrants | Guyana | 0.0 /100 | #342 | Tragic 70.6% |
| British West Indians | 0.0 /100 | #343 | Tragic 70.4% |
| Immigrants | Dominican Republic | 0.0 /100 | #344 | Tragic 68.6% |
| Immigrants | St. Vincent and the Grenadines | 0.0 /100 | #345 | Tragic 64.7% |
| Immigrants | Grenada | 0.0 /100 | #346 | Tragic 62.7% |
Demographics Similar to Immigrants from Portugal by 1 or more Vehicles in Household
In terms of 1 or more vehicles in household, the demographic groups most similar to Immigrants from Portugal are Immigrants from Czechoslovakia (88.3%, a difference of 0.010%), Immigrants from Belgium (88.4%, a difference of 0.020%), Menominee (88.3%, a difference of 0.030%), Immigrants from Honduras (88.3%, a difference of 0.060%), and Turkish (88.4%, a difference of 0.080%).
| Demographics | Rating | Rank | 1 or more Vehicles in Household |
| Immigrants | Turkey | 4.4 /100 | #237 | Tragic 88.6% |
| Immigrants | Somalia | 4.2 /100 | #238 | Tragic 88.6% |
| Kiowa | 3.8 /100 | #239 | Tragic 88.6% |
| Eastern Europeans | 3.0 /100 | #240 | Tragic 88.5% |
| Taiwanese | 2.6 /100 | #241 | Tragic 88.4% |
| Turks | 2.5 /100 | #242 | Tragic 88.4% |
| Immigrants | Belgium | 2.1 /100 | #243 | Tragic 88.4% |
| Immigrants | Portugal | 2.0 /100 | #244 | Tragic 88.3% |
| Immigrants | Czechoslovakia | 1.9 /100 | #245 | Tragic 88.3% |
| Menominee | 1.9 /100 | #246 | Tragic 88.3% |
| Immigrants | Honduras | 1.7 /100 | #247 | Tragic 88.3% |
| Immigrants | Nigeria | 1.5 /100 | #248 | Tragic 88.2% |
| Blacks/African Americans | 1.4 /100 | #249 | Tragic 88.2% |
| Egyptians | 1.2 /100 | #250 | Tragic 88.2% |
| Immigrants | Serbia | 1.2 /100 | #251 | Tragic 88.2% |