U.S. Virgin Islander vs Ute Unemployment Among Youth under 25 years
COMPARE
U.S. Virgin Islander
Ute
Unemployment Among Youth under 25 years
Unemployment Among Youth under 25 years Comparison
U.S. Virgin Islanders
Ute
13.6%
UNEMPLOYMENT AMONG YOUTH UNDER 25 YEARS
0.0/ 100
METRIC RATING
297th/ 347
METRIC RANK
13.3%
UNEMPLOYMENT AMONG YOUTH UNDER 25 YEARS
0.0/ 100
METRIC RATING
280th/ 347
METRIC RANK
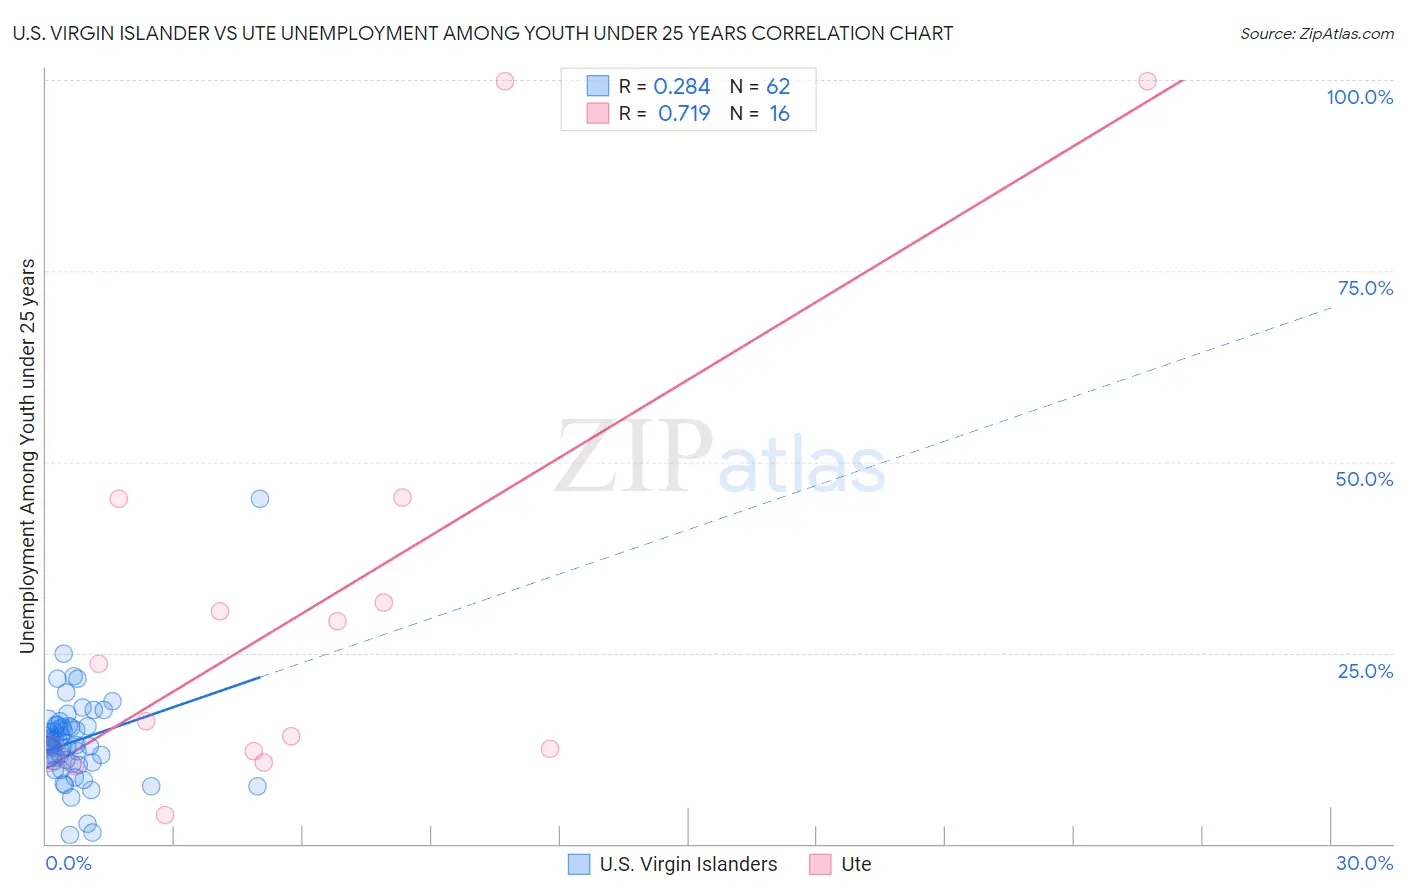
U.S. Virgin Islander vs Ute Unemployment Among Youth under 25 years Correlation Chart
The statistical analysis conducted on geographies consisting of 87,396,014 people shows a weak positive correlation between the proportion of U.S. Virgin Islanders and unemployment rate among youth under the age of 25 in the United States with a correlation coefficient (R) of 0.284 and weighted average of 13.6%. Similarly, the statistical analysis conducted on geographies consisting of 55,521,098 people shows a strong positive correlation between the proportion of Ute and unemployment rate among youth under the age of 25 in the United States with a correlation coefficient (R) of 0.719 and weighted average of 13.3%, a difference of 2.6%.
Unemployment Among Youth under 25 years Correlation Summary
| Measurement | U.S. Virgin Islander | Ute |
| Minimum | 1.1% | 3.8% |
| Maximum | 45.1% | 99.9% |
| Range | 44.0% | 96.1% |
| Mean | 13.5% | 31.0% |
| Median | 13.0% | 19.9% |
| Interquartile 25% (IQ1) | 10.6% | 11.9% |
| Interquartile 75% (IQ3) | 15.4% | 38.4% |
| Interquartile Range (IQR) | 4.8% | 26.5% |
| Standard Deviation (Sample) | 6.1% | 29.6% |
| Standard Deviation (Population) | 6.1% | 28.7% |
Demographics Similar to U.S. Virgin Islanders and Ute by Unemployment Among Youth under 25 years
In terms of unemployment among youth under 25 years, the demographic groups most similar to U.S. Virgin Islanders are Senegalese (13.5%, a difference of 0.62%), Chippewa (13.5%, a difference of 0.65%), Shoshone (13.7%, a difference of 0.86%), Immigrants from Caribbean (13.5%, a difference of 0.88%), and Spanish American Indian (13.5%, a difference of 1.1%). Similarly, the demographic groups most similar to Ute are Armenian (13.3%, a difference of 0.030%), Sierra Leonean (13.3%, a difference of 0.040%), Immigrants from Cameroon (13.3%, a difference of 0.060%), Lumbee (13.3%, a difference of 0.080%), and Ghanaian (13.3%, a difference of 0.16%).
| Demographics | Rating | Rank | Unemployment Among Youth under 25 years |
| Africans | 0.0 /100 | #278 | Tragic 13.2% |
| Cajuns | 0.0 /100 | #279 | Tragic 13.2% |
| Ute | 0.0 /100 | #280 | Tragic 13.3% |
| Armenians | 0.0 /100 | #281 | Tragic 13.3% |
| Sierra Leoneans | 0.0 /100 | #282 | Tragic 13.3% |
| Immigrants | Cameroon | 0.0 /100 | #283 | Tragic 13.3% |
| Lumbee | 0.0 /100 | #284 | Tragic 13.3% |
| Ghanaians | 0.0 /100 | #285 | Tragic 13.3% |
| Blackfeet | 0.0 /100 | #286 | Tragic 13.3% |
| Ecuadorians | 0.0 /100 | #287 | Tragic 13.3% |
| Immigrants | Western Africa | 0.0 /100 | #288 | Tragic 13.4% |
| Immigrants | Ghana | 0.0 /100 | #289 | Tragic 13.4% |
| Immigrants | Ecuador | 0.0 /100 | #290 | Tragic 13.4% |
| Apache | 0.0 /100 | #291 | Tragic 13.5% |
| Central American Indians | 0.0 /100 | #292 | Tragic 13.5% |
| Spanish American Indians | 0.0 /100 | #293 | Tragic 13.5% |
| Immigrants | Caribbean | 0.0 /100 | #294 | Tragic 13.5% |
| Chippewa | 0.0 /100 | #295 | Tragic 13.5% |
| Senegalese | 0.0 /100 | #296 | Tragic 13.5% |
| U.S. Virgin Islanders | 0.0 /100 | #297 | Tragic 13.6% |
| Shoshone | 0.0 /100 | #298 | Tragic 13.7% |