Peruvian vs French American Indian No Vehicles in Household
COMPARE
Peruvian
French American Indian
No Vehicles in Household
No Vehicles in Household Comparison
Peruvians
French American Indians
11.2%
NO VEHICLES IN HOUSEHOLD
8.4/ 100
METRIC RATING
221st/ 347
METRIC RANK
10.4%
NO VEHICLES IN HOUSEHOLD
49.1/ 100
METRIC RATING
176th/ 347
METRIC RANK
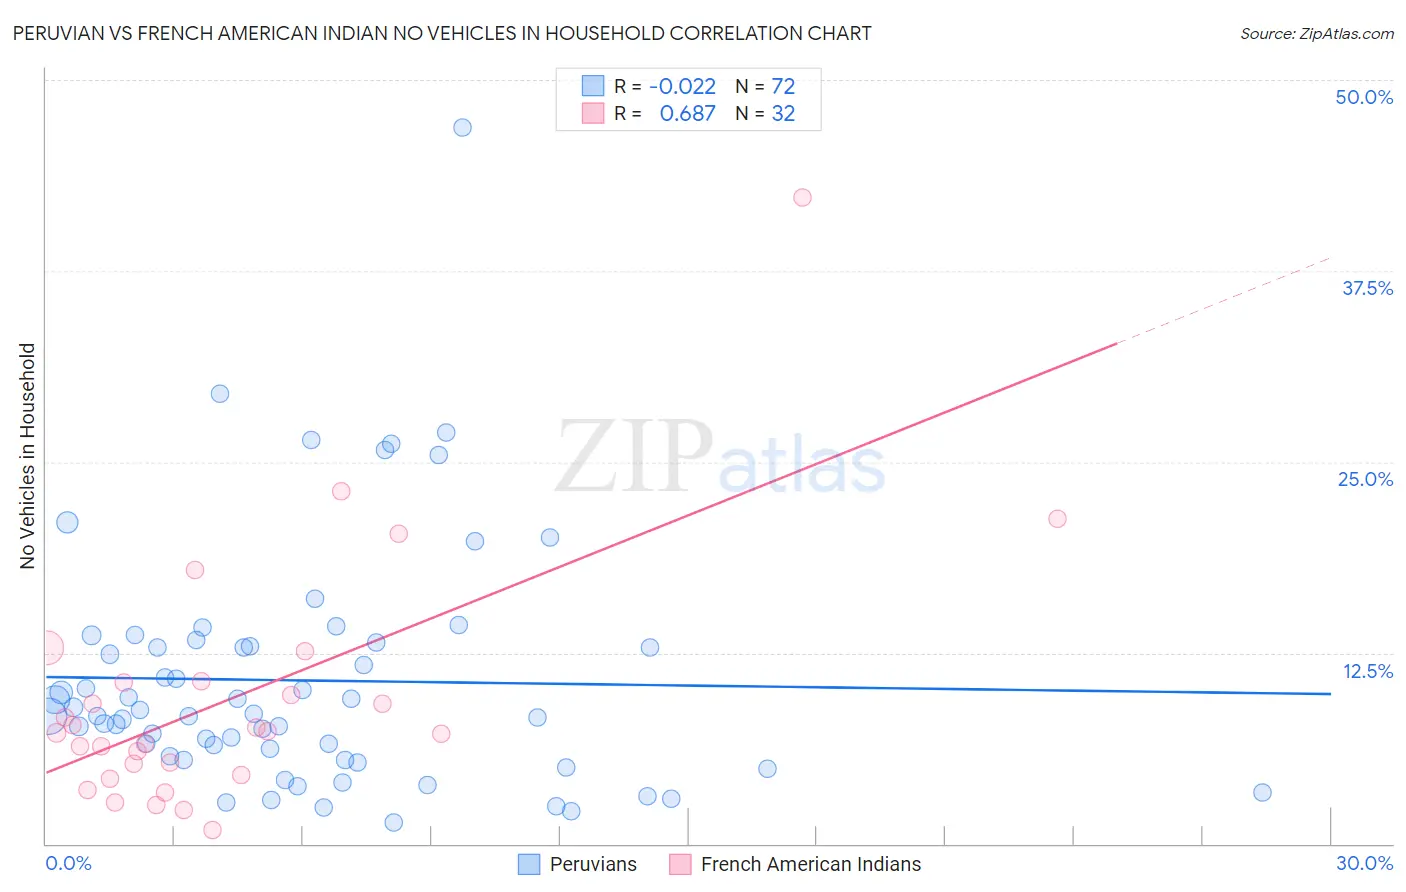
Peruvian vs French American Indian No Vehicles in Household Correlation Chart
The statistical analysis conducted on geographies consisting of 362,463,529 people shows no correlation between the proportion of Peruvians and percentage of households with no vehicle available in the United States with a correlation coefficient (R) of -0.022 and weighted average of 11.2%. Similarly, the statistical analysis conducted on geographies consisting of 131,848,748 people shows a significant positive correlation between the proportion of French American Indians and percentage of households with no vehicle available in the United States with a correlation coefficient (R) of 0.687 and weighted average of 10.4%, a difference of 8.0%.
No Vehicles in Household Correlation Summary
| Measurement | Peruvian | French American Indian |
| Minimum | 1.4% | 0.86% |
| Maximum | 46.9% | 42.3% |
| Range | 45.6% | 41.4% |
| Mean | 10.7% | 9.5% |
| Median | 8.4% | 7.3% |
| Interquartile 25% (IQ1) | 5.6% | 4.9% |
| Interquartile 75% (IQ3) | 13.1% | 10.6% |
| Interquartile Range (IQR) | 7.5% | 5.7% |
| Standard Deviation (Sample) | 7.9% | 8.1% |
| Standard Deviation (Population) | 7.8% | 8.0% |
Similar Demographics by No Vehicles in Household
Demographics Similar to Peruvians by No Vehicles in Household
In terms of no vehicles in household, the demographic groups most similar to Peruvians are Immigrants from South America (11.3%, a difference of 0.15%), Uruguayan (11.3%, a difference of 0.30%), Immigrants from Zaire (11.2%, a difference of 0.45%), Argentinean (11.2%, a difference of 0.47%), and Immigrants from Hong Kong (11.3%, a difference of 0.52%).
| Demographics | Rating | Rank | No Vehicles in Household |
| Immigrants | Denmark | 12.1 /100 | #214 | Poor 11.1% |
| Immigrants | Sri Lanka | 10.6 /100 | #215 | Poor 11.2% |
| Immigrants | Argentina | 10.6 /100 | #216 | Poor 11.2% |
| Dutch West Indians | 10.2 /100 | #217 | Poor 11.2% |
| Immigrants | Guatemala | 10.0 /100 | #218 | Tragic 11.2% |
| Argentineans | 9.6 /100 | #219 | Tragic 11.2% |
| Immigrants | Zaire | 9.6 /100 | #220 | Tragic 11.2% |
| Peruvians | 8.4 /100 | #221 | Tragic 11.2% |
| Immigrants | South America | 8.0 /100 | #222 | Tragic 11.3% |
| Uruguayans | 7.7 /100 | #223 | Tragic 11.3% |
| Immigrants | Hong Kong | 7.2 /100 | #224 | Tragic 11.3% |
| Immigrants | Sierra Leone | 6.4 /100 | #225 | Tragic 11.3% |
| Immigrants | Somalia | 5.4 /100 | #226 | Tragic 11.4% |
| Immigrants | Pakistan | 5.4 /100 | #227 | Tragic 11.4% |
| Immigrants | Romania | 5.3 /100 | #228 | Tragic 11.4% |
Demographics Similar to French American Indians by No Vehicles in Household
In terms of no vehicles in household, the demographic groups most similar to French American Indians are Immigrants from Burma/Myanmar (10.4%, a difference of 0.0%), Immigrants from El Salvador (10.4%, a difference of 0.010%), Immigrants from Sudan (10.4%, a difference of 0.12%), Filipino (10.4%, a difference of 0.13%), and Immigrants from Ethiopia (10.4%, a difference of 0.16%).
| Demographics | Rating | Rank | No Vehicles in Household |
| Lumbee | 54.7 /100 | #169 | Average 10.3% |
| Immigrants | Latin America | 53.2 /100 | #170 | Average 10.4% |
| Hmong | 52.7 /100 | #171 | Average 10.4% |
| Brazilians | 51.7 /100 | #172 | Average 10.4% |
| Filipinos | 50.1 /100 | #173 | Average 10.4% |
| Immigrants | Sudan | 50.0 /100 | #174 | Average 10.4% |
| Immigrants | Burma/Myanmar | 49.1 /100 | #175 | Average 10.4% |
| French American Indians | 49.1 /100 | #176 | Average 10.4% |
| Immigrants | El Salvador | 49.1 /100 | #177 | Average 10.4% |
| Immigrants | Ethiopia | 48.0 /100 | #178 | Average 10.4% |
| Ethiopians | 45.8 /100 | #179 | Average 10.5% |
| Arabs | 45.3 /100 | #180 | Average 10.5% |
| Immigrants | Colombia | 44.1 /100 | #181 | Average 10.5% |
| Immigrants | Bulgaria | 43.8 /100 | #182 | Average 10.5% |
| Natives/Alaskans | 43.7 /100 | #183 | Average 10.5% |