Immigrants from St. Vincent and the Grenadines vs French American Indian No Vehicles in Household
COMPARE
Immigrants from St. Vincent and the Grenadines
French American Indian
No Vehicles in Household
No Vehicles in Household Comparison
Immigrants from St. Vincent and the Grenadines
French American Indians
35.4%
NO VEHICLES IN HOUSEHOLD
0.0/ 100
METRIC RATING
345th/ 347
METRIC RANK
10.4%
NO VEHICLES IN HOUSEHOLD
49.1/ 100
METRIC RATING
176th/ 347
METRIC RANK
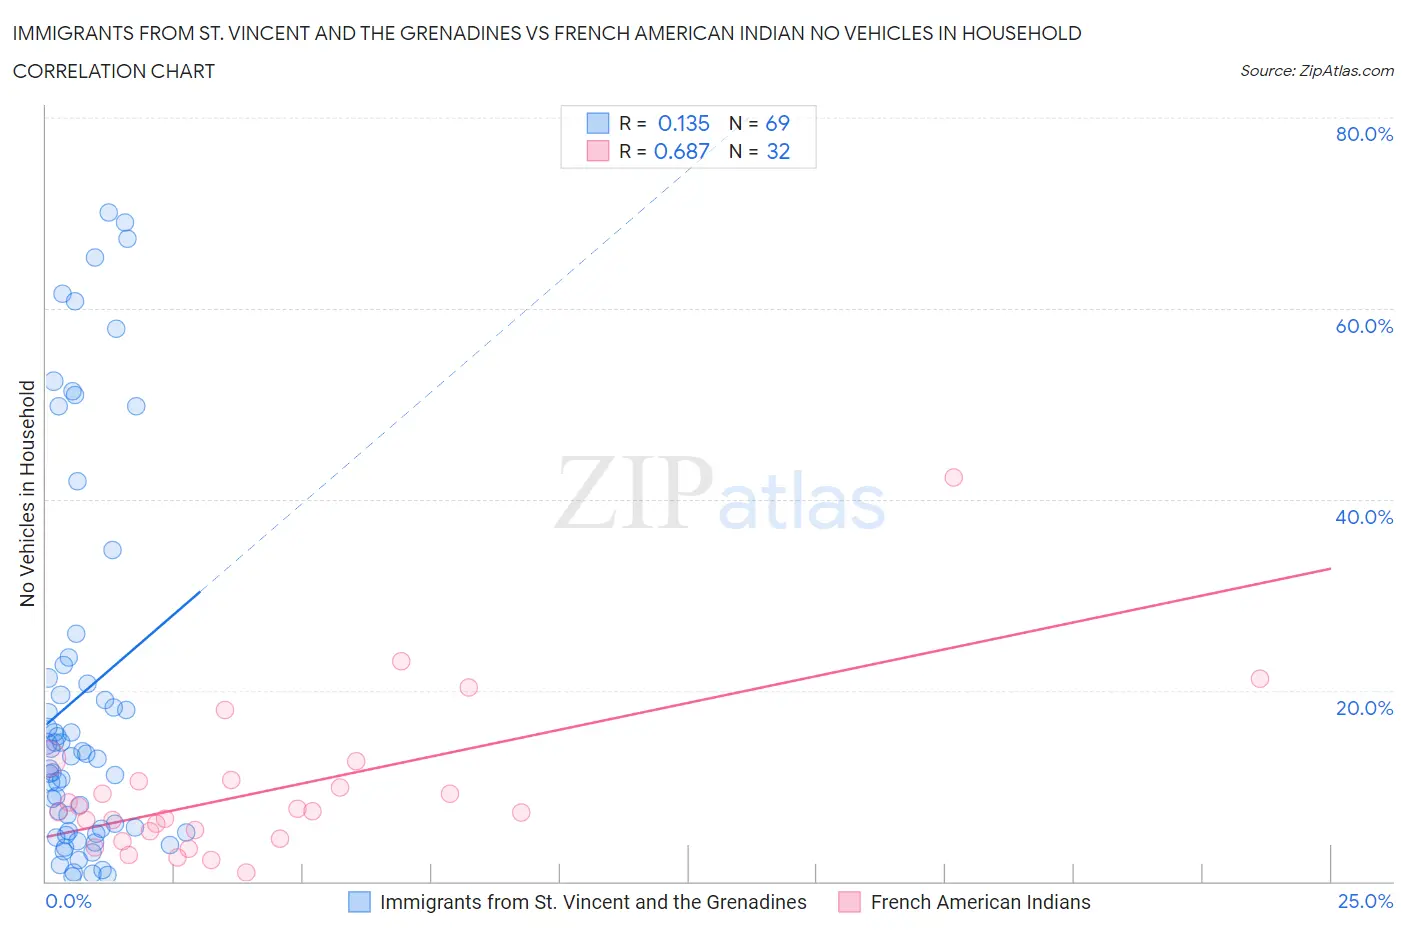
Immigrants from St. Vincent and the Grenadines vs French American Indian No Vehicles in Household Correlation Chart
The statistical analysis conducted on geographies consisting of 56,176,539 people shows a poor positive correlation between the proportion of Immigrants from St. Vincent and the Grenadines and percentage of households with no vehicle available in the United States with a correlation coefficient (R) of 0.135 and weighted average of 35.4%. Similarly, the statistical analysis conducted on geographies consisting of 131,848,748 people shows a significant positive correlation between the proportion of French American Indians and percentage of households with no vehicle available in the United States with a correlation coefficient (R) of 0.687 and weighted average of 10.4%, a difference of 239.9%.
No Vehicles in Household Correlation Summary
| Measurement | Immigrants from St. Vincent and the Grenadines | French American Indian |
| Minimum | 0.54% | 0.86% |
| Maximum | 70.0% | 42.3% |
| Range | 69.5% | 41.4% |
| Mean | 19.6% | 9.5% |
| Median | 13.1% | 7.3% |
| Interquartile 25% (IQ1) | 5.1% | 4.9% |
| Interquartile 75% (IQ3) | 22.0% | 10.6% |
| Interquartile Range (IQR) | 16.8% | 5.7% |
| Standard Deviation (Sample) | 19.9% | 8.1% |
| Standard Deviation (Population) | 19.8% | 8.0% |
Similar Demographics by No Vehicles in Household
Demographics Similar to Immigrants from St. Vincent and the Grenadines by No Vehicles in Household
In terms of no vehicles in household, the demographic groups most similar to Immigrants from St. Vincent and the Grenadines are Immigrants from Grenada (37.5%, a difference of 5.8%), Immigrants from Dominican Republic (31.4%, a difference of 12.7%), Inupiat (29.9%, a difference of 18.5%), British West Indian (29.7%, a difference of 19.0%), and Immigrants from Guyana (29.5%, a difference of 20.0%).
| Demographics | Rating | Rank | No Vehicles in Household |
| Immigrants | Trinidad and Tobago | 0.0 /100 | #333 | Tragic 24.6% |
| Immigrants | Bangladesh | 0.0 /100 | #334 | Tragic 25.8% |
| Barbadians | 0.0 /100 | #335 | Tragic 26.1% |
| Vietnamese | 0.0 /100 | #336 | Tragic 26.2% |
| Immigrants | Uzbekistan | 0.0 /100 | #337 | Tragic 26.7% |
| Guyanese | 0.0 /100 | #338 | Tragic 29.3% |
| Dominicans | 0.0 /100 | #339 | Tragic 29.4% |
| Immigrants | Barbados | 0.0 /100 | #340 | Tragic 29.5% |
| Immigrants | Guyana | 0.0 /100 | #341 | Tragic 29.5% |
| British West Indians | 0.0 /100 | #342 | Tragic 29.7% |
| Inupiat | 0.0 /100 | #343 | Tragic 29.9% |
| Immigrants | Dominican Republic | 0.0 /100 | #344 | Tragic 31.4% |
| Immigrants | St. Vincent and the Grenadines | 0.0 /100 | #345 | Tragic 35.4% |
| Immigrants | Grenada | 0.0 /100 | #346 | Tragic 37.5% |
| Yup'ik | 0.0 /100 | #347 | Tragic 45.9% |
Demographics Similar to French American Indians by No Vehicles in Household
In terms of no vehicles in household, the demographic groups most similar to French American Indians are Immigrants from Burma/Myanmar (10.4%, a difference of 0.0%), Immigrants from El Salvador (10.4%, a difference of 0.010%), Immigrants from Sudan (10.4%, a difference of 0.12%), Filipino (10.4%, a difference of 0.13%), and Immigrants from Ethiopia (10.4%, a difference of 0.16%).
| Demographics | Rating | Rank | No Vehicles in Household |
| Lumbee | 54.7 /100 | #169 | Average 10.3% |
| Immigrants | Latin America | 53.2 /100 | #170 | Average 10.4% |
| Hmong | 52.7 /100 | #171 | Average 10.4% |
| Brazilians | 51.7 /100 | #172 | Average 10.4% |
| Filipinos | 50.1 /100 | #173 | Average 10.4% |
| Immigrants | Sudan | 50.0 /100 | #174 | Average 10.4% |
| Immigrants | Burma/Myanmar | 49.1 /100 | #175 | Average 10.4% |
| French American Indians | 49.1 /100 | #176 | Average 10.4% |
| Immigrants | El Salvador | 49.1 /100 | #177 | Average 10.4% |
| Immigrants | Ethiopia | 48.0 /100 | #178 | Average 10.4% |
| Ethiopians | 45.8 /100 | #179 | Average 10.5% |
| Arabs | 45.3 /100 | #180 | Average 10.5% |
| Immigrants | Colombia | 44.1 /100 | #181 | Average 10.5% |
| Immigrants | Bulgaria | 43.8 /100 | #182 | Average 10.5% |
| Natives/Alaskans | 43.7 /100 | #183 | Average 10.5% |