Syrian vs Scotch-Irish No Vehicles in Household
COMPARE
Syrian
Scotch-Irish
No Vehicles in Household
No Vehicles in Household Comparison
Syrians
Scotch-Irish
9.7%
NO VEHICLES IN HOUSEHOLD
87.1/ 100
METRIC RATING
134th/ 347
METRIC RANK
6.8%
NO VEHICLES IN HOUSEHOLD
100.0/ 100
METRIC RATING
9th/ 347
METRIC RANK
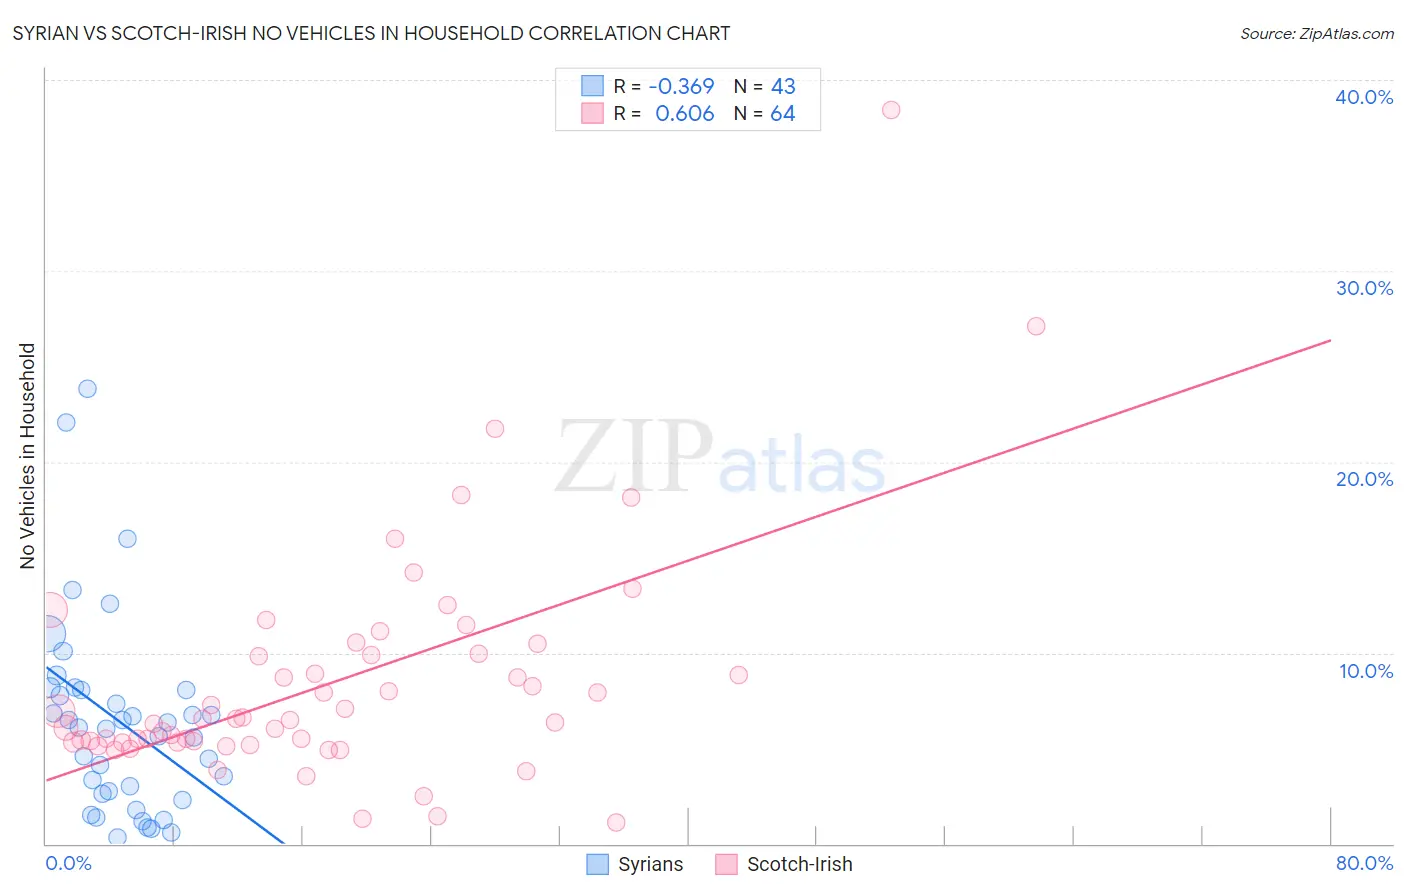
Syrian vs Scotch-Irish No Vehicles in Household Correlation Chart
The statistical analysis conducted on geographies consisting of 265,903,344 people shows a mild negative correlation between the proportion of Syrians and percentage of households with no vehicle available in the United States with a correlation coefficient (R) of -0.369 and weighted average of 9.7%. Similarly, the statistical analysis conducted on geographies consisting of 544,331,951 people shows a significant positive correlation between the proportion of Scotch-Irish and percentage of households with no vehicle available in the United States with a correlation coefficient (R) of 0.606 and weighted average of 6.8%, a difference of 42.9%.
No Vehicles in Household Correlation Summary
| Measurement | Syrian | Scotch-Irish |
| Minimum | 0.29% | 1.1% |
| Maximum | 23.8% | 38.5% |
| Range | 23.5% | 37.4% |
| Mean | 6.4% | 8.4% |
| Median | 6.1% | 6.5% |
| Interquartile 25% (IQ1) | 2.6% | 5.3% |
| Interquartile 75% (IQ3) | 8.0% | 9.9% |
| Interquartile Range (IQR) | 5.4% | 4.6% |
| Standard Deviation (Sample) | 5.2% | 6.0% |
| Standard Deviation (Population) | 5.1% | 6.0% |
Similar Demographics by No Vehicles in Household
Demographics Similar to Syrians by No Vehicles in Household
In terms of no vehicles in household, the demographic groups most similar to Syrians are Immigrants from Oceania (9.7%, a difference of 0.020%), Kenyan (9.7%, a difference of 0.32%), Immigrants from the Azores (9.7%, a difference of 0.39%), Latvian (9.8%, a difference of 0.58%), and Burmese (9.7%, a difference of 0.60%).
| Demographics | Rating | Rank | No Vehicles in Household |
| Immigrants | Kenya | 89.7 /100 | #127 | Excellent 9.6% |
| Immigrants | Syria | 89.5 /100 | #128 | Excellent 9.6% |
| Nicaraguans | 89.5 /100 | #129 | Excellent 9.7% |
| Burmese | 88.8 /100 | #130 | Excellent 9.7% |
| Immigrants | Azores | 88.2 /100 | #131 | Excellent 9.7% |
| Kenyans | 88.0 /100 | #132 | Excellent 9.7% |
| Immigrants | Oceania | 87.1 /100 | #133 | Excellent 9.7% |
| Syrians | 87.1 /100 | #134 | Excellent 9.7% |
| Latvians | 85.1 /100 | #135 | Excellent 9.8% |
| Immigrants | South Africa | 85.0 /100 | #136 | Excellent 9.8% |
| Immigrants | Moldova | 84.6 /100 | #137 | Excellent 9.8% |
| Estonians | 84.2 /100 | #138 | Excellent 9.8% |
| Marshallese | 84.0 /100 | #139 | Excellent 9.8% |
| Immigrants | Lithuania | 84.0 /100 | #140 | Excellent 9.8% |
| Sudanese | 83.1 /100 | #141 | Excellent 9.8% |
Demographics Similar to Scotch-Irish by No Vehicles in Household
In terms of no vehicles in household, the demographic groups most similar to Scotch-Irish are Swedish (6.8%, a difference of 0.21%), Dutch (6.8%, a difference of 0.51%), Scottish (6.8%, a difference of 0.68%), Czech (6.9%, a difference of 1.1%), and German (6.7%, a difference of 2.0%).
| Demographics | Rating | Rank | No Vehicles in Household |
| Norwegians | 100.0 /100 | #2 | Exceptional 6.4% |
| English | 100.0 /100 | #3 | Exceptional 6.5% |
| Danes | 100.0 /100 | #4 | Exceptional 6.6% |
| Yakama | 100.0 /100 | #5 | Exceptional 6.6% |
| Germans | 100.0 /100 | #6 | Exceptional 6.7% |
| Scottish | 100.0 /100 | #7 | Exceptional 6.8% |
| Swedes | 100.0 /100 | #8 | Exceptional 6.8% |
| Scotch-Irish | 100.0 /100 | #9 | Exceptional 6.8% |
| Dutch | 100.0 /100 | #10 | Exceptional 6.8% |
| Czechs | 100.0 /100 | #11 | Exceptional 6.9% |
| Assyrians/Chaldeans/Syriacs | 100.0 /100 | #12 | Exceptional 7.0% |
| Scandinavians | 100.0 /100 | #13 | Exceptional 7.0% |
| Mexicans | 100.0 /100 | #14 | Exceptional 7.0% |
| Whites/Caucasians | 100.0 /100 | #15 | Exceptional 7.0% |
| Europeans | 100.0 /100 | #16 | Exceptional 7.1% |