Syrian vs Scotch-Irish Unemployment Among Ages 35 to 44 years
COMPARE
Syrian
Scotch-Irish
Unemployment Among Ages 35 to 44 years
Unemployment Among Ages 35 to 44 years Comparison
Syrians
Scotch-Irish
4.6%
UNEMPLOYMENT AMONG AGES 35 TO 44 YEARS
80.7/ 100
METRIC RATING
133rd/ 347
METRIC RANK
4.6%
UNEMPLOYMENT AMONG AGES 35 TO 44 YEARS
79.3/ 100
METRIC RATING
136th/ 347
METRIC RANK
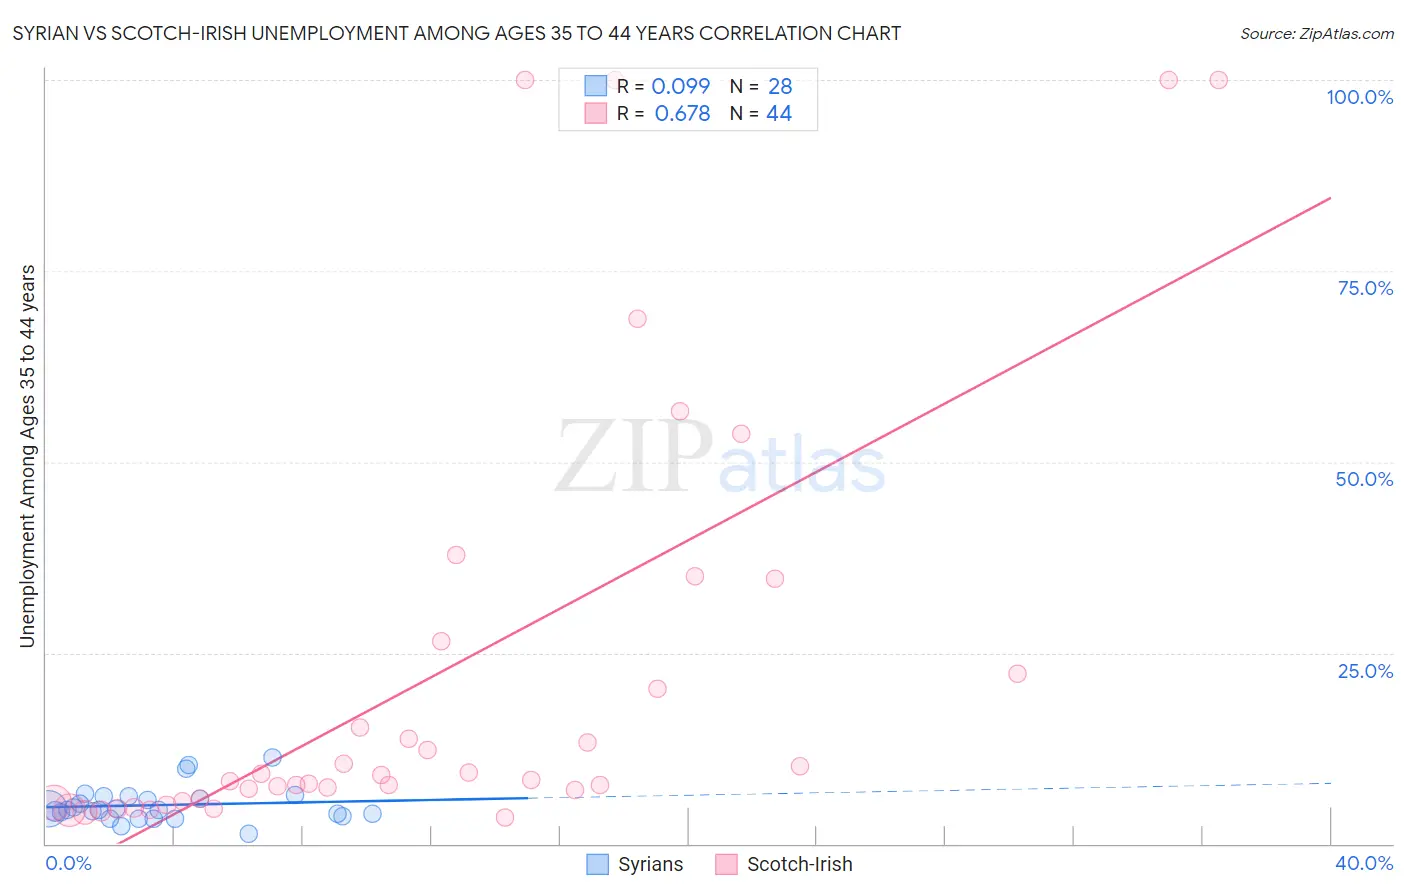
Syrian vs Scotch-Irish Unemployment Among Ages 35 to 44 years Correlation Chart
The statistical analysis conducted on geographies consisting of 262,414,957 people shows a slight positive correlation between the proportion of Syrians and unemployment rate among population between the ages 35 and 44 in the United States with a correlation coefficient (R) of 0.099 and weighted average of 4.6%. Similarly, the statistical analysis conducted on geographies consisting of 513,888,512 people shows a significant positive correlation between the proportion of Scotch-Irish and unemployment rate among population between the ages 35 and 44 in the United States with a correlation coefficient (R) of 0.678 and weighted average of 4.6%, a difference of 0.16%.
Unemployment Among Ages 35 to 44 years Correlation Summary
| Measurement | Syrian | Scotch-Irish |
| Minimum | 1.3% | 3.5% |
| Maximum | 11.3% | 100.0% |
| Range | 10.0% | 96.5% |
| Mean | 5.1% | 22.5% |
| Median | 4.4% | 8.6% |
| Interquartile 25% (IQ1) | 3.7% | 5.8% |
| Interquartile 75% (IQ3) | 6.0% | 24.4% |
| Interquartile Range (IQR) | 2.3% | 18.6% |
| Standard Deviation (Sample) | 2.3% | 28.9% |
| Standard Deviation (Population) | 2.2% | 28.6% |
Demographics Similar to Syrians and Scotch-Irish by Unemployment Among Ages 35 to 44 years
In terms of unemployment among ages 35 to 44 years, the demographic groups most similar to Syrians are Colombian (4.6%, a difference of 0.020%), Laotian (4.6%, a difference of 0.070%), Immigrants from Europe (4.6%, a difference of 0.14%), Immigrants from Iraq (4.6%, a difference of 0.20%), and Immigrants from Colombia (4.6%, a difference of 0.24%). Similarly, the demographic groups most similar to Scotch-Irish are Immigrants from Europe (4.6%, a difference of 0.010%), Immigrants from Iraq (4.6%, a difference of 0.040%), Laotian (4.6%, a difference of 0.090%), Colombian (4.6%, a difference of 0.17%), and Immigrants from Norway (4.6%, a difference of 0.19%).
| Demographics | Rating | Rank | Unemployment Among Ages 35 to 44 years |
| Immigrants | Spain | 86.1 /100 | #124 | Excellent 4.5% |
| Immigrants | Northern Africa | 86.1 /100 | #125 | Excellent 4.5% |
| Immigrants | Austria | 84.7 /100 | #126 | Excellent 4.5% |
| Immigrants | Ethiopia | 84.7 /100 | #127 | Excellent 4.5% |
| Czechoslovakians | 83.4 /100 | #128 | Excellent 4.6% |
| Immigrants | Croatia | 83.1 /100 | #129 | Excellent 4.6% |
| Immigrants | Eritrea | 82.8 /100 | #130 | Excellent 4.6% |
| Immigrants | Colombia | 82.6 /100 | #131 | Excellent 4.6% |
| Colombians | 80.8 /100 | #132 | Excellent 4.6% |
| Syrians | 80.7 /100 | #133 | Excellent 4.6% |
| Laotians | 80.1 /100 | #134 | Excellent 4.6% |
| Immigrants | Europe | 79.4 /100 | #135 | Good 4.6% |
| Scotch-Irish | 79.3 /100 | #136 | Good 4.6% |
| Immigrants | Iraq | 78.9 /100 | #137 | Good 4.6% |
| Immigrants | Norway | 77.5 /100 | #138 | Good 4.6% |
| Immigrants | Hungary | 76.3 /100 | #139 | Good 4.6% |
| Immigrants | Eastern Africa | 76.0 /100 | #140 | Good 4.6% |
| Canadians | 75.9 /100 | #141 | Good 4.6% |
| Ukrainians | 75.8 /100 | #142 | Good 4.6% |
| Immigrants | Switzerland | 75.5 /100 | #143 | Good 4.6% |
| Immigrants | Russia | 75.4 /100 | #144 | Good 4.6% |