Syrian vs Kenyan No Vehicles in Household
COMPARE
Syrian
Kenyan
No Vehicles in Household
No Vehicles in Household Comparison
Syrians
Kenyans
9.7%
NO VEHICLES IN HOUSEHOLD
87.1/ 100
METRIC RATING
134th/ 347
METRIC RANK
9.7%
NO VEHICLES IN HOUSEHOLD
88.0/ 100
METRIC RATING
132nd/ 347
METRIC RANK
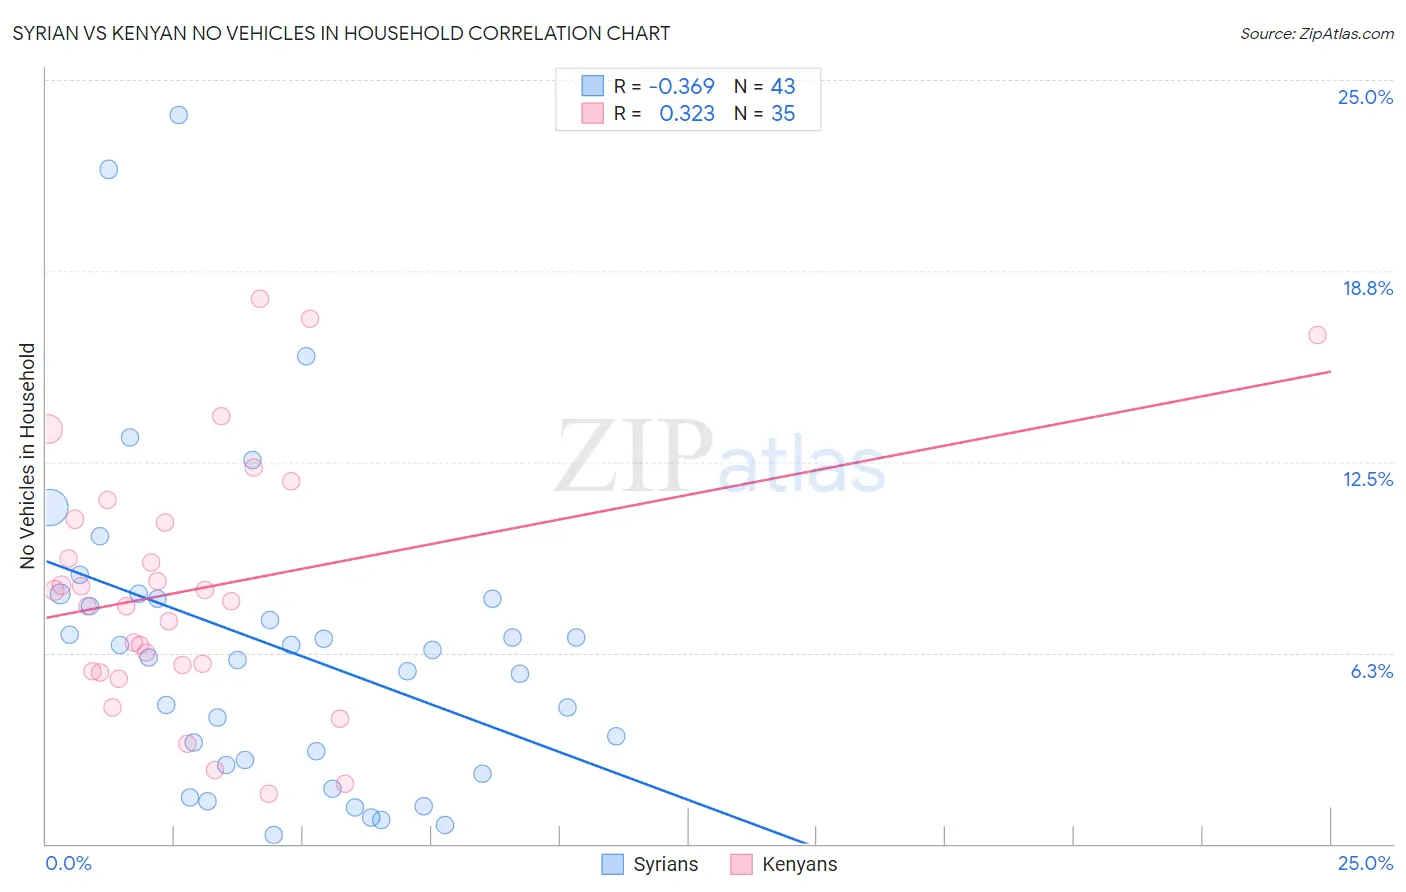
Syrian vs Kenyan No Vehicles in Household Correlation Chart
The statistical analysis conducted on geographies consisting of 265,903,344 people shows a mild negative correlation between the proportion of Syrians and percentage of households with no vehicle available in the United States with a correlation coefficient (R) of -0.369 and weighted average of 9.7%. Similarly, the statistical analysis conducted on geographies consisting of 168,125,238 people shows a mild positive correlation between the proportion of Kenyans and percentage of households with no vehicle available in the United States with a correlation coefficient (R) of 0.323 and weighted average of 9.7%, a difference of 0.32%.
No Vehicles in Household Correlation Summary
| Measurement | Syrian | Kenyan |
| Minimum | 0.29% | 1.6% |
| Maximum | 23.8% | 17.8% |
| Range | 23.5% | 16.2% |
| Mean | 6.4% | 8.4% |
| Median | 6.1% | 7.9% |
| Interquartile 25% (IQ1) | 2.6% | 5.6% |
| Interquartile 75% (IQ3) | 8.0% | 10.6% |
| Interquartile Range (IQR) | 5.4% | 5.0% |
| Standard Deviation (Sample) | 5.2% | 4.1% |
| Standard Deviation (Population) | 5.1% | 4.0% |
Demographics Similar to Syrians and Kenyans by No Vehicles in Household
In terms of no vehicles in household, the demographic groups most similar to Syrians are Immigrants from Oceania (9.7%, a difference of 0.020%), Immigrants from the Azores (9.7%, a difference of 0.39%), Latvian (9.8%, a difference of 0.58%), Burmese (9.7%, a difference of 0.60%), and Immigrants from South Africa (9.8%, a difference of 0.63%). Similarly, the demographic groups most similar to Kenyans are Immigrants from the Azores (9.7%, a difference of 0.070%), Burmese (9.7%, a difference of 0.28%), Immigrants from Oceania (9.7%, a difference of 0.30%), Nicaraguan (9.7%, a difference of 0.53%), and Immigrants from Syria (9.6%, a difference of 0.56%).
| Demographics | Rating | Rank | No Vehicles in Household |
| Blackfeet | 91.4 /100 | #123 | Exceptional 9.6% |
| Immigrants | Korea | 90.9 /100 | #124 | Exceptional 9.6% |
| Immigrants | Cameroon | 90.6 /100 | #125 | Exceptional 9.6% |
| Icelanders | 90.2 /100 | #126 | Exceptional 9.6% |
| Immigrants | Kenya | 89.7 /100 | #127 | Excellent 9.6% |
| Immigrants | Syria | 89.5 /100 | #128 | Excellent 9.6% |
| Nicaraguans | 89.5 /100 | #129 | Excellent 9.7% |
| Burmese | 88.8 /100 | #130 | Excellent 9.7% |
| Immigrants | Azores | 88.2 /100 | #131 | Excellent 9.7% |
| Kenyans | 88.0 /100 | #132 | Excellent 9.7% |
| Immigrants | Oceania | 87.1 /100 | #133 | Excellent 9.7% |
| Syrians | 87.1 /100 | #134 | Excellent 9.7% |
| Latvians | 85.1 /100 | #135 | Excellent 9.8% |
| Immigrants | South Africa | 85.0 /100 | #136 | Excellent 9.8% |
| Immigrants | Moldova | 84.6 /100 | #137 | Excellent 9.8% |
| Estonians | 84.2 /100 | #138 | Excellent 9.8% |
| Marshallese | 84.0 /100 | #139 | Excellent 9.8% |
| Immigrants | Lithuania | 84.0 /100 | #140 | Excellent 9.8% |
| Sudanese | 83.1 /100 | #141 | Excellent 9.8% |
| Immigrants | Zimbabwe | 82.6 /100 | #142 | Excellent 9.9% |
| Chileans | 81.2 /100 | #143 | Excellent 9.9% |