Immigrants from Guatemala vs Scotch-Irish No Vehicles in Household
COMPARE
Immigrants from Guatemala
Scotch-Irish
No Vehicles in Household
No Vehicles in Household Comparison
Immigrants from Guatemala
Scotch-Irish
11.2%
NO VEHICLES IN HOUSEHOLD
10.0/ 100
METRIC RATING
218th/ 347
METRIC RANK
6.8%
NO VEHICLES IN HOUSEHOLD
100.0/ 100
METRIC RATING
9th/ 347
METRIC RANK
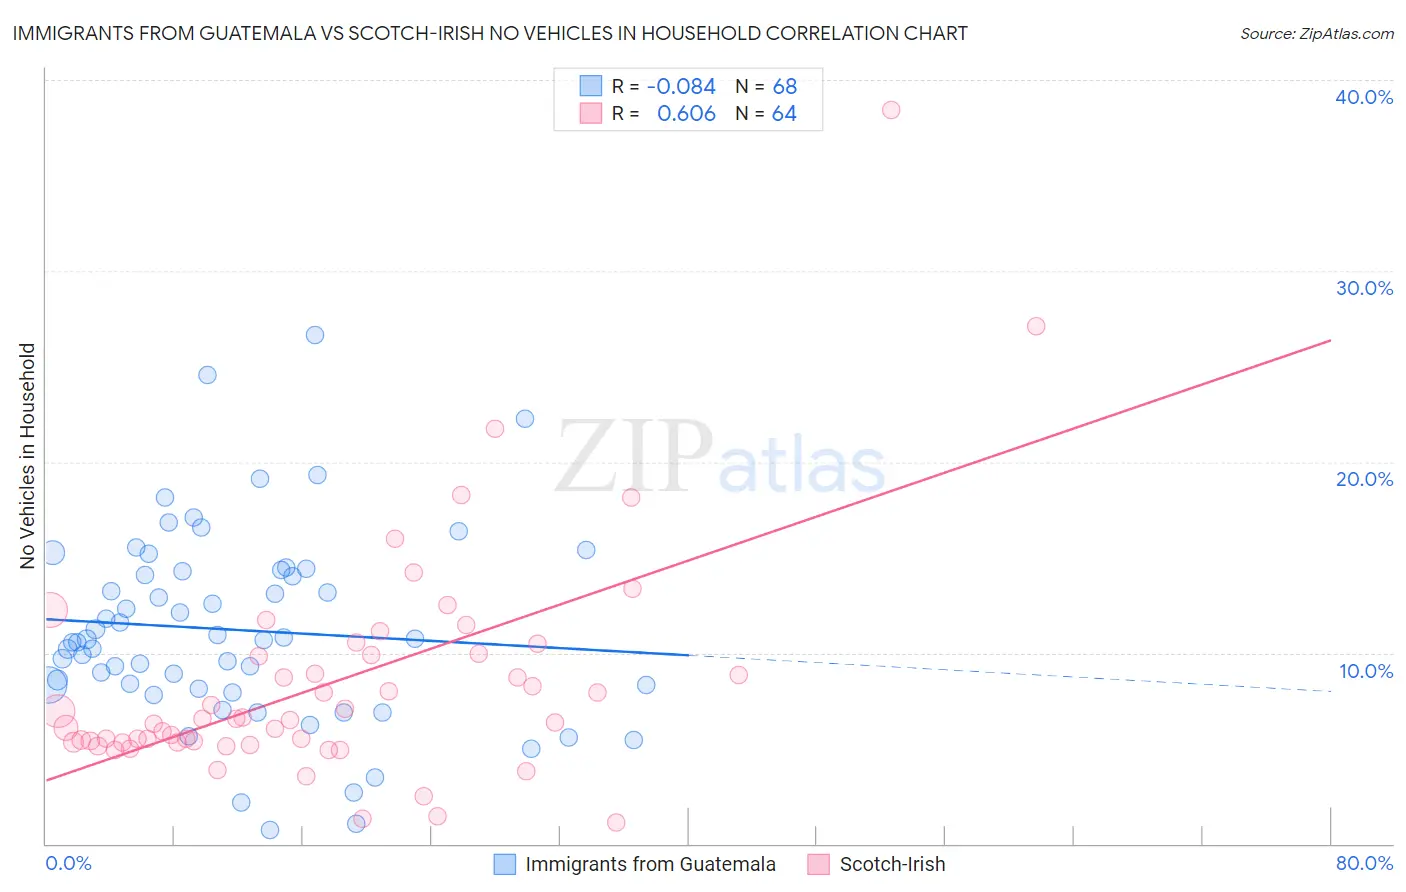
Immigrants from Guatemala vs Scotch-Irish No Vehicles in Household Correlation Chart
The statistical analysis conducted on geographies consisting of 376,643,696 people shows a slight negative correlation between the proportion of Immigrants from Guatemala and percentage of households with no vehicle available in the United States with a correlation coefficient (R) of -0.084 and weighted average of 11.2%. Similarly, the statistical analysis conducted on geographies consisting of 544,331,951 people shows a significant positive correlation between the proportion of Scotch-Irish and percentage of households with no vehicle available in the United States with a correlation coefficient (R) of 0.606 and weighted average of 6.8%, a difference of 64.2%.
No Vehicles in Household Correlation Summary
| Measurement | Immigrants from Guatemala | Scotch-Irish |
| Minimum | 0.74% | 1.1% |
| Maximum | 26.6% | 38.5% |
| Range | 25.9% | 37.4% |
| Mean | 11.2% | 8.4% |
| Median | 10.7% | 6.5% |
| Interquartile 25% (IQ1) | 8.2% | 5.3% |
| Interquartile 75% (IQ3) | 14.3% | 9.9% |
| Interquartile Range (IQR) | 6.1% | 4.6% |
| Standard Deviation (Sample) | 5.1% | 6.0% |
| Standard Deviation (Population) | 5.1% | 6.0% |
Similar Demographics by No Vehicles in Household
Demographics Similar to Immigrants from Guatemala by No Vehicles in Household
In terms of no vehicles in household, the demographic groups most similar to Immigrants from Guatemala are Dutch West Indian (11.2%, a difference of 0.10%), Argentinean (11.2%, a difference of 0.12%), Immigrants from Zaire (11.2%, a difference of 0.14%), Immigrants from Argentina (11.2%, a difference of 0.22%), and Immigrants from Sri Lanka (11.2%, a difference of 0.23%).
| Demographics | Rating | Rank | No Vehicles in Household |
| Crow | 14.2 /100 | #211 | Poor 11.0% |
| Immigrants | Western Asia | 13.9 /100 | #212 | Poor 11.0% |
| Immigrants | Hungary | 12.3 /100 | #213 | Poor 11.1% |
| Immigrants | Denmark | 12.1 /100 | #214 | Poor 11.1% |
| Immigrants | Sri Lanka | 10.6 /100 | #215 | Poor 11.2% |
| Immigrants | Argentina | 10.6 /100 | #216 | Poor 11.2% |
| Dutch West Indians | 10.2 /100 | #217 | Poor 11.2% |
| Immigrants | Guatemala | 10.0 /100 | #218 | Tragic 11.2% |
| Argentineans | 9.6 /100 | #219 | Tragic 11.2% |
| Immigrants | Zaire | 9.6 /100 | #220 | Tragic 11.2% |
| Peruvians | 8.4 /100 | #221 | Tragic 11.2% |
| Immigrants | South America | 8.0 /100 | #222 | Tragic 11.3% |
| Uruguayans | 7.7 /100 | #223 | Tragic 11.3% |
| Immigrants | Hong Kong | 7.2 /100 | #224 | Tragic 11.3% |
| Immigrants | Sierra Leone | 6.4 /100 | #225 | Tragic 11.3% |
Demographics Similar to Scotch-Irish by No Vehicles in Household
In terms of no vehicles in household, the demographic groups most similar to Scotch-Irish are Swedish (6.8%, a difference of 0.21%), Dutch (6.8%, a difference of 0.51%), Scottish (6.8%, a difference of 0.68%), Czech (6.9%, a difference of 1.1%), and German (6.7%, a difference of 2.0%).
| Demographics | Rating | Rank | No Vehicles in Household |
| Norwegians | 100.0 /100 | #2 | Exceptional 6.4% |
| English | 100.0 /100 | #3 | Exceptional 6.5% |
| Danes | 100.0 /100 | #4 | Exceptional 6.6% |
| Yakama | 100.0 /100 | #5 | Exceptional 6.6% |
| Germans | 100.0 /100 | #6 | Exceptional 6.7% |
| Scottish | 100.0 /100 | #7 | Exceptional 6.8% |
| Swedes | 100.0 /100 | #8 | Exceptional 6.8% |
| Scotch-Irish | 100.0 /100 | #9 | Exceptional 6.8% |
| Dutch | 100.0 /100 | #10 | Exceptional 6.8% |
| Czechs | 100.0 /100 | #11 | Exceptional 6.9% |
| Assyrians/Chaldeans/Syriacs | 100.0 /100 | #12 | Exceptional 7.0% |
| Scandinavians | 100.0 /100 | #13 | Exceptional 7.0% |
| Mexicans | 100.0 /100 | #14 | Exceptional 7.0% |
| Whites/Caucasians | 100.0 /100 | #15 | Exceptional 7.0% |
| Europeans | 100.0 /100 | #16 | Exceptional 7.1% |