Swiss vs Ottawa 1 or more Vehicles in Household
COMPARE
Swiss
Ottawa
1 or more Vehicles in Household
1 or more Vehicles in Household Comparison
Swiss
Ottawa
92.3%
1 OR MORE VEHICLES IN HOUSEHOLD
99.9/ 100
METRIC RATING
39th/ 347
METRIC RANK
92.7%
1 OR MORE VEHICLES IN HOUSEHOLD
100.0/ 100
METRIC RATING
21st/ 347
METRIC RANK
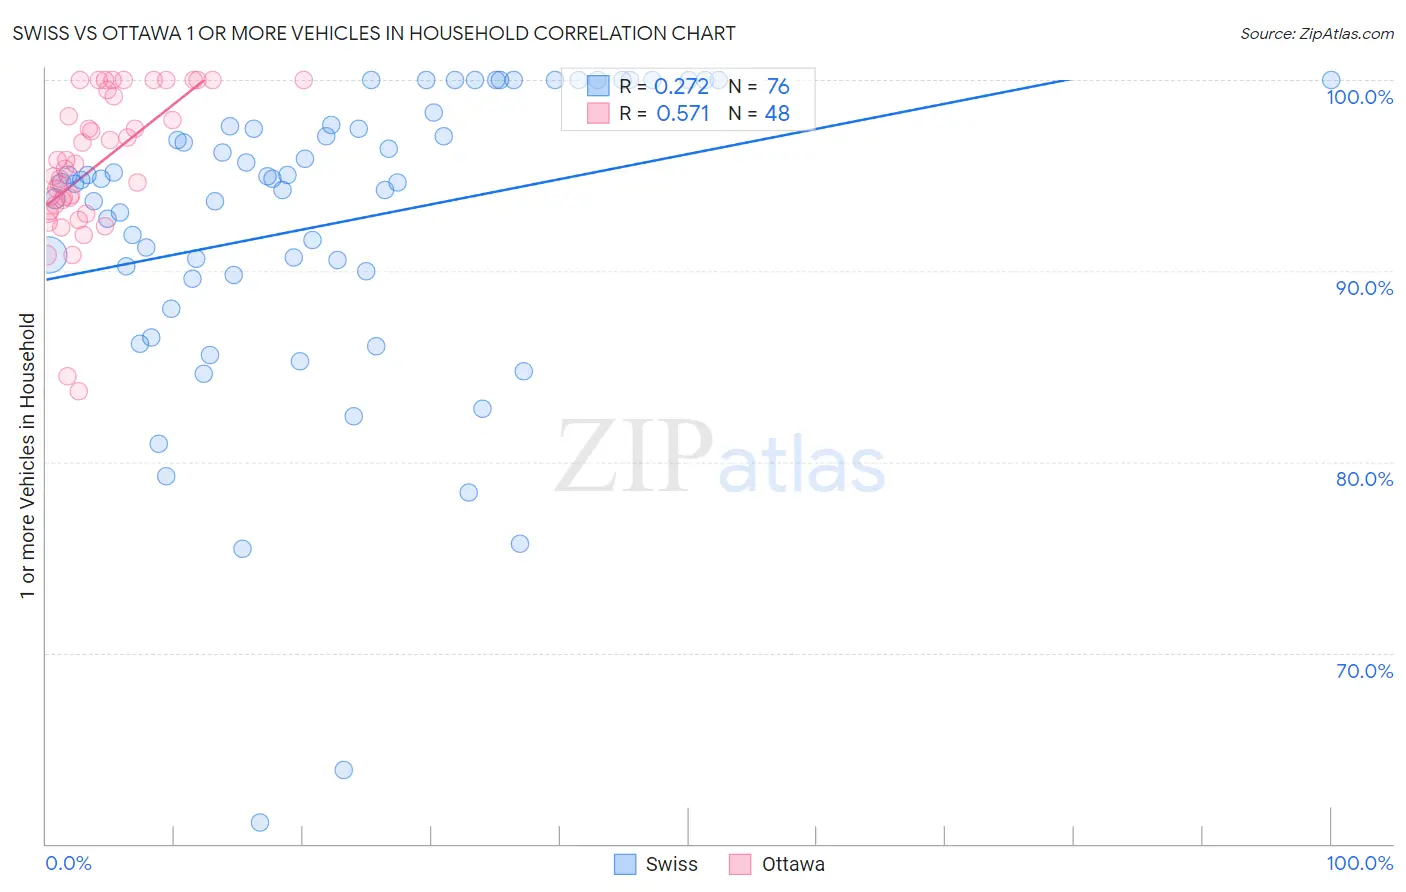
Swiss vs Ottawa 1 or more Vehicles in Household Correlation Chart
The statistical analysis conducted on geographies consisting of 464,812,678 people shows a weak positive correlation between the proportion of Swiss and percentage of households with 1 or more vehicles available in the United States with a correlation coefficient (R) of 0.272 and weighted average of 92.3%. Similarly, the statistical analysis conducted on geographies consisting of 49,944,544 people shows a substantial positive correlation between the proportion of Ottawa and percentage of households with 1 or more vehicles available in the United States with a correlation coefficient (R) of 0.571 and weighted average of 92.7%, a difference of 0.44%.
1 or more Vehicles in Household Correlation Summary
| Measurement | Swiss | Ottawa |
| Minimum | 61.1% | 83.7% |
| Maximum | 100.0% | 100.0% |
| Range | 38.9% | 16.3% |
| Mean | 92.4% | 95.6% |
| Median | 94.7% | 95.5% |
| Interquartile 25% (IQ1) | 89.9% | 93.3% |
| Interquartile 75% (IQ3) | 97.6% | 99.3% |
| Interquartile Range (IQR) | 7.7% | 6.0% |
| Standard Deviation (Sample) | 8.0% | 3.8% |
| Standard Deviation (Population) | 7.9% | 3.8% |
Demographics Similar to Swiss and Ottawa by 1 or more Vehicles in Household
In terms of 1 or more vehicles in household, the demographic groups most similar to Swiss are Creek (92.3%, a difference of 0.0%), French Canadian (92.3%, a difference of 0.010%), Immigrants from Vietnam (92.3%, a difference of 0.010%), Czechoslovakian (92.3%, a difference of 0.020%), and Malaysian (92.3%, a difference of 0.020%). Similarly, the demographic groups most similar to Ottawa are French (92.7%, a difference of 0.010%), Arapaho (92.7%, a difference of 0.020%), Nepalese (92.6%, a difference of 0.080%), Yaqui (92.6%, a difference of 0.15%), and Immigrants from Iraq (92.5%, a difference of 0.17%).
| Demographics | Rating | Rank | 1 or more Vehicles in Household |
| Arapaho | 100.0 /100 | #20 | Exceptional 92.7% |
| Ottawa | 100.0 /100 | #21 | Exceptional 92.7% |
| French | 100.0 /100 | #22 | Exceptional 92.7% |
| Nepalese | 100.0 /100 | #23 | Exceptional 92.6% |
| Yaqui | 100.0 /100 | #24 | Exceptional 92.6% |
| Immigrants | Iraq | 100.0 /100 | #25 | Exceptional 92.5% |
| British | 100.0 /100 | #26 | Exceptional 92.5% |
| Americans | 100.0 /100 | #27 | Exceptional 92.5% |
| Sri Lankans | 100.0 /100 | #28 | Exceptional 92.5% |
| Native Hawaiians | 100.0 /100 | #29 | Exceptional 92.4% |
| Finns | 100.0 /100 | #30 | Exceptional 92.4% |
| Samoans | 100.0 /100 | #31 | Exceptional 92.4% |
| Basques | 100.0 /100 | #32 | Exceptional 92.4% |
| Cherokee | 100.0 /100 | #33 | Exceptional 92.4% |
| Italians | 99.9 /100 | #34 | Exceptional 92.3% |
| Czechoslovakians | 99.9 /100 | #35 | Exceptional 92.3% |
| Malaysians | 99.9 /100 | #36 | Exceptional 92.3% |
| French Canadians | 99.9 /100 | #37 | Exceptional 92.3% |
| Immigrants | Vietnam | 99.9 /100 | #38 | Exceptional 92.3% |
| Swiss | 99.9 /100 | #39 | Exceptional 92.3% |
| Creek | 99.9 /100 | #40 | Exceptional 92.3% |