Swiss vs Alaska Native 1 or more Vehicles in Household
COMPARE
Swiss
Alaska Native
1 or more Vehicles in Household
1 or more Vehicles in Household Comparison
Swiss
Alaska Natives
92.3%
1 OR MORE VEHICLES IN HOUSEHOLD
99.9/ 100
METRIC RATING
39th/ 347
METRIC RANK
83.8%
1 OR MORE VEHICLES IN HOUSEHOLD
0.0/ 100
METRIC RATING
316th/ 347
METRIC RANK
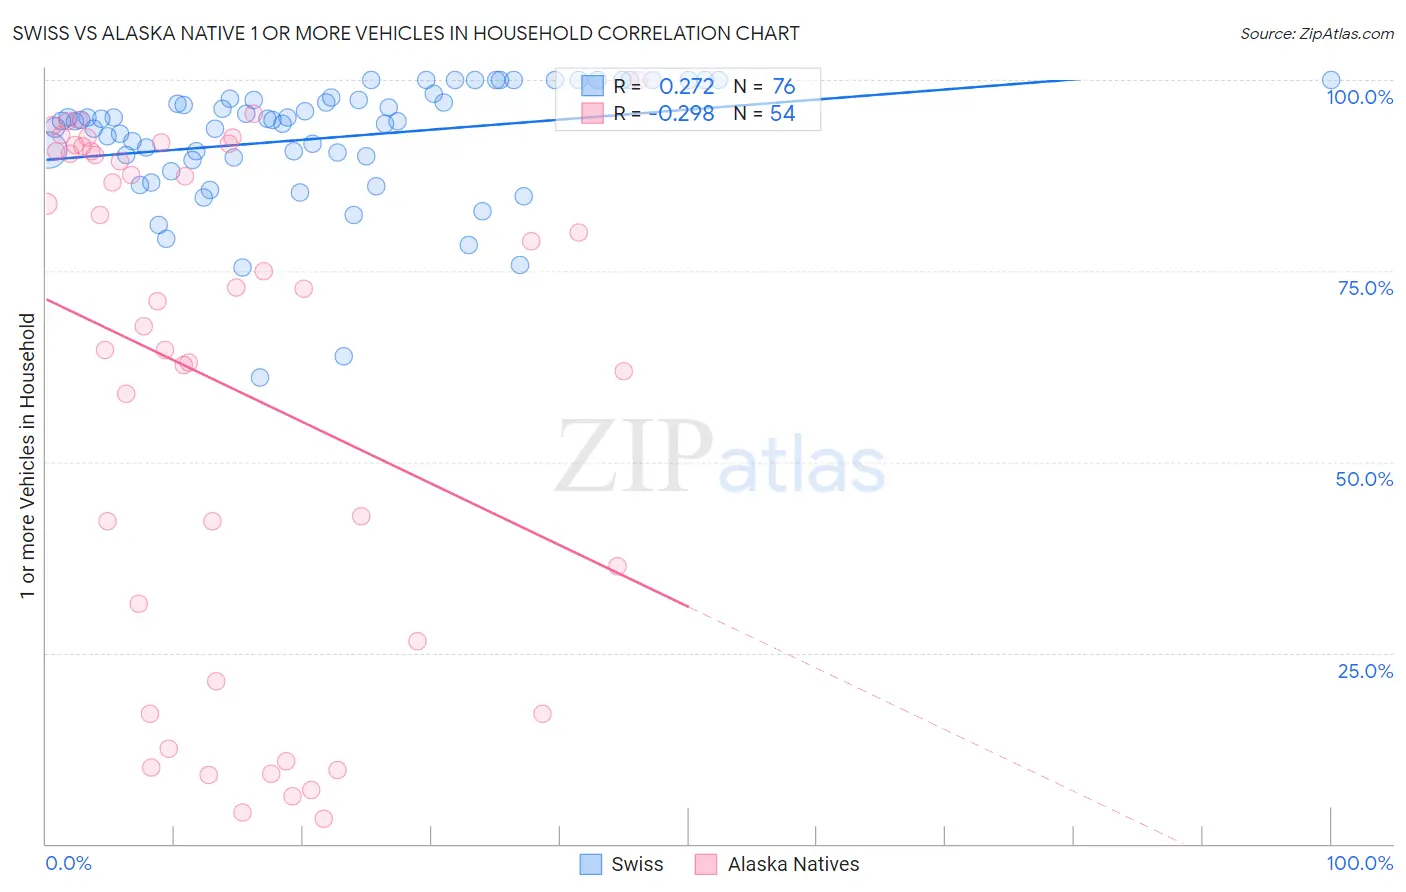
Swiss vs Alaska Native 1 or more Vehicles in Household Correlation Chart
The statistical analysis conducted on geographies consisting of 464,812,678 people shows a weak positive correlation between the proportion of Swiss and percentage of households with 1 or more vehicles available in the United States with a correlation coefficient (R) of 0.272 and weighted average of 92.3%. Similarly, the statistical analysis conducted on geographies consisting of 76,754,392 people shows a weak negative correlation between the proportion of Alaska Natives and percentage of households with 1 or more vehicles available in the United States with a correlation coefficient (R) of -0.298 and weighted average of 83.8%, a difference of 10.1%.
1 or more Vehicles in Household Correlation Summary
| Measurement | Swiss | Alaska Native |
| Minimum | 61.1% | 3.3% |
| Maximum | 100.0% | 100.0% |
| Range | 38.9% | 96.7% |
| Mean | 92.4% | 60.3% |
| Median | 94.7% | 71.9% |
| Interquartile 25% (IQ1) | 89.9% | 26.5% |
| Interquartile 75% (IQ3) | 97.6% | 90.6% |
| Interquartile Range (IQR) | 7.7% | 64.1% |
| Standard Deviation (Sample) | 8.0% | 33.2% |
| Standard Deviation (Population) | 7.9% | 32.9% |
Similar Demographics by 1 or more Vehicles in Household
Demographics Similar to Swiss by 1 or more Vehicles in Household
In terms of 1 or more vehicles in household, the demographic groups most similar to Swiss are Creek (92.3%, a difference of 0.0%), French Canadian (92.3%, a difference of 0.010%), Immigrants from Vietnam (92.3%, a difference of 0.010%), Czechoslovakian (92.3%, a difference of 0.020%), and Malaysian (92.3%, a difference of 0.020%).
| Demographics | Rating | Rank | 1 or more Vehicles in Household |
| Basques | 100.0 /100 | #32 | Exceptional 92.4% |
| Cherokee | 100.0 /100 | #33 | Exceptional 92.4% |
| Italians | 99.9 /100 | #34 | Exceptional 92.3% |
| Czechoslovakians | 99.9 /100 | #35 | Exceptional 92.3% |
| Malaysians | 99.9 /100 | #36 | Exceptional 92.3% |
| French Canadians | 99.9 /100 | #37 | Exceptional 92.3% |
| Immigrants | Vietnam | 99.9 /100 | #38 | Exceptional 92.3% |
| Swiss | 99.9 /100 | #39 | Exceptional 92.3% |
| Creek | 99.9 /100 | #40 | Exceptional 92.3% |
| Immigrants | Taiwan | 99.9 /100 | #41 | Exceptional 92.3% |
| Chickasaw | 99.9 /100 | #42 | Exceptional 92.3% |
| Spanish | 99.9 /100 | #43 | Exceptional 92.3% |
| Choctaw | 99.9 /100 | #44 | Exceptional 92.2% |
| Immigrants | Nonimmigrants | 99.9 /100 | #45 | Exceptional 92.2% |
| Immigrants | Fiji | 99.9 /100 | #46 | Exceptional 92.2% |
Demographics Similar to Alaska Natives by 1 or more Vehicles in Household
In terms of 1 or more vehicles in household, the demographic groups most similar to Alaska Natives are Ghanaian (83.6%, a difference of 0.22%), Immigrants from Ghana (83.4%, a difference of 0.42%), Immigrants from Belarus (83.3%, a difference of 0.55%), Cypriot (84.4%, a difference of 0.69%), and Albanian (84.4%, a difference of 0.76%).
| Demographics | Rating | Rank | 1 or more Vehicles in Household |
| Immigrants | Haiti | 0.0 /100 | #309 | Tragic 84.7% |
| U.S. Virgin Islanders | 0.0 /100 | #310 | Tragic 84.6% |
| Puerto Ricans | 0.0 /100 | #311 | Tragic 84.6% |
| Cape Verdeans | 0.0 /100 | #312 | Tragic 84.5% |
| Immigrants | Israel | 0.0 /100 | #313 | Tragic 84.5% |
| Albanians | 0.0 /100 | #314 | Tragic 84.4% |
| Cypriots | 0.0 /100 | #315 | Tragic 84.4% |
| Alaska Natives | 0.0 /100 | #316 | Tragic 83.8% |
| Ghanaians | 0.0 /100 | #317 | Tragic 83.6% |
| Immigrants | Ghana | 0.0 /100 | #318 | Tragic 83.4% |
| Immigrants | Belarus | 0.0 /100 | #319 | Tragic 83.3% |
| Soviet Union | 0.0 /100 | #320 | Tragic 82.7% |
| Jamaicans | 0.0 /100 | #321 | Tragic 82.1% |
| Immigrants | Cabo Verde | 0.0 /100 | #322 | Tragic 81.6% |
| Immigrants | Yemen | 0.0 /100 | #323 | Tragic 80.5% |